NTKI - DES: With Price Weakness Is This 3% Yielding Small-Cap Dividend ETF A Buy?
2023-07-12 08:28:36 ET
Summary
- DES features a 3.08% trailing dividend yield and is well-diversified across 119 industries. As with many domestic dividend ETFs offered by WisdomTree, fees are relatively high at 0.38%.
- Despite a quality-focused composite scoring process that screens, DES has a disappointing profitability score, which I calculated using Seeking Alpha Factor Grades. Higher-profitable ETFs like VBR have outperformed.
- Nevertheless, recent price weakness has driven up DES's expected yield to 3.16%, and its constituents are now competitive on other key metrics, including diversification, growth, and valuation.
- I believe profitability should be the single most important screen for small-cap stocks, so I don't think DES is a great long-term buy. However, it looks more attractive than before, so income investors may want to consider it.
Investment Thesis
The WisdomTree U.S. SmallCap Dividend ETF ( DES ) features a 3.08% dividend yield, excellent diversification across 119 industries, and is one of only a handful of monthly dividend payers in the small-cap space. However, it's performed poorly since its inception in June 2006, something I attribute to persistently low quality despite the strategy's best efforts. In particular, DES's exposure to Regional Banks ballooned to 18% late last year, and that's a key reason for recent price weakness.
The good news is that DES is much more competitive with plain-vanilla small-cap value funds than before, at least based on its fundamentals. Quality remains an issue, but it's less pronounced than before, and DES has improved in other critical areas, like diversification, growth, and valuation, since my November 2022 review. Therefore, I've rated DES a solid "hold" from an income investor's perspective, and I look forward to taking you through my reasons why in more detail below.
DES Overview
Strategy Discussion
DES tracks the WisdomTree U.S. SmallCap Dividend Index, which includes the bottom 25% of dividend-paying stocks by market cap after removing the 300 largest. WisdomTree applies a quality screen to its domestic dividend ETFs, which filters for quality (return on equity, return on assets, gross profits over assets, cash flow over assets), and momentum (six- and twelve-month risk-adjusted returns). An equal-weighted composite score is calculated based on these two factors, and stocks falling in the bottom decile are excluded. In addition, the Index has a yield trap screen that excludes securities yielding in the top 5% that also fall in the bottom 50% by composite score.
DES holds 614 securities with market caps between $94 million and $13.04 billion. However, there are several outliers. 95% of holdings have market caps between $120 million and $4.2 billion, and assuming this is the approximate range the Index targets, Mortgage REITs were the most significant casualty of the yield trap screen. To illustrate, the following ten Mortgage REITs yield above 5% and fall within the market cap range but are missing from DES.
- Blackstone Mortgage Trust ( BXMT )
- Arbor Realty Trust ( ABR )
- Hannon Armstrong Sustainable Infrastructure Capital ( HASI )
- Ready Capital ( RC )
- Apollo Commercial Real Estate Finance ( ARI )
- Claros Mortgage Trust ( CMTG )
- Ladder Capital Corp. ( LADR )
- Chimera Investment Corp. ( CIM )
- Two Harbors Investment Corp. ( TWO )
- PennyMac Mortgage Investment Trust ( PMT )
There are 16 other mREITs, plus another 12 from other REIT sectors, that pay above 5%. Since the Index is dividend-dollar-weighted, these exclusions are a crucial reason for DES's somewhat unattractive 3.08% trailing dividend yield. Also, it may be a missed opportunity, as mREITs are highly discounted now, according to Hoya Capital .
Sector Exposures and Top Ten Holdings
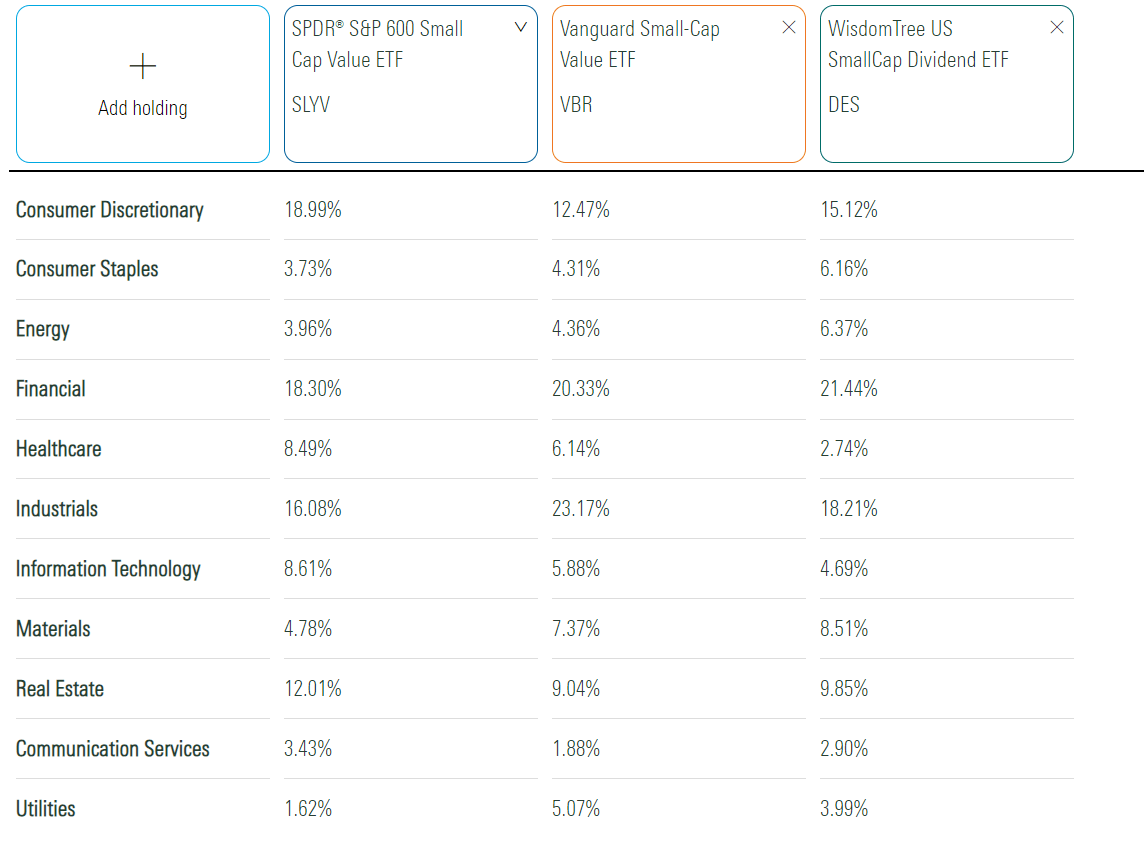
Sector exposures for the SPDR S&P 600 Small Cap Value ETF ( SLYV ), the Vanguard Small-Cap Value ETF ( VBR ), and DES are listed below. All three are well-diversified. DES is overweight Consumer Staples by 2-3%, with the offset in Technology. Otherwise, picking a favorite based on this table alone is hard.
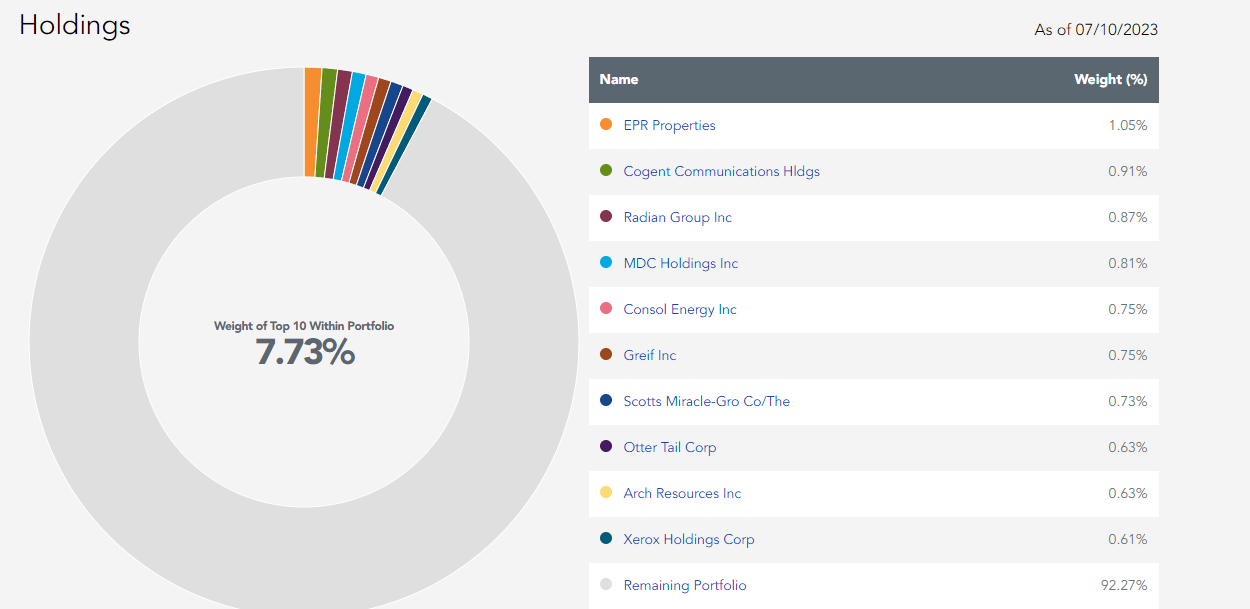
DES's top ten holdings won't provide much information about the composition. Led by EPR Properties ( EPR ), Cogent Communications ( CCOI ), and Radian Group ( RDN ), this list only covers 7.73% of the portfolio.
I'll assess DES at the industry level later in my fundamentals analysis to get a clearer picture. This view will cover 56% of the fund. But first, let's look at performance and dividends.
Performance and Dividends
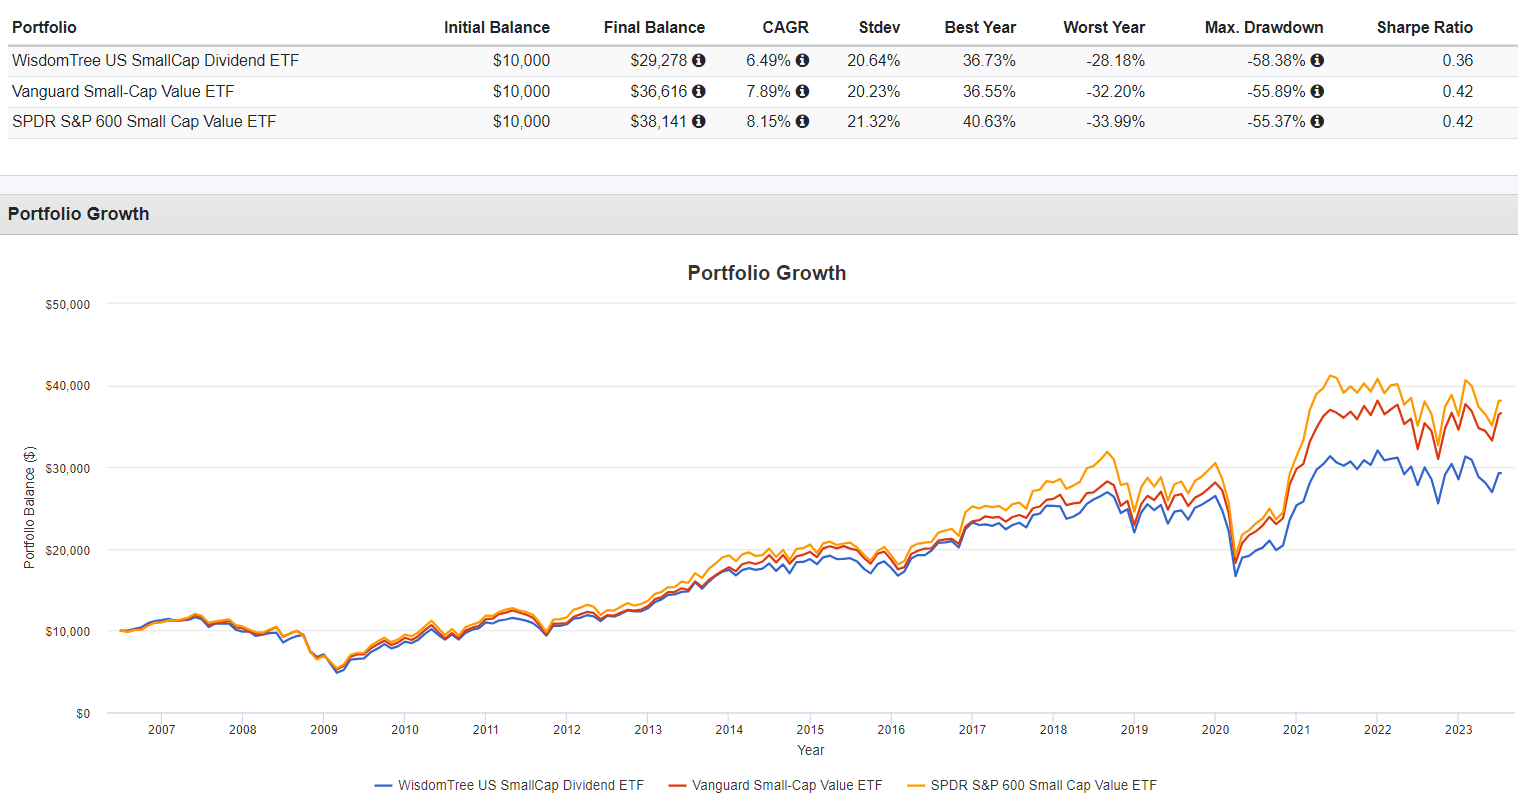
DES launched on June 16, 2006, and has consistently underperformed the VBR and SLYV with similar volatility. On an annualized basis, DES delivered a 6.49% return, 1.40% and 1.66% less than its two value peers.
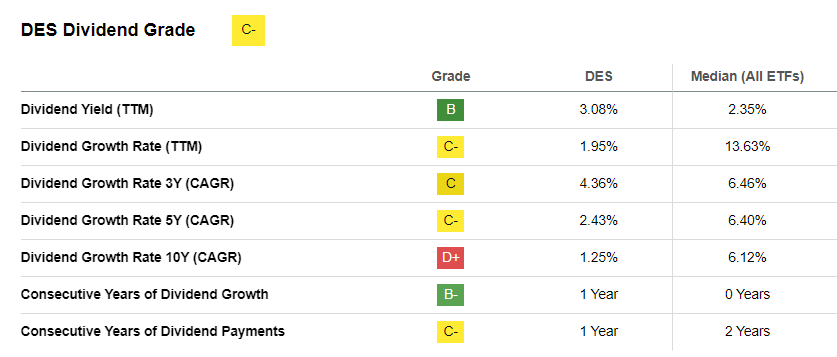
DES outperformed VBR in just five years between 2007-2022. It did slightly better against SLYV (seven years), but this is evidence that WisdomTree's strategy is not optimal. Dividend growth is an issue, too. According to Seeking Alpha, DES earns a poor "C-" Dividend Grade and has a disappointing 1.25% ten-year annualized dividend growth rate.
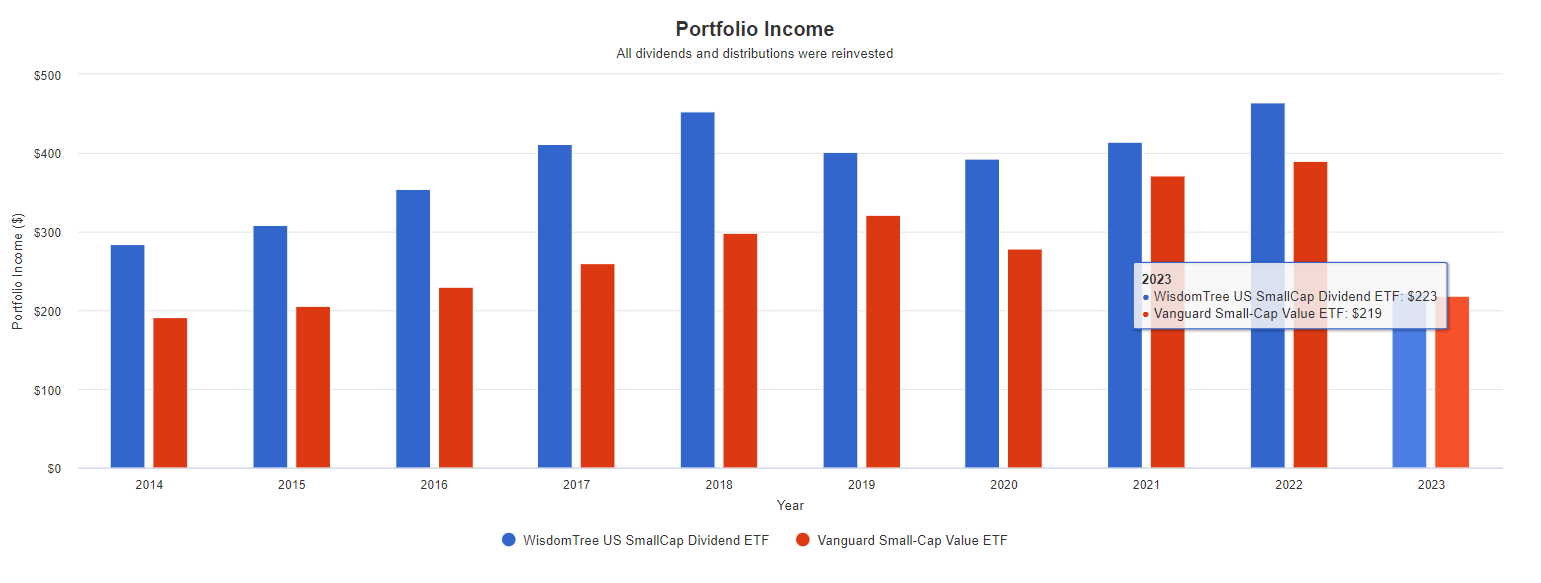
This weak dividend growth has allowed the lower-yielding VBR to catch up over the years, assuming you reinvested your dividends. On a $10,000 initial investment in January 2014, DES and VBR's portfolio income is about equal in 2023, even though DES held about a 1% advantage ten years ago. This significantly reduces the product's attractiveness. Most investors wouldn't consider a 3.08% yield high, especially when short-term government bonds yield above 5%. Furthermore, if there's little dividend growth, there's nothing to look forward to.
DES Fundamentals
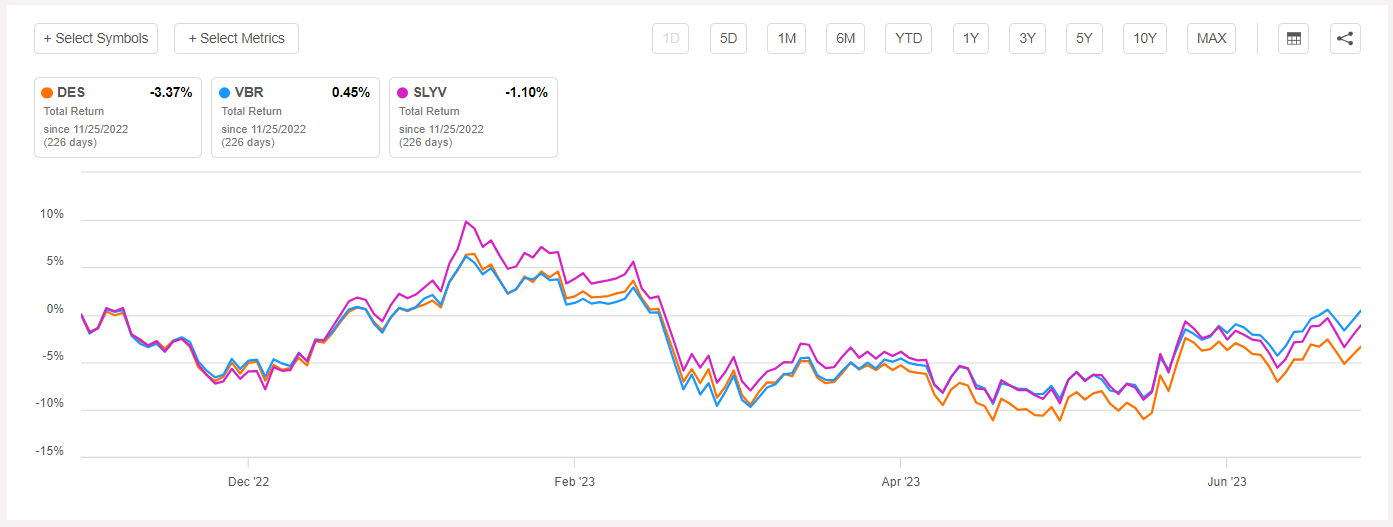
So what's driving these sub-par returns? In November 2022 , I rated DES as a "hold" and asked readers to consider VBR instead. The reason was quality-related, and I wondered if many of DES's holdings should even be paying a dividend in the first place. Here's how it's performed since:
DES lagged VBR by nearly 4% and underperformed SLYV by over 2%. Consider that at the time, DES/VBR had the following key metrics:
- Five-Year Beta: 1.04 vs. 1.22
- Estimated Sales Growth: 9.48% vs. 11.29%
- Estimated Earnings Growth: 14.07% vs. 15.84%
- Gross Dividend Yield: 3.36% vs. 2.10%
- Forward Price-Earnings Ratio: 15.82x vs. 15.28x
- Seeking Alpha Profit Score: 5.46/10 vs. 6.36/10
- Seeking Alpha EPS Revision Score: 5.39/10 vs. 5.84/10
Except for volatility (beta) and dividend yield, VBR was attractive on all these key metrics, which isn't often the case. As such, it's no surprise it underperformed. An 18% allocation to Regional Banks didn't help, but its 4.58/10 Profit Score at the time was a red flag. With these metrics in mind, let's see how the two ETFs compare fundamentally today.
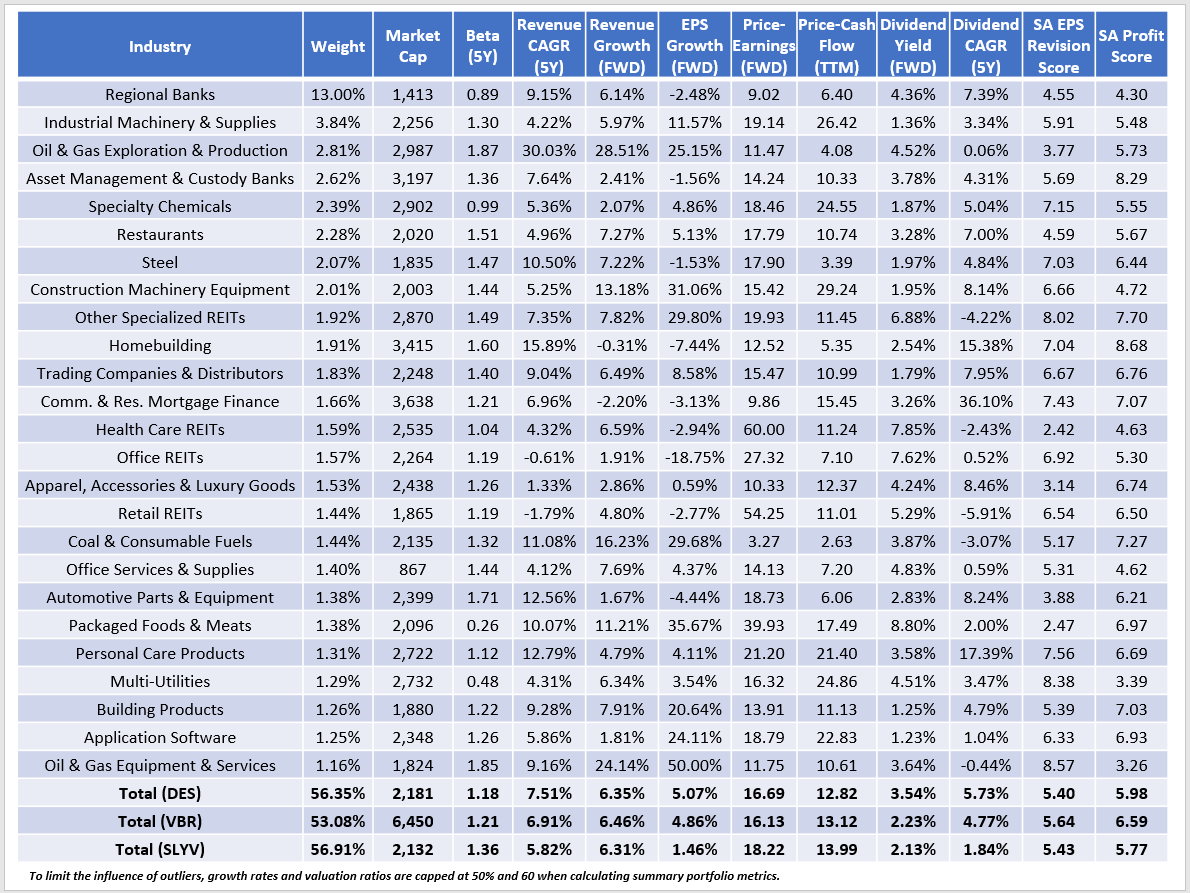
This snapshot reveals how exposure to Regional Banks decreased by 5% to a more manageable, though still significant, 13%. The industry's profit score dropped from 4.58/10 to 4.30/10 and is still a key reason why it lags VBR on this metric. For those unfamiliar with Vanguard's CRSP Indexes, there is some overlap with mid-caps; since it's market-cap-weighted, these stocks have more impact. Regional Banks remain VBR's top exposure area, but only total 8.17% of the portfolio.
In fairness, DES has made up ground on VBR on nearly every metric. For instance, its 5.98/10 Profit Score is 0.61 points behind compared to 0.90 points in November 2022. It also completely closed the gap on estimated sales and earnings growth vs. a 2% gap prior and is even trading at a slightly cheaper trailing cash flow valuation (12.82x vs. 13.12x). Finally, dividend investors will appreciate the higher 3.54% gross yield, which should net approximately 3.16% at current prices.
I'm still adamant that income investors should turn to the large-cap segment instead, as these stocks are generally more profitable and have better dividend growth track records. However, DES is a nice opportunity if you're looking to diversify by size and are unwilling to sacrifice yield. It's only of a handful of small-cap ETFs that yield above 3%, with three others being:
- Invesco S&P SmallCap High Dividend Low Volatility ETF ( XSHD )
- Nationwide Russell 2000 Risk-Managed Income ETF ( NTKI )
- VictoryShares US Small Cap High Div Volatility Wtd ETF ( CSB )
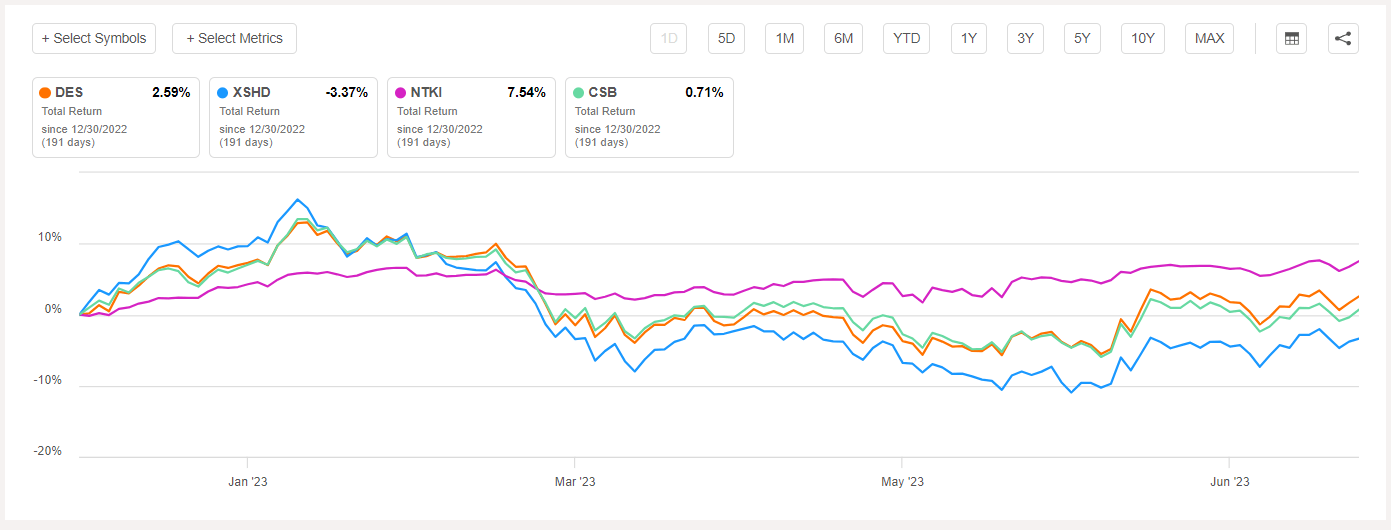
XSHD is 24.34% Mortgage REITs and 9.49% Office REITs, so that's how it achieves a 7.81% dividend yield (7.21% expected). It also has only 50 holdings, so you'll likely encounter concentration problems. NTKI employs an option-based strategy to generate additional income, so while it's not an apples-to-apples comparison, it offers an attractive 7.04% dividend yield worth considering. Finally, CSB has a 3.78% trailing dividend yield (3.92% expected) and, with 100 holdings, is better diversified than XSHD. However, its constituents offer minimal expected sales and earnings growth (4.77% and 2.68%), which has been a significant headwind lately. YTD, it's up only 0.71%. Meanwhile, NTKI has produced the best return at 7.54%.
Investment Recommendation
I prefer to focus on profitability in the small-cap segment, as highly-profitable stocks are safer and more likely to deliver better long-term returns and dividend growth. Unfortunately, DES still comes up a bit short on that metric. Still, I must acknowledge how its fundamentals relative to VBR and SLYV improved since my last review in November. Much of this is likely due to price weakness, so it is a potential buying opportunity for dividend investors looking to diversify by size without sacrificing much yield. I hope you found this analysis helpful, and as always, I look forward to continuing the discussion in the comments section below.
For further details see:
DES: With Price Weakness, Is This 3% Yielding Small-Cap Dividend ETF A Buy?