VTI - Determinants Of Economic Growth - Part I - Labor Supply
2023-05-10 14:57:56 ET
Summary
- The current jobless rate of 3.4% is below the natural rate, implying labor market tightness and according to the Phillips curve construct.
- For the Phillips curve to "work," changes in unemployment and the price level must be the result of shifts in aggregate demand while supply remains stable.
- The current low unemployment rate may be mostly the result of Covid and declines in net immigration, restricting labor supply.
- Current monetary policy may well be doing more harm to the economy than good.
- Part II in this series will discuss the importance of productivity to economic growth.
In our recent reports pertaining to the federal budget outlook published in January 10, 2023, January 23, 2023 , and February 23, 2023 , we detailed many consequences if existing policy is extended into the future. These were summed up in a Congressional Budget Office ((CBO)) ten-year forecast of weak 1.5% average annual economic growth. This would, in turn, ensure continued and rising budget deficits, and a federal debt to GDP ratio of nearly 120% by the end of the forecast period.
This begs the question of how this performance could be improved, to which this and a follow on report addresses. The economy's noninflationary trend economic growth rate is determined by the total of hours worked - primarily the size of the civilian labor force ((CLF)) - and the rate of productivity growth. This report focuses on the structure of the CLF, and a following report will address productivity.
The size of the labor force is determined by demographics and immigration. Under normal circumstances, these are readily forecastable, and until 2016 the size of the labor force extending over the course of a decade was largely predetermined. Since 2016 significant external variables caused major disruptions to this calculation.
Specifically beginning in 2016 the Trump administration instituted changes which limited immigration. In 2016, about 1.2 million net new immigrants entered this country legally, and the bulk of this total was integrated into the workforce. That represented a peak, though, and each year thereafter the number declined. In 2021 only 326K net new immigrants legally entered the country. Biden administration policies have been directed toward boosting immigration, and in 2022 slightly more than one million immigrants legally entered the country.
In numbers, they are a tiny fraction of a labor force numbering close to 170 million, but they are a measurable portion of annual changes in the labor force. Immigration policy has long been a hot button issue politically. There is a broad consensus that the system is broken, and that there is generally a mismatch between qualifications of new entrants and job skills that are in most demand. Businesses continually urge an expansion of Visa programs for the right kind of workers and not just the quantity of workers. A recent acceleration in illegal immigration and aging domestic demographics will hopefully make immigration reform an important priority going forward even though it is as yet seemingly a low priority for policymakers.
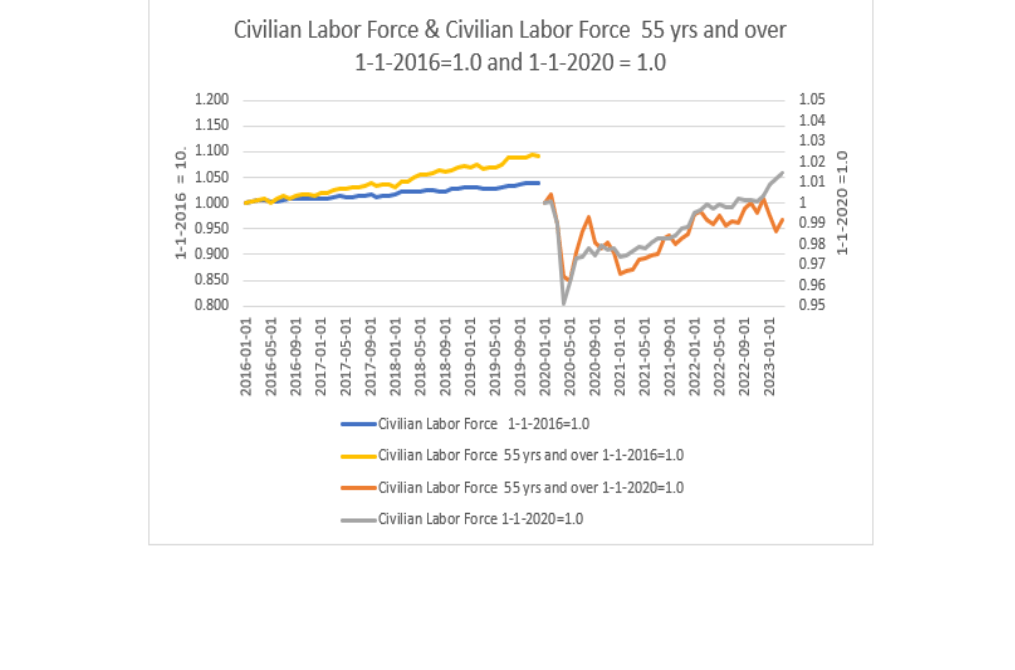
Back to labor force dynamics, though. The past several years of declining immigration clashed with the effects of the COVID-19 pandemic to affect the size and composition of the labor force. Chart I attached shows that the CLF exhibited a smooth growth pattern in the years before the pandemic but in 2020 huge distortions arose, which continue. The Center for Disease Control ((CDC)) reports that, to date, roughly 1.2 million Americans died from COVID-19 . These deaths were very age sensitive. For example, only 1600 people below the age of 18 died from the pandemic, whereas more than 300 thousand deaths occurred among those 85 and over.
Neither of these cohorts has any measurable impact on the labor force. The 75 - 84 age group is a more significant cohort, and in this group there are roughly 300 thousand deaths. Far more significant is the 60-74 age group in which there are about 450 thousand deaths while the 18-64 cohort accounts for about 265 thousand deaths. Thus, more than half of COVID deaths directly affected the labor force, and this represents a permanent loss.
From its peak in December 2019 to its nadir in April 2020, the CLF fell by 8.4 million workers. In January 2020, the CBO projected that the CLF would be 166.36 million in 2022, which would have been an increase of 2.86 million over the 2019 level of 163.5 million. The actual increase of the CLF from 2019 to 2022 was only 0.76 million to 164.29 million. (The 2019 CLF was slightly revised to 163.53 million). Deaths are measurable and a good portion of the difference between 2.86 million and 757 thousand represents other factors. These could reflect stay at homes for fear of contracting the virus or a loss of childcare or simply lifestyle changes that include early retirements etc. As the pandemic subsided and vaccination spread, causing life to return to a semblance of normalcy, the CLF has recovered . Indeed, as of August 2022, it was above the pre-pandemic peak.
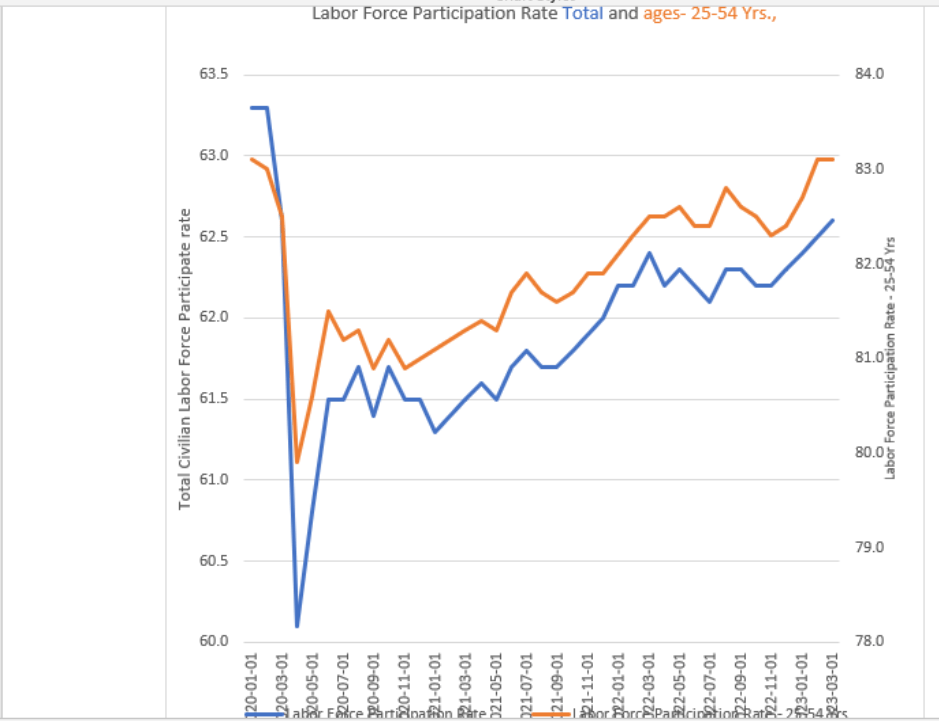
But the size of the CLF is not the only factor affecting the labor market. Labor force participation is also a major factor. As shown on Chart II attached, labor force participation plunged in 2020. It has been slow to recover, although for the key demographic of 25-54 year old's participation finally returned to its pre-pandemic peak of 83.1% this year. Ideally, this recovery is permanent and would even continue to increase toward the absolute past twenty five year peak of 84.6% reached in January 1999.
Nevertheless, the recovery is not yet complete for the entire CLF because as Chart II also shows, the participation rate for those 55 years and over has yet to show any recovery. From 40.3% in early 2020 it is currently around 38.5% and even lower than one year ago. In raw numbers this approximates 500 thousand workers. One factor we have identified as holding back participation is the ease with which disability assistance can be gotten. The 55 and over age demographic is the most vulnerable to "long COVID" according to the CDC. And the Biden administration has eased requirements for obtaining disability for those afflicted with long COVID.
This is unfortunate because starting in 2016 a bankrupted Disability Insurance program was rescued with taxpayer funds in exchange for significant reforms to the system. What had been a rising trend of disability numbers and payments began to be reversed. Coincidentally or not the participation rate for the 55 plus cohort rose from 39.8% in 2015 to 40.2% in the first quarter of 2020. For those ages 25-54, who were most impacted by the surge in dubious and fraudulent disability cases, the participation rose from 80.8% to 83.1%.
Monthly disability application data fluctuates wildly. But on a twelve month moving average in March 2023, disability applications were the highest for any month since before the pandemic. Data is not available, but our guess is that part of this surge reflects claims for long COVID.
The pandemic and reduced immigration contributed significantly to an essentially stagnant population in 2021 . It was the weakest yearly change since America's founding, including in 1918 when the aftermath of WW I and the influenza pandemic ravaged the population of young healthy individuals. A surge of inflation occurred in the 1919-20 period just as inflation surged in 2022-23. These population and labor force dynamics were an important factor in both instances, adversely affecting supply chains and causing shortages in selected industries.
The Federal Reserve was created in 1913 and its primary function was to combat panics rather than to affect inflation and economic growth. The charter was amended in the post WW II period to emphasize economic and price stability. A central feature of the Federal Reserve's current forecasting models is the presumed linkage between labor conditions, wages, and overall inflation. This is the so-called Phillips curve, named after the New Zealand-born British economist A.W. Philipps who, on the basis of questionable data from the U.K., demonstrated that rising unemployment is associated with falling inflation and vice versa. For the Phillips curve construct to be valid, changes in unemployment and the price level must be the result of shifts in aggregate demand while supply remains stable.
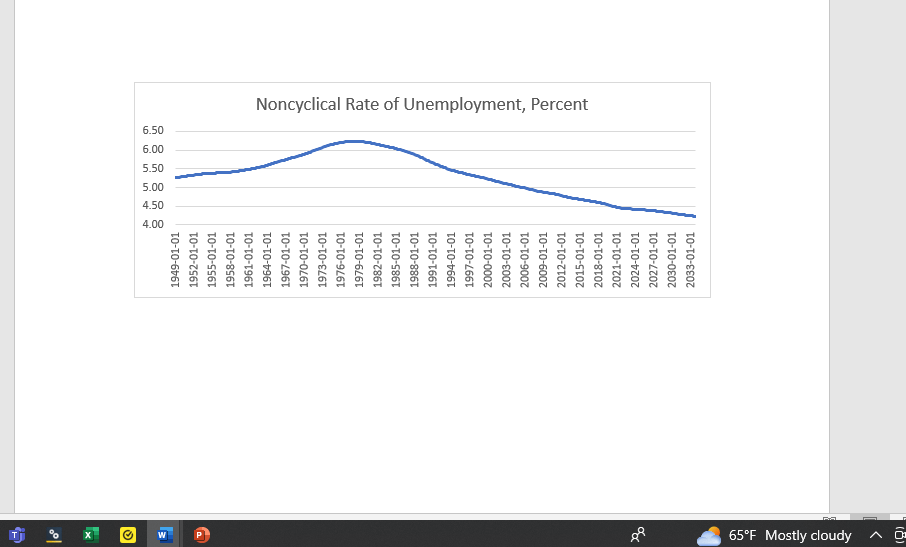
Unemployment has three components namely: frictional, structural, and cyclical. The first two can be affected by policies such as work incentives, tax policy, and shocks like COVID. Cyclical unemployment is caused by fluctuations in aggregate demand. Monetary and fiscal policies are designed to stimulate or depress economic activity. The natural rate of unemployment is the rate arising from all sources except fluctuations in aggregate demand. According to CBO the natural rate was 6.24% in 1979 . A shown on Chart III it declined gradually since that time, and it currently is presumed to be 4.24%.
The current jobless rate of 3.4% is below the natural rate, implying labor market tightness and according to the Phillips curve construct, causing wages to accelerate and inflation to rise. However, upon examining recent labor force characteristics, the current low level of the jobless rate may well be as much or more structural than cyclical. If so, current monetary policy may well be doing more harm to the economy than good.
To be sure, the Federal Reserve does not exert control over social and regulatory policy. But it does have a bully pulpit and by emphasizing that structural problems affecting the labor market may not be sensitive to monetary policy, it could shift the debate toward the social and regulatory policies that would address structural dislocations. To date the federal Reserve has shied away from this course of action, relying on interest rate policy alone to address existing imbalances which may not be sensitive to monetary policy.
Over the 2010-19 period the CLF rose by 0.61% yearly on average. In the 2023-2033 period CBO projects labor force growth of only 0.42% yearly on average. Putting aside the contribution from productivity, returning CLF growth to the 2010-19 norm would add 0.19% to the CBO projected GDP growth rate. It would shrink the gap between the current jobless rate and the so-called natural rate, easing pressure from countercyclical monetary policy. If in tandem with stepped up productivity growth which itself would benefit from a less onerous regulatory environment, the fiscal picture of the U.S. could be measurably improved.
Chart I
Civilian Labor Force & Civilian Labor Force 55 yrs and over 1-1-2016=1.0 and 1-1-2020 = 1.0 (FRED)
Created by Author with data from FRED.
Chart II
Labor Force Participation Rate Total and ages- 25-54 Yrs (FRED)
Created by Author with data from FRED.
Chart III
Noncyclical Rate of Unemployment (FRED)
Created by Author with data from FRED.
Noncyclical Rate of Unemployment (NROU) | FRED | St. Louis Fed (stlouisfed.org)
Please note that this article was written by Dr. Vincent J. Malanga and Dr. Lance Brofman with sponsorship by BEACH INVESTMENT COUNSEL, INC. and is used with the permission of both
For further details see:
Determinants Of Economic Growth - Part I - Labor Supply