DFAC - DFAC Vs. IWV: Two R3000 Index Strategies Compared
2023-09-04 09:00:00 ET
Summary
- iShares Russell 3000 ETF and Dimensional U.S. Core Equity 2 ETF are two ETFs centered around the Russell 3000 Index.
- iShares Russell 3000 ETF takes a passive strategy, while Dimensional U.S. Core Equity 2 ETF follows an active strategy.
- Both ETFs are reviewed and then compared. That shows both ETFs, despite the strategy differences have similar allocations and performance results.
Introduction
This article looks at two ETFs that center their strategy around the Russell 3000 Index. The iShares Russell 3000 ETF ( IWV ) takes a passive strategy of owning all the stocks in the index and weights accordingly. The Dimensional U.S. Core Equity 2 ETF ( DFAC ) benchmarks against the R3000 but is not bound by its allocations; an active strategy with the goal of adding Alpha for R3000 Index investors.
The next chart illustrates the pros and cons of the two approaches.
napkinfinance.com
iShares Russell 3000 ETF review
Seeking Alpha describes this ETF as:
The iShares Russell 3000 ETF invests in stocks of companies operating across diversified sectors. It invests in growth and value stocks of companies across diversified market capitalization. The fund seeks to track the performance of the Russell 3000 Index , by using representative sampling technique. iShares Trust - iShares Russell 3000 ETF was formed on May 22, 2000.
IWV has $11.4b in AUM and comes with 20bps in fees and a TTM Yield of 1.4%.
Index review
FTSE Russell describes their index as:
The Russell 3000® Index measures the performance of the largest 3,000 US companies representing approximately 96% of the investable US equity market, as of the most recent reconstitution. The Russell 3000 Index is constructed to provide a comprehensive, unbiased and stable barometer of the broad market and is completely reconstituted annually to ensure new and growing equities are included.
Objective construction methodology: Provides an unbiased, complete view of the US equity market and underlying market segments
Modular market segmentation: Distinct building blocks to provide insight into the current state of the market and inform asset allocation decisions
Reliable maintenance and governance: Disciplined, reliable maintenance process backed by a well-defined, balanced governance system ensures the indexes continue to accurately reflect the market
Source: research.ftserussell.com R3000
The R3000 has an average market cap of $594b, and a median market cap $2.1b.
IWV holdings review
ishares.com; compiled by Author
The influence of holding mostly Large-Cap stocks shows in the sector allocation as the Top 4 sectors are in the same order as a S&P 500 Index ETF shows. These also represent 60% of the total portfolio weight. Top holdings are:
ishares.com; compiled by Author
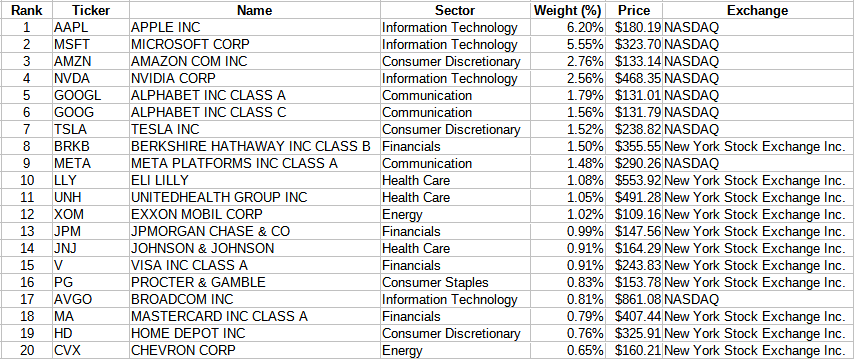
Here, the Top 9 stocks are in the same order as a S&P 500 index ETF holds, with the Top 20 equaling 35% of the portfolio. Of the 2700 stocks held, over 1300 have a weight under .01%, with the bottom half of the portfolio equating to only 1.66%, meaning they will have little effect on the outcome. Ninety percent of the portfolio weight is in just the 600 largest allocations!
IWV distributions review
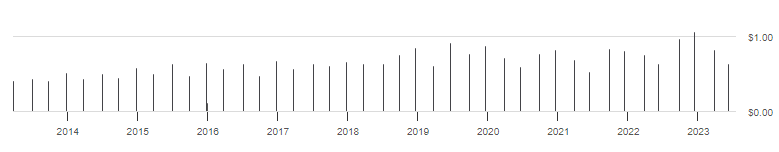
While the pattern is unclear, IWV has grown its payout over the last 3,5, and 10-year periods between 4-7%. This has earned IWV a B+ grade from Seeking Alpha. With its low yield, income is probably not a concern for its investors.
Dimensional U.S. Core Equity 2 ETF review
Seeking Alpha describes this ETF as:
The Dimensional U.S. Core Equity 2 ETF invests in stocks of companies operating across diversified sectors. The fund invests in growth and value stocks across diversified market capitalization. The fund seeks to benchmark the performance of its portfolio against the Russell 3000 Index. Dimensional ETF Trust - Dimensional U.S. Core Equity 2 ETF was formed on October 4, 2007.
DFAC has $21.4b in AUM and has slightly lower fees at 17bps, also with a slightly lower TTM yield of 1.35%. DFAC converted from a mutual fund to an ETF on 6/14/2021. This limits what data is available for use here from most sources.
DFAC holdings review
Pulled from the Prospectus, these selection/weighting insights can be gleaned. The Portfolio invests in companies of all sizes, with increased exposure to:
- smaller capitalization.
- lower relative price as measured against its book value.
- the Advisor may consider additional factors such as price to cash flow or price to earnings ratios.
- The Advisor may also increase or reduce exposure to an eligible company, or exclude a company, based on shorter-term considerations, such as a company’s price momentum and investment characteristics.
Sector data will be compared against IWV later.
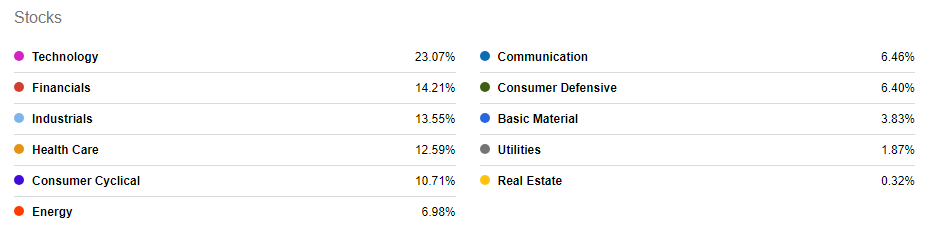
Active management has changed the order of the sectors. Top holdings are:
dimensions.com; compiled by Author
Here, the Top 20 comes to just 25% of the portfolio, less concentrated than IWV although both hold about the same number of stocks. Nineteen of the names appear in both lists. In DFAC, there are about 1000 stocks where the weight is under .01% and 90% of the portfolio weight requires 993 stocks to achieve. While 3X in allocation, the bottom half at 4% still matters little to the ETF's outcome.
DFAC distributions review
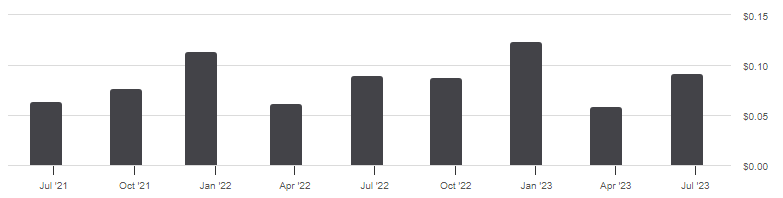
The DFAC site lists payouts for pre-conversion back to early 2020 which cluster around $.07 per quarter. This limited history effects the grading system, resulting in a "C" grade for this factor from Seeking Alpha.
Comparing ETFs
Since most of the comparing points I use are point-in-time, the lack of history back to 2007 for DFAC doesn't matter. I start with the size/style grid.
advisors.vanguard.com compare
Allowed freedom from the index weighting, we see DFAC's average market-cap is $50b opposed to IWV's at $140b. That shift also effects the LCG percent, 12% lower in DFAC compared to IWV. Higher percentages in both MC and SC offset some of that but DFAC still has 6% more in Value stocks than IWV. Based on DFAC selection/weighting rules, these slants would be expected.
Looking at each ETF's holdings, we see about 80% of the stocks held by one are in the other ETF. When viewing the stocks where IWV has higher allocations than DFAC, nine of the stocks are in the Top 10 of the R3000 index. That said, 8 of the Top 10 are the same in both ETFs. Allocation differences range from 1.9% for Nvidia ( NVDA ) to a -.2% for two stocks.
I chose to use a common source for sector comparisons, Morningstar being my "go to" site.
morningstar.com; compiled by Author
Within each wider sector classification, the differences are small. At the sector level, only four differ by more than 2%, with Industrials at 4.13% the widest spread. Again, turning to Morningstar, we get equity factors to compare. These heavily favor DFAC, with the "better" value shaded in green.
morningstar.com; compiled by Author
Vanguard had return data back 10 years, unlike other sites that only go back to DFAC's ETF starting date, and included S&P 500 Index results as a third set of data.
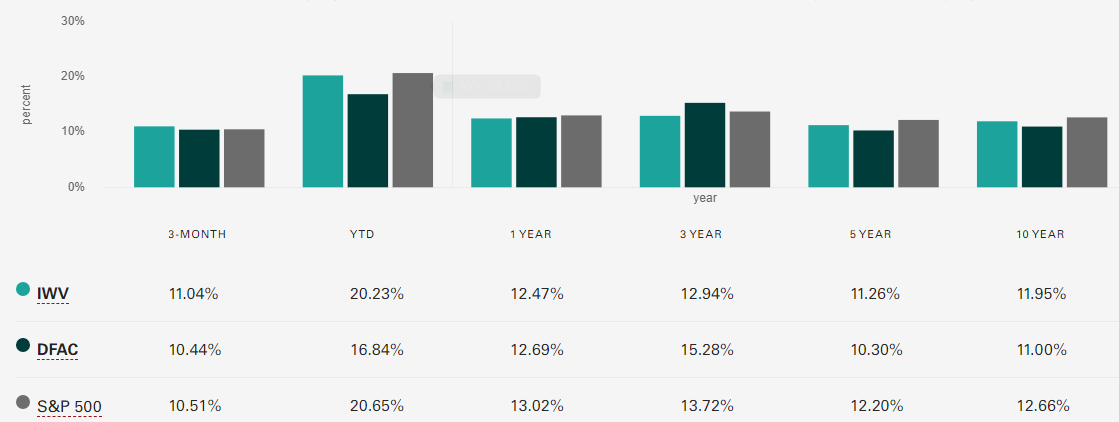
As one might expect, passive or active has not been the consistent better strategy, with IWV ahead in 2023 but behind until you go out to five years and beyond.
My conclusion
For investors wanting/needing more exposure to stocks below the Large-Cap universe, DFAC can provide that along with its potential to add Alpha. Other than that, it is a toss-up between these two. How they might fit into an investor's portfolio allocation, if at all, is reviewed under Final thoughts below.
Portfolio strategy
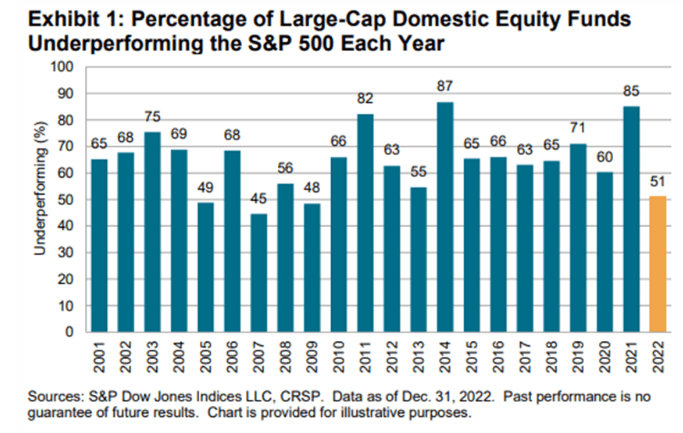
I will assume that there are other investors who design their equity portfolio as I do; owning a set of index ETFs as their Core holdings, and adding actively managed or factor-based ETFs on top to achieve some Alpha for themselves. As the next chart shows, picking "winners" among the active/factor funds has been difficult.
themathergroup.com/active-vs-index
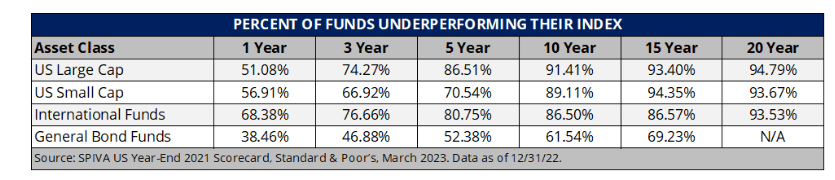
Last year was one of the best for active funds but it still was only 1% better than flipping a coin! The results are even worse when you look across longer time periods, meaning the same funds are not the winner in consecutive years too often.
themathergroup.com/active-vs-index
Notice that active bond funds perform best against their indexed peers. This could be a function that a higher percent of bond funds are actively managed and/or use leverage more than equity funds do.
Final thoughts
As for using the IWV ETF as a Total Market Core ETF, I would give it a pass and use the Vanguard Total Stock Market ETF ( VTI ). As for the DFAC ETF as an Alpha generating Total Market selection, it has achieved that since its conversion and with a lower Beta than IWV has. I am giving DFAC a Buy rating for investors looking for a Total Market ETF that is actively managed, mostly because it is the only such ETF I could find. There are MFs and CEFs that could be researched but I quick glance showed DFAC outperforming the few MFs I compared it too since its conversion.
For further details see:
DFAC Vs. IWV: Two R3000 Index Strategies Compared