AVUV - DFSV: Ahead Of The Small-Cap ETF Race
2023-07-26 08:00:00 ET
Summary
- Dimensional US Small Cap Value ETF is an actively managed fund holding over 1000 stocks.
- It is well-diversified across sectors and holdings.
- Valuation and performance relative to peers are attractive.
Strategy and portfolio
Dimensional US Small Cap Value ETF ( DFSV ) is an actively managed exchange-traded fund, or ETF, launched on 02/23/2022. It has a large portfolio of 1014 stocks, a distribution yield of 1.39%, and an expense ratio of 0.31%. Distributions are paid quarterly.
As described in the prospectus by Dimensional , the fund managers select stocks based on price to book, price to cash flow and price to earnings ratios. Profitability is also taken into account, with a preference for companies with high earnings or profits from operations in relation to book value or assets. “ The criteria the Advisor uses for assessing relative price and profitability are subject to change from time to time. ”
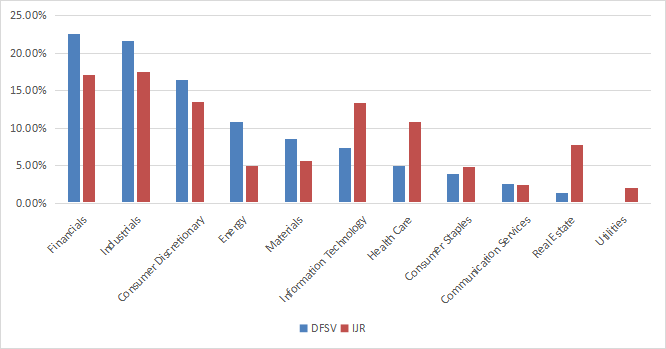
Such a description allows a lot of flexibility, and on the downside it also lacks transparency. The turnover rate in the most recent fiscal year was 4% of the portfolio’s average value, which is very low. The portfolio is almost exclusively invested in U.S. companies (over 98% of asset value). The heaviest sectors are financials (22.5%), industrials (21.6%) and consumer discretionary (16.4%). Other sectors are below 11%. Compared to the small-cap benchmark S&P 600, represented hereafter by iShares Core S&P Small-Cap ETF ( IJR ), the fund overweights the top 3 sectors listed above, along with energy and materials. It massively underweights technology, healthcare, real estate, and utilities.
DFSV sector breakdown (chart: author; data: Dimensional, iShares)
Aggregate valuation ratios are significantly cheaper than for the S&P 600 index, as reported in next table.
| DFSV |
| IJR |
| Price/Earnings TTM |
| 8.02 |
| 12.51 |
| Price/Book |
| 1.12 |
| 1.66 |
| Price/Sales |
| 0.61 |
| 0.89 |
| Price/Cash Flow |
| 5.68 |
| 8.6 |
Source: Fidelity.
The portfolio is well-diversified: the top 10 holdings, listed in the table below with valuation ratios, represent only 6.6% of asset value. The largest position is below 1%, so risks related to individual companies are very low.
| Ticker |
| Name |
| Weight% |
| P/E ttm |
| P/E fwd |
| P/Sales |
| P/Book |
| P/FCF |
| Yield |
| Taylor Morrison Home Corp. |
| 0.80% |
| 5.24 |
| 7.29 |
| 0.66 |
| 1.12 |
| 3.66 |
| 0 |
| Murphy Oil Corp. |
| 0.72% |
| 5.20 |
| 9.53 |
| 1.58 |
| 1.28 |
| 8.86 |
| 2.62 |
| Commercial Metals Co. |
| 0.71% |
| 6.88 |
| 7.23 |
| 0.73 |
| 1.64 |
| 9.09 |
| 1.15 |
| Transocean Ltd. |
| 0.69% |
| N/A |
| N/A |
| 2.37 |
| 0.61 |
| N/A |
| 0 |
| Thor Industries, Inc. |
| 0.65% |
| 10.62 |
| 17.95 |
| 0.49 |
| 1.53 |
| 11.69 |
| 1.63 |
| PBF Energy, Inc. |
| 0.64% |
| 1.77 |
| 5.13 |
| 0.13 |
| 1.19 |
| 1.48 |
| 1.76 |
| United States Steel Corp. |
| 0.64% |
| 3.67 |
| 6.00 |
| 0.31 |
| 0.62 |
| 8.43 |
| 0.81 |
| New York Community Bancorp, Inc. |
| 0.60% |
| 3.20 |
| 3.22 |
| 1.67 |
| 0.82 |
| 2.54 |
| 5.56 |
| PDC Energy, Inc. |
| 0.59% |
| 3.20 |
| 6.31 |
| 1.58 |
| 1.59 |
| 4.80 |
| 3.00 |
| PVH Corp. |
| 0.59% |
| 27.32 |
| 8.59 |
| 0.60 |
| 1.07 |
| N/A |
| 0.17 |
Ratios: Portfolio123.
Historical performance
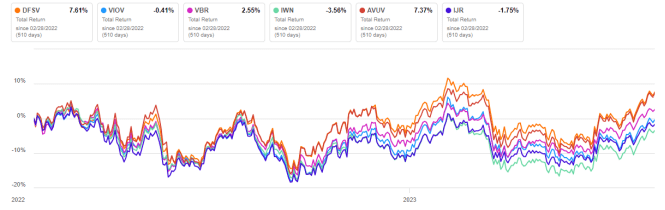
The next chart compares total returns since 2/28/2022 of DFSV, the small-cap benchmark IJR and four small cap value funds:
- Vanguard S&P SmallCap 600 Value ETF ( VIOV ). reviewed here ,
- Vanguard Small Cap Value ETF ( VBR ), reviewed here ,
- iShares Russell 2000 Value ETF ( IWN ), reviewed here ,
- Avantis U.S. Small Cap Value ETF ( AVUV ), reviewed here.
The two actively managed ETFs of the list, DFSV and AVUV, are leading the pack. DFSV is the best performer by a very short margin (in fact, the difference with AVUV is insignificant).
Why DFSV outperforms passively managed ETFs
Most value indexes have two shortcomings. The first one is to classify all stocks using the same criteria. It means valuation ratios are considered comparable across sectors. Obviously, they are not: my monthly dashboard here shows how valuation and quality metrics may vary across sectors.
The second weakness is relying too much on the price/book ratio (P/B), which is prone to attract value traps. Historical data show that a large group of companies with low P/B has a higher volatility and deeper drawdowns than a same-size group with low price/earnings, price/sales or price/free cash flow. The next table shows the return and risk metrics of the cheapest quarter of the S&P 500 (i.e., 125 stocks) measured in price/book, price/earnings, price/sales and price/free cash flow. The sets are reconstituted annually between 1/1/2000 and 1/1/2023 with elements in equal weight.
| Annual.Return |
| Drawdown |
| Sharpe ratio |
| Volatility |
| Cheapest quarter in P/B |
| 8.54% |
| -81.55% |
| 0.35 |
| 37.06% |
| Cheapest quarter in P/E |
| 10.71% |
| -73.62% |
| 0.48 |
| 25.01% |
| Cheapest quarter in P/S |
| 12.82% |
| -76.16% |
| 0.47 |
| 34.83% |
| Cheapest quarter in P/FCF |
| 15.32% |
| -74.77% |
| 0.61 |
| 27.03% |
Data calculated with Portfolio123.
DFSV strategy involves not only valuation, but also profitability, which helps filtering out a lot of value traps. Moreover, the fund managers may also assess stocks relative to their peers at sector or industry level. Although the strategy is a black box, I guess these two points explain why DFSV and AVUV outperform other small cap value ETFs.
Takeaway
Dimensional US Small Cap Value ETF is an actively managed fund with over 1000 stocks in its portfolio. It is well-diversified across sectors and holdings. Valuation is attractive, and total return since inception beats other small cap value ETFs. However, Avantis U.S. Small Cap Value ETF is a serious competitor. DFSV and AVUV seem to offset the shortcomings of passively managed value funds.
For further details see:
DFSV: Ahead Of The Small-Cap ETF Race