DGRW - DGRO: 2.64% Yield But Decelerating Dividend Growth Challenges Lie Ahead
2023-11-24 11:49:10 ET
Summary
- DGRO yields 2.64% and has a 9.66% five-year dividend growth rate, but my fundamental analysis reveals dividend growth challenges lie ahead.
- Compared to DGRW, SCHD, and VIG, DGRO has the lowest dividend safety score, free cash flow margins, and overall profit score. Estimated earnings growth is also insufficient.
- Since 2014, DGRO has ballooned from 249 to 428 holdings, and will likely increase its number of holdings again next month. This signifies its screens are less special than before.
- Dividend growth is a key deliverable, and despite its impressive track record, investors must look forward and avoid relying on DGRO's past performance, which has matched SCHD and VIG.
- Therefore, the most appropriate rating I can give is a "hold".
Investment Thesis
In May, I discussed how investors could optimize the iShares Core Dividend Growth ETF (DGRO) using a combination of three other low-cost dividend ETFs, but nevertheless, it was still a solid ETF. However, in the last six months, DGRO's fundamentals have deteriorated, and I want to express my doubt that DGRO will be able to achieve sufficient dividend growth moving forward. In this article, I will demonstrate how DGRO has relatively weak free cash flow margins compared to [[DGRW]], [[SCHD]], and [[VIG]], and the result is limited dividend growth and total return potential. Dividend safety scores and estimated earnings growth rates are also too low, so therefore, despite an impressive long-term track record, I've limited my rating on DGRO to a "hold," and I look forward to taking you through the numbers in greater detail below.
Dividend Growth: How It Happens
I want to discuss the root causes of dividend growth. This concept is often overlooked with ETFs, but knowing that an ETF itself doesn't decide to increase distributions is essential. Instead, that decision is made by all the underlying holdings, of which an ETF is merely a product. Concluding that DGRO will increase dividends by an annualized 10% over the next five years just because it did so over the previous five years is irrational, as it ignores holdings changes, market environment changes, and overall financial health changes. Instead, I ask you to think about dividend growth in two broad categories based on an analysis of current holdings:
- A company's willingness to grow dividends.
- A company's ability to grow dividends.
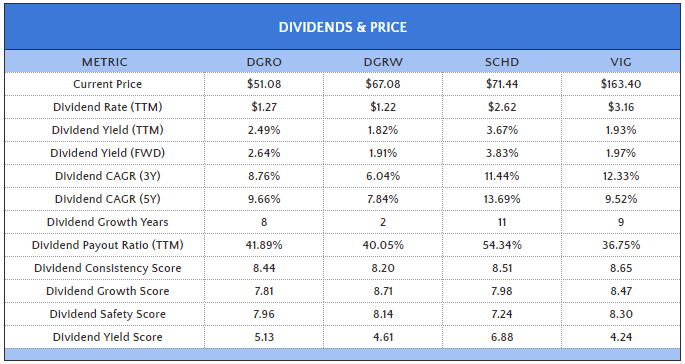
One way to measure a company's willingness to grow dividends is by looking at their track record. The Morningstar US Dividend Growth Index, which DGRO tracks, does this by only selecting companies with five years of consecutive dividend growth, and it appears to be a sufficient screen. To check, I calculated weighted-average dividend consistency scores using Seeking Alpha Factor Grades as inputs, and DGRO scored 8.44/10. For reference, SCHD and DGRW scored 8.51/10 and 8.20/10, while the Vanguard Dividend Appreciation ETF scored the best at 8.66/10. Therefore, I am confident that DGRO's constituents have demonstrated a strong willingness to grow dividends.
However, DGRO's ability to grow dividends is more questionable. While DGRO's selections must have a positive consensus twelve-month earnings forecast, there is no requirement for earnings growth, which logically is needed to support dividend growth. It's a potential flaw, but I understand the reasoning, as it would likely result in high portfolio turnover and increased transaction fees. Still, it's concerning that 28.58% of DGRO's holdings by weight have negative estimated earnings growth, including top ten holdings like JPMorgan Chase ( JPM ), AbbVie ( ABBV ), and Pfizer ( PFE ). The total figures for DGRW and VIG are 13.47% and 15.06%, while SCHD's is a whopping 38.99%.
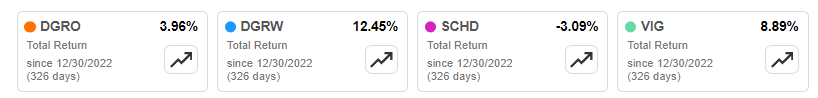
To show you how much the environment changed this year, the percentage of companies with negative one-year forward EPS growth was 4.52% and 8.88% for DGRO and SCHD on January 1, 2023. This downgrade in growth likely explains why they're lagging behind DGRW and VIG YTD.
In fairness, a company's dividend growth rate is not entirely dictated by its earnings growth rate. DGRO's generous maximum 75% forward dividend payout ratio allows most companies, as long as they are profitable, to remain in the Index. Currently, this describes only 4.26% of DGRO based on trailing twelve-month dividend payout ratios and 5.42% based on the four-year average payout ratio, so there should be few exits when the Index reconstitutes next month. This also explains how the Index has ballooned to 428 holdings compared to 269 when DGRO launched in 2014.
While a company's willingness to increase dividends can be measured by a dividend consistency score, a company's ability to increase dividends is better measured by a dividend safety score. Taking the same approach as before, DGRO scores just 7.95/10. As expected, VIG and DGRW score better at 8.31/10 and 8.12/10, while SCHD is the lowest at 7.24/10. These scores and other dividend statistics are summarized below.
I reiterate that it's unreasonable to expect DGRO and SCHD to keep up their 9.66% and 13.69% five-year dividend growth rates, nor should you want that to happen, as it just results in share price deterioration. In SCHD's case, we've already seen the impact, with its meager 3.10% increase in dividends from Q1-Q3 2023 over the prior year and -3.09% YTD total return.
The Importance of Free Cash Flow Margins
So far, I've covered dividend consistency and dividend safety scores, but there's one more metric where DGRO falls short: profitability and, specifically, free cash flow margins. This metric is included in the Profitability & Quality table below, and DGRO's 12.58% figure is the lowest of the four.
The Sunday Investor
To demonstrate the importance of high free cash flow margins, I've calculated the average five-year dividend growth rates and five-year total returns of all stocks (excluding Financials and REITs) across these four ETFs and separated them into quintiles, as follows:
- Quartile 1: -10.93% FCFM, 9.54% 5Y Dividend CAGR, 66.92% TR
- Quartile 2: 3.82% FCFM, 9.77% 5Y Dividend CAGR, 69.11% TR
- Quartile 3: 7.61% FCFM, 10.23% 5Y Dividend CAGR, 98.81% TR
- Quartile 4: 11.56% FCFM, 10.43% 5Y Dividend CAGR, 85.17% TR
- Quartile 5: 24.04% FCFM, 10.71% 5Y Dividend CAGR, 125.73% TR
Investing is about compromise, as no security will perfectly meet your requirements. While investing in the high free-cash-flow margin stocks seems like the best approach, the average yield in the top two quartiles is just 1.94% and 2.11%, respectively. Instead, another approach is to avoid the bottom two quartiles as much as possible. Setting a 5% free cash flow minimum looks right, and by that measure, here are the percentage of companies by weight in each ETF that meet that requirement:
- DGRO: 77.36%
- DGRW: 85.60%
- SCHD: 81.76%
- VIG: 82.49%
These figures lead us to a similar conclusion, which is that DGRO's free cash flow margins are lacking. It could be that DGRO has become too bloated, and the problem could worsen at next month's reconstitution.
Other Fundamentals
Of course, DGRO has some benefits. Here is a high-level overview of various metrics covering diversification, volatility, growth, valuation, dividends, profitability, and performance in the last earnings season.
Here are a few additional observations:
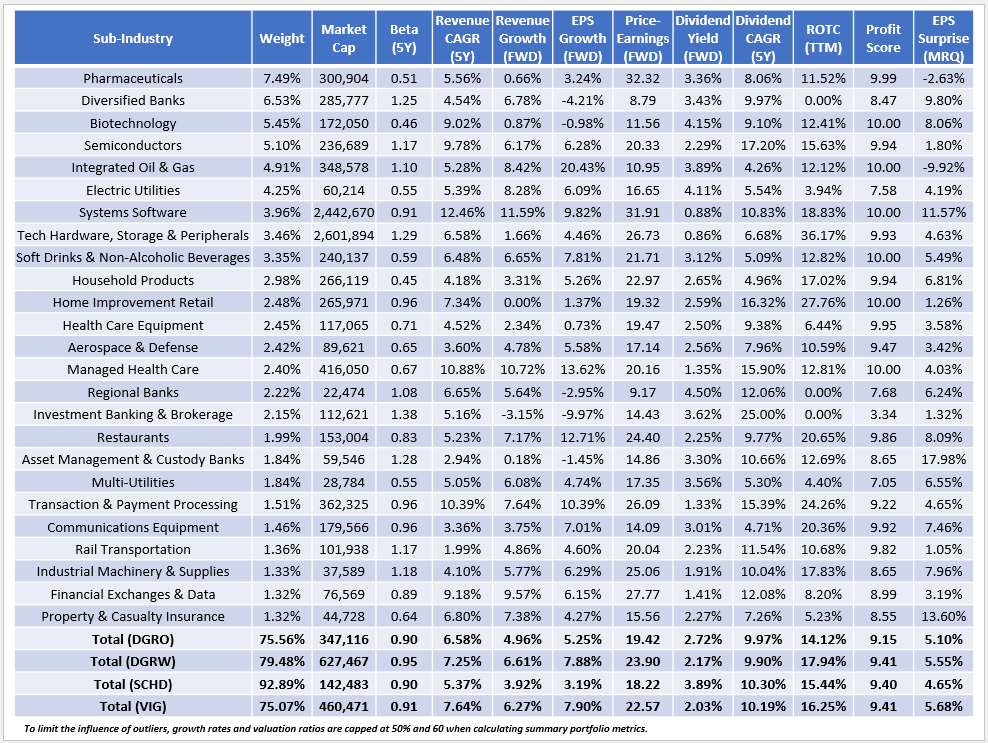
1. DGRO and VIG are well-diversified, with approximately 75% of assets in their top 25 sub-industries. Pharmaceuticals like Johnson & Johnson (JNJ) and Pfizer are prominent, as are Diversified Banks like JPMorgan Chase and Bank of America (BAC). Along with Biotechnology, these sub-industries yield above 3%, with most tech-related sub-industries acting as offsets.
2. DGRO, SCHD, and VIG have similar five-year betas, while DGRW is the most "market-like" at 0.95. It also has the highest weighted average market cap ($628 billion), reflecting how it overweights mega-caps like Microsoft (MSFT) and Apple (AAPL).
3. DGRO and SCHD have the lowest estimated sales and earnings per share growth rates, indicating they're closer to the value end of the spectrum. Generally, investors should brace for slower dividend growth, but at least they're buying at cheaper valuations. DGRO trades at 19.42x forward earnings vs. 23.90x and 22.57x for DGRW and VIG, while SCHD is the cheapest at 18.22x.
4. All four ETFs delivered about 5% earnings surprise last quarter, which is slightly below average. For context, that figure is 8.31% and 11.34% for the SPDR S&P 500 ETF (SPY) and the Invesco QQQ ETF ( QQQ ), so for now, it appears growth stocks have earnings momentum.
Investment Recommendation
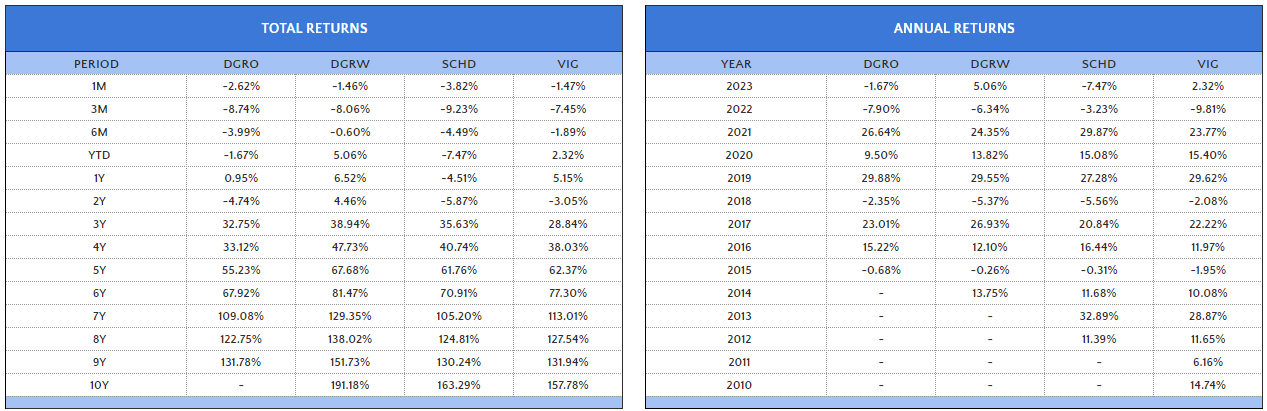
Based on low free cash flow margins, weak earnings per share growth estimates, and a below-average dividend safety score, I doubt DGRO can deliver solid dividend growth moving forward. However, it's far from a poor investment. Remember that DGRO's 9.15/10 profit score is still solid, even if it is lower than its peers, and that its estimated 2.64% dividend yield is better than what DGRW and VIG offer. Also, DGRO's track record is excellent, as it's achieved a 138.78% nine-year return through October 2023 and matched the returns of SCHD and VIG. Although I don't place as much emphasis on past performance as others, it lends credit to strategy and should be considered.
After balancing these results with my concerns about future dividend growth, the most appropriate rating I can give on DGRO is a "hold." I look forward to continuing the discussion in the comments section below and hope to answer your questions on other ETFs you're considering. Thank you for reading.
For further details see:
DGRO: 2.64% Yield, But Decelerating Dividend Growth Challenges Lie Ahead