VYM - DGRO: Optimizing This $23B Dividend Growth ETF With VIG VYM And SCHD
2023-05-25 16:31:40 ET
Summary
- DGRO is a low-cost dividend growth ETF that outpaced VIG, SCHD, and VYM since its June 2014 inception. Assets under management are approaching $23 billion.
- Despite a great track record, investors should focus on what DGRO holds today. It's solid, but holding the other three ETFs in certain allocations improves on nearly all key metrics.
- My suggested portfolio trades at 18.5x forward earnings, delivers a 2.78% dividend yield, and importantly, provides investors with the added diversification and flexibility they need to navigate an uncertain market.
- DGRO makes sense if your view on the markets is neutral and you don't already own the other three ETFs. However, I don't have a spot for it myself, so I've rated it a hold.
Investment Thesis
The dominant opinion on Seeking Alpha is that the iShares Core Dividend Growth ETF ( DGRO ) is effectively the same as Vanguard Dividend Appreciation ETF ( VIG ). Pick one, pair it with an income-focused fund like the Vanguard High Dividend Yield ETF ( VYM ) or the Schwab U.S. Dividend Equity ETF ( SCHD ), and you've created a low-cost and well-diversified portfolio yielding approximately 3%. Nevertheless, recent price action and my detailed factor analysis reveal DGRO is more of an "in-between" dividend ETF. It's suitable as a standalone ETF for investors unsure which style (growth or value) markets will favor next. However, combining the other three in the right proportions can improve your chances of success on nearly every metric that matters. In addition to providing a detailed overview of DGRO's strategy, composition, and historical performance, this article discusses fund overlap, the importance of diversification, and the fundamentals of my suggested three-ETF alternative to DGRO. I hope you enjoy the read.
DGRO Overview
Strategy Discussion
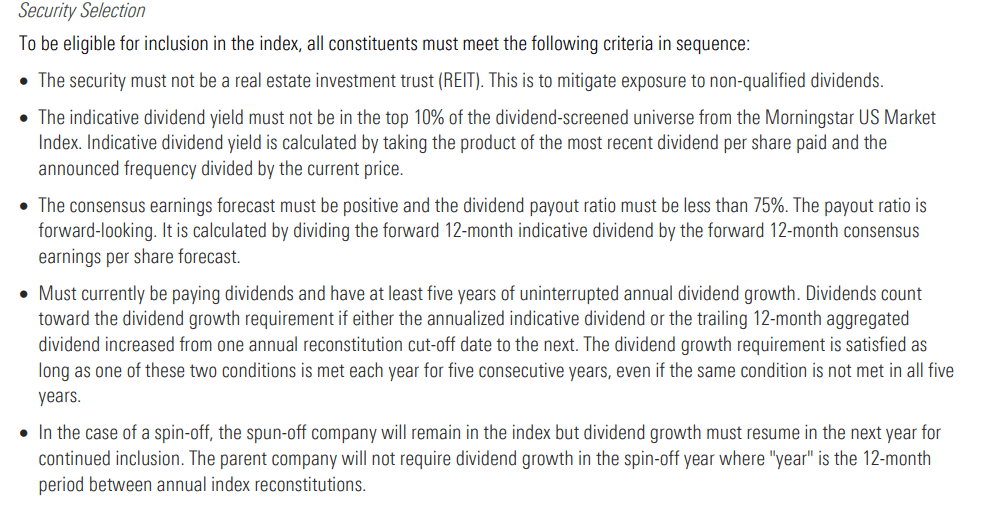
DGRO tracks the Morningstar US Dividend Growth Index, selecting companies with five consecutive years of dividend growth, payout ratios less than 75%, and a positive consensus earnings forecast. The Index excludes the top 10% of companies by dividend yield and weights by total dividend dollars paid. This approach is a cross between a yield- and market-cap-weighting scheme, as companies with high market capitalizations tend to make larger payments, even if their yields are low. Microsoft ( MSFT ) and Apple ( AAPL ) are perfect examples. They are DGRO's two most significant holdings but offer dividend yields of only 0.86% and 0.56%.
In addition, REITs are not eligible. These criteria are summarized below, sourced from the Index's rulebook, which you can download from this website .
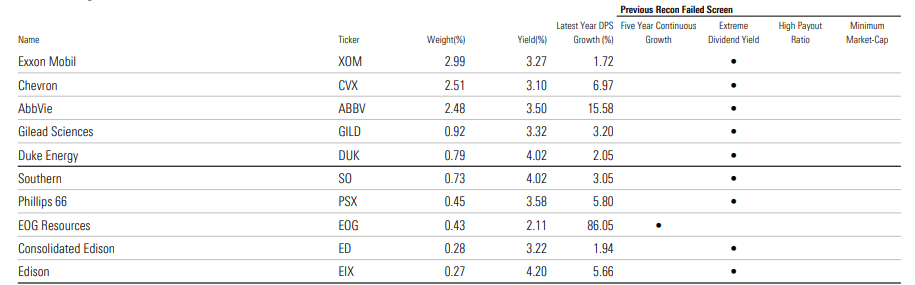
The Index reconstitutes annually in December. This year, the Index added 52 securities, and I've listed the top ten below, including Exxon Mobil ( XOM ), Chevron ( CVX ), and AbbVie ( ABBV ). Most additions were because they no longer failed the "Extreme Dividend Yield" screen discussed earlier. In effect, the starting universe is relatively fixed. Lately, reconstitutions are more or less an exercise in managing potential yield traps.
Sector Exposures and Top Ten Holdings
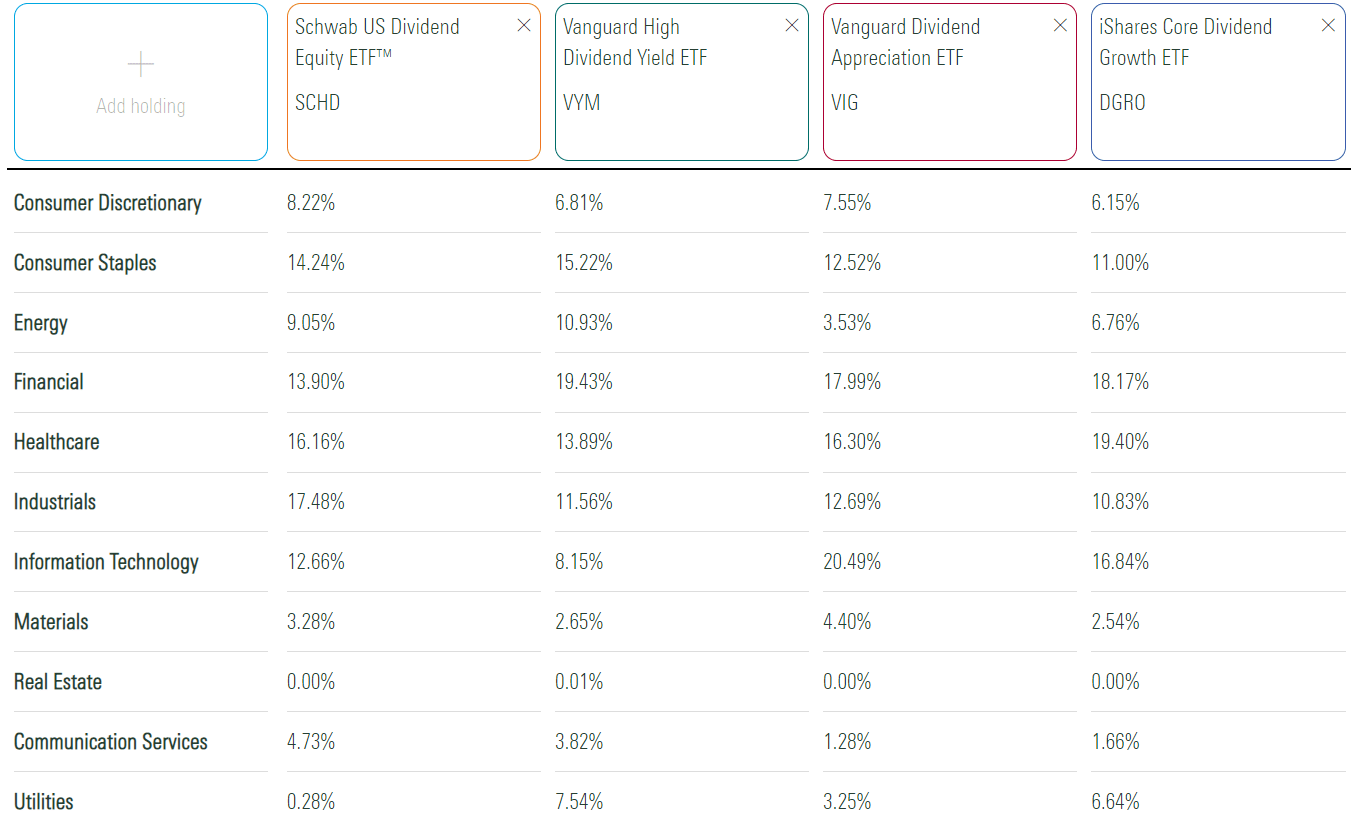
The following table highlights SCHD, VYM, VIG, and DGRO sector exposures. All avoid REITs, but VIG and DGRO stand out for relatively high exposure to Technology stocks. This exposure drives up their valuations and, ideally, their growth potential.
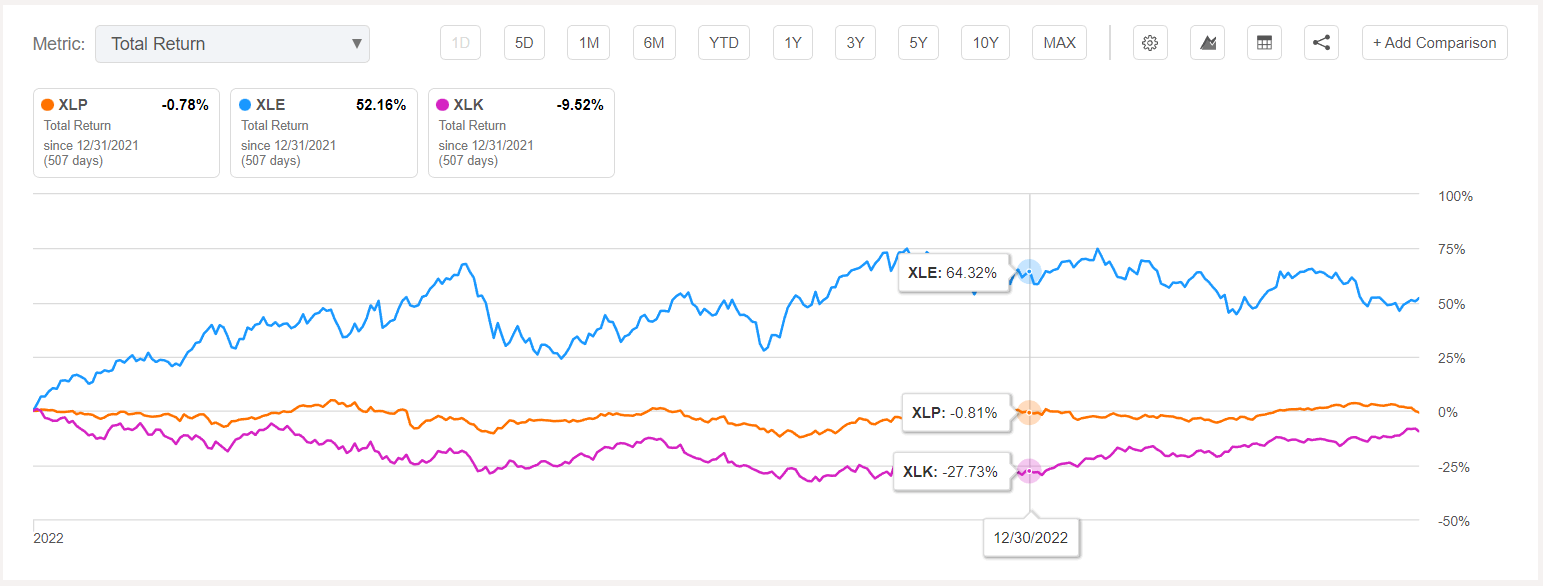
In contrast, SCHD and VYM have more exposure to Consumer Staples and Energy. It's why they outperformed last year and are a bit behind in 2023. For example, the Energy Select Sector SPDR Fund ( XLE ) gained 64.32% in 2022 but has declined 12% YTD for a 52.16% total return. Meanwhile, the Technology Select Sector SPDR Fund ( XLK ) fell 27.73% in 2022 but has made up about 18% YTD.
Microsoft and Apple are up over 30% YTD, so dividend-dollar-weighted and market-cap-weighted ETFs like DGRO and VIG have benefitted. These are DGRO's top two holdings, followed by Johnson & Johnson ( JNJ ) and JPMorgan Chase ( JPM ). These top ten holdings total 27% of the portfolio.
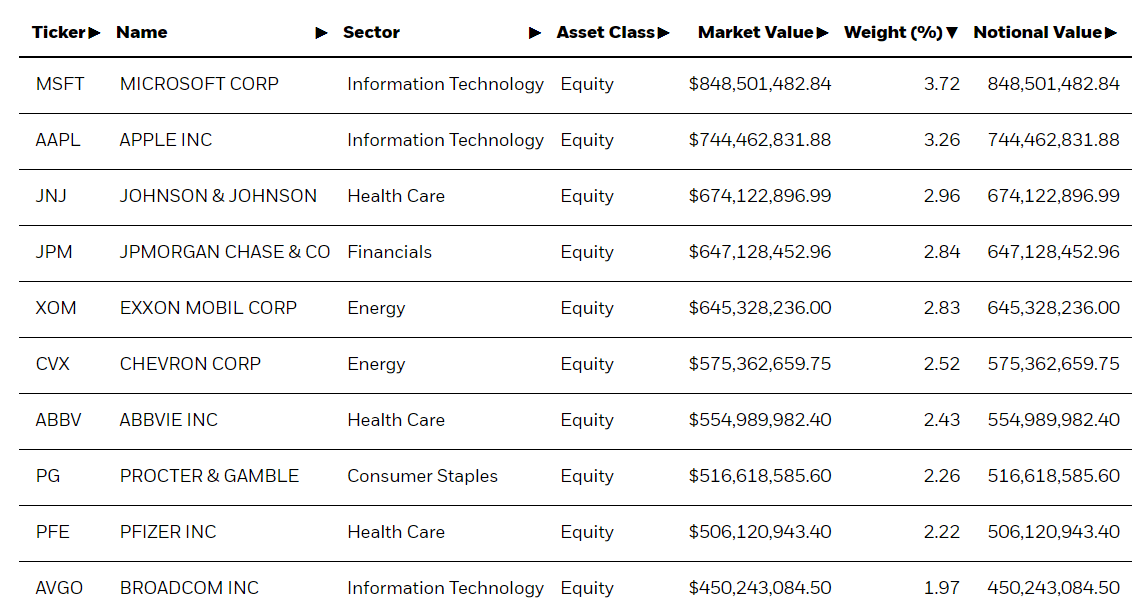
Performance Analysis
The following table compares the performance of the four ETFs since July 2014. Based on stock market correlations, DGRO and VIG are closest to the broader market, while VYM and SCHD are slightly less correlated. All offer similar risk-adjusted returns (Sharpe and Sortino Ratios) except for VYM.
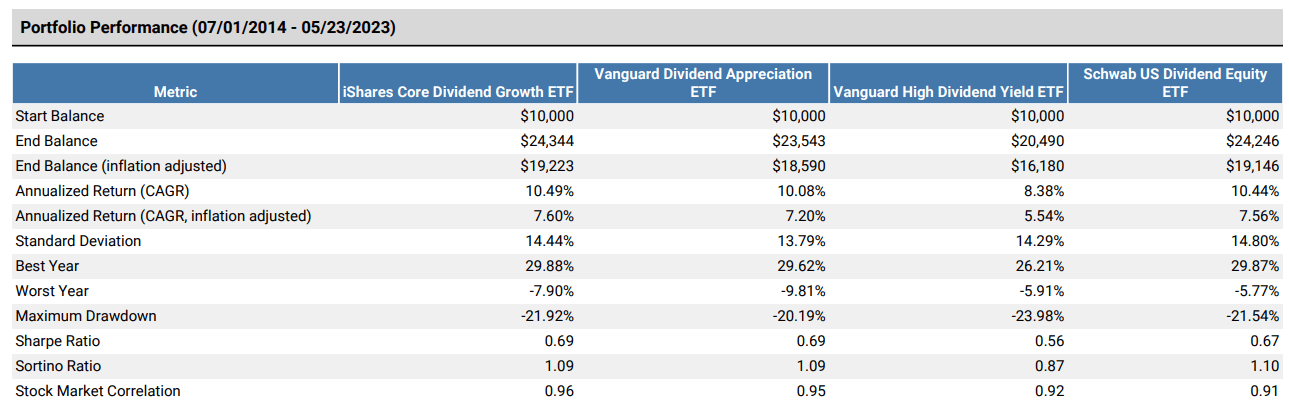
DGRO deserves credit for its 10.49% annualized return, slightly beating SCHD's 10.44%. However, that wasn't the case until this year. Instead, readers should consider rolling returns by matching the roll period with the expected holding period. For example, DGRO and VIG have similar average five-year rolling returns, which may be why some readers and analysts equate them. It just depends on your holding period, which differs for everyone.
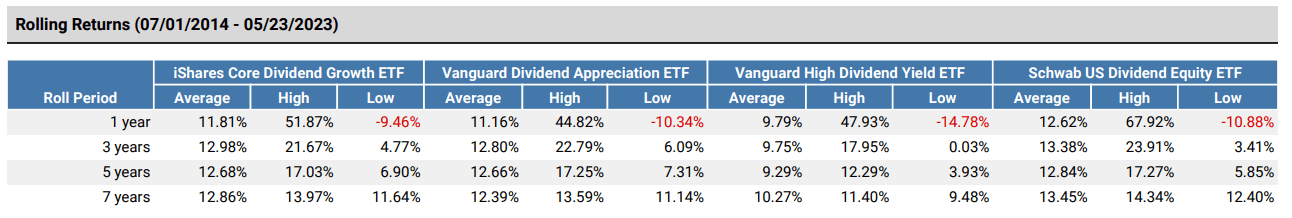
Still, there can be substantial differences in the short term based on each fund's high and low returns. Suppose you recognize that all four of these ETFs are solid and adopt a mindset that certain ones are better than others in different environments. In that case, you can use fundamental analysis to select the best buy. To illustrate, DGRO slightly improved after the December reconstitution , and it's held up pretty well this year, outperforming VYM and SCHD. However, VIG looked great after its March reconstitution, leading to a rating upgrade and subsequent outperformance.
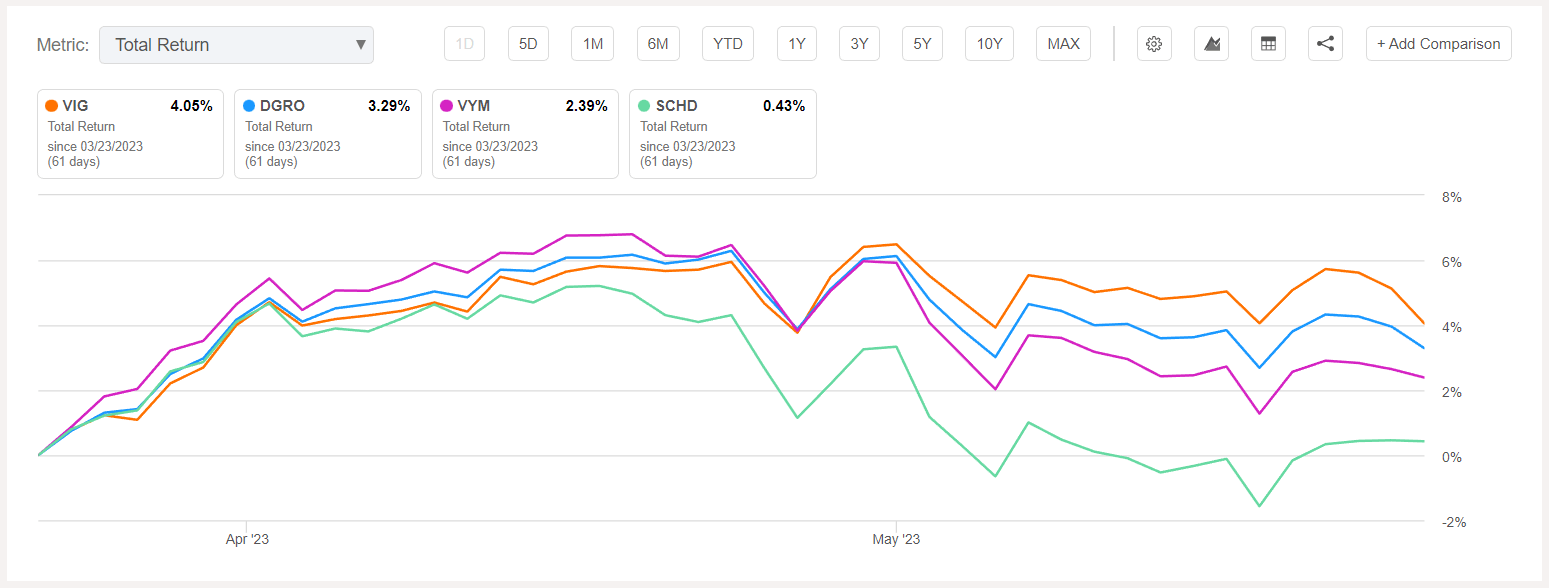
DGRO Analysis
Overlap With VIG, VYM, and SCHD
Fund overlap tools like the one at the ETF Research Center help manage diversification. Enter two ETFs to compare, and note the overlap by weight. DGRO's overlap with VIG, VYM, and SCHD is 69%, 67%, and 27%, respectively. Therefore, SCHD is the best complement to DGRO. I also made the same calculations at the industry level and reached the same conclusion. Here are the most significant differences between DGRO and VIG:
- AbbVie ( ABBV ): +2.45%
- Chevron ( CVX ): +2.45%
- Pfizer ( PFE ): +2.16%
- Visa ( V ): -1.83%
- Mastercard ( MA ): -1.79%
- UnitedHealth Group ( UNH ): -1.73%
- Bank of America ( BAC ): +1.30%
- Eli Lilly ( LLY ): +1.20%
- Costco ( COST ): -1.19%
- CME Group ( CME ): +1.10%
The overweighted stocks mostly have low valuations. AbbVie, Chevron, Pfizer, and Bank of America trade between 8-13x forward earnings. In contrast, Visa, Mastercard, and Costco are above 25x forward earnings. VYM and SCHD take it further, avoiding Microsoft and Apple. That's how you should think of these four ETFs. VIG is the most aggressive, VYM and SCHD are more value-oriented, and DGRO is in between. If no clear signs favor a growth or value style, DGRO makes a lot of sense as a standalone investment.
DGRO Industry Fundamentals
Occasionally, ETFs can present well on several factors like diversification, volatility, growth, valuation, profitability, and earnings momentum. What's great about these four ETFs is that they are all reasonably consistent in volatility, valuation, and profitability, so we don't have to worry too much about those factors. However, having a basic understanding of market sentiment is crucial for knowing which ETF to select next. For example, when earnings surprises sharply decreased in late 2021, I anticipated the value factor would be favorable and recommended readers buy VYM for its 12-point forward earnings discount to the S&P 500 Index. Earnings surprises continued their downward trend for one year, but in Q1 2023, they finally ticked up again, and VYM isn't doing as well as the more growth-oriented VIG.
Industry-level analysis for ETFs is helpful because I can usually summarize a large portion of the fund in a single table. DGRO, VIG, and VYM's top 25 industries total three-quarters of their portfolios, while SCHD's is closer to 90%. Here's how DGRO looks today:
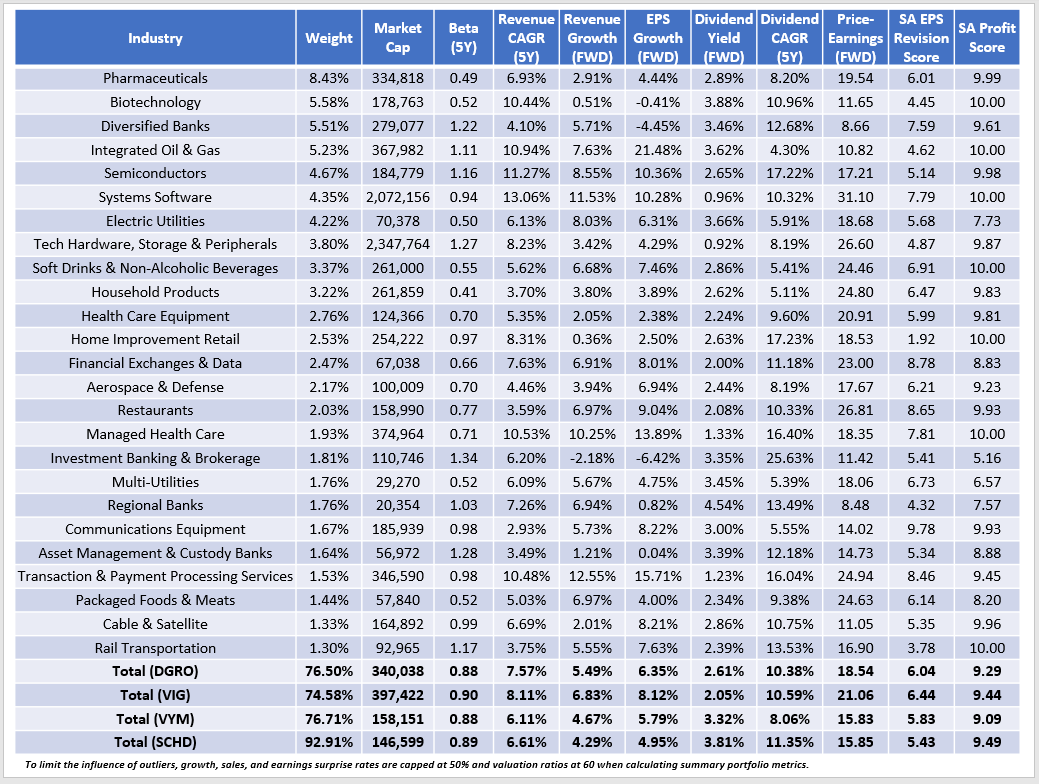
A few observations:
1. The four ETFs' valuation profiles match what I previously described. VYM and SCHD are the cheapest, trading at about 16x forward earnings. VIG is the most expensive at 21x, while DGRO is in the middle at 18.5x. You'll also notice the same pattern with dividend yields, which makes sense because yield is a function of a company's dividend payment and market value. Furthermore, since all four ETFs have low expense ratios, these are reasonable estimates of what shareholders will receive based on current prices.
2. The estimated sales and earnings growth rates follow the same pattern. VYM and SCHD have low 4-6% growth rates, while VIG's earnings growth rate is 8.12%. As expected, DGRO is in the middle at 5.49% and 6.35%.
3. DGRO, VIG, VYM, and SCHD all have similar five-year betas around 0.90, which is about average for a large-cap dividend ETF. I have followed these funds closely for years, and you can count on this level of stability. The same is true for each ETF's profitability score, which I derived by weighting individual Seeking Alpha Factor Grades and normalizing the results on a ten-point scale. I consider scores above 9/10 to be sufficient for large-cap ETFs.
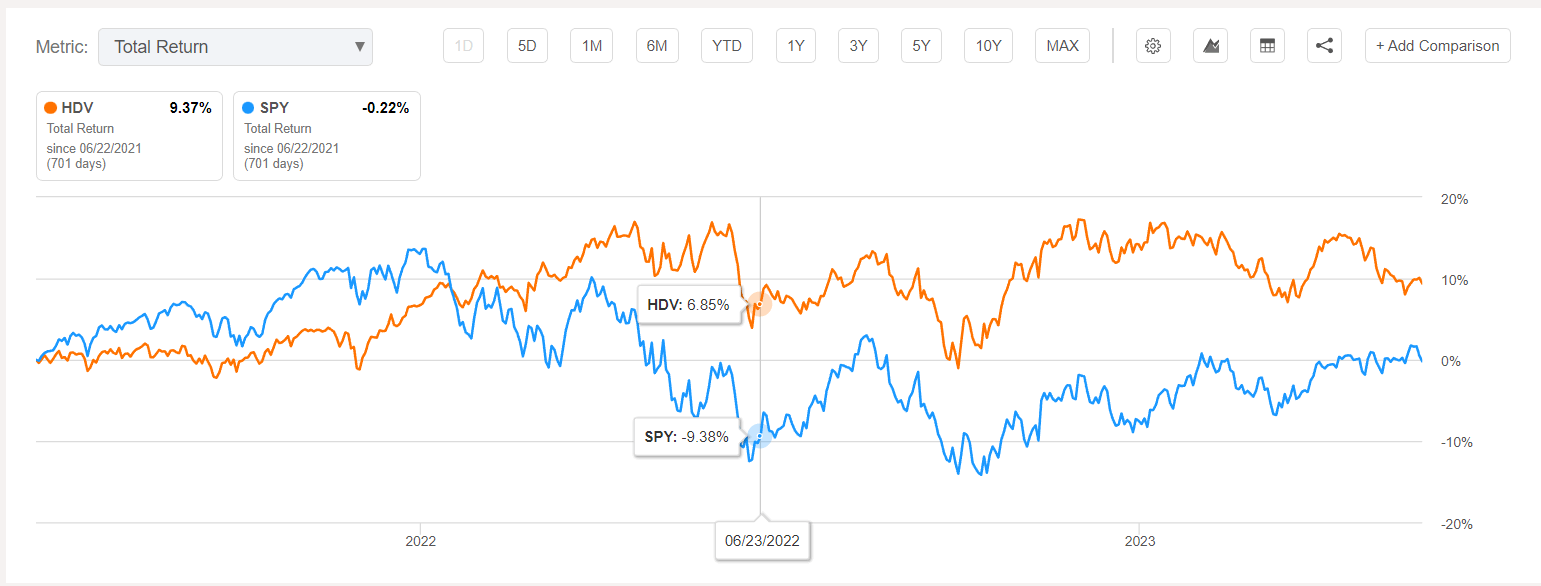
4. Some ETFs combine high growth rates with low valuations. However, there are always sacrifices. For example, the iShares Core High Dividend ETF ( HDV ) is too concentrated in the Energy sector, a composition I disagreed with in June 2022 after recommending it one year earlier . The call was accurate. HDV had a 16.25% edge over the SPDR S&P 500 ETF ( SPY ) between June 2021 and June 2022. However, that lead shrunk to about 9.50% if held through today.
ETFs with these problems require closer analysis and might not be well-suited for passive investors not interested in this type of analysis. The timing is always challenging, and although the call eventually proved correct, it looked different early on. It took a few months for markets to understand the threat of high inflation and rapidly declining earnings surprises. However, HDV's composition was prime for that uncertain period.
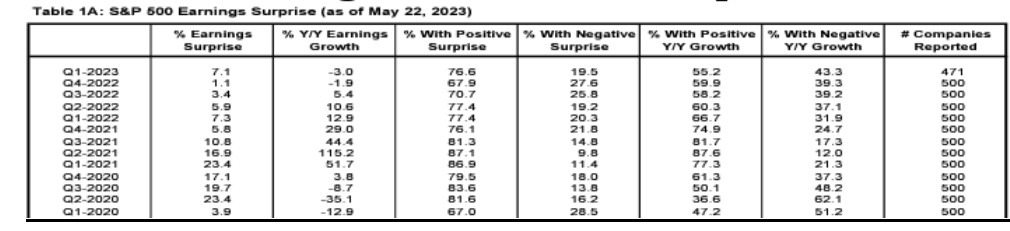
Evaluating Market Sentiment: Where Are We Today?
The table above shows how aggregate S&P 500 earnings surprises ticked up to 7.1% this quarter, a figure not seen in one year. It's encouraging news and why growth-oriented stocks are outperforming YTD. We're still far from the 10-20% figures between Q2 2020 and Q3 2021. However, based on this report from Yardeni Research, those were numbers never seen in at least 35 years. A 7.1% earnings surprise is still above average.
The market was euphoric after the Q1 2020 pandemic crash, and seemingly, the riskiest assets with the worst fundamentals performed the best. As I explained in my article titled: ARK Innovation ETF: The Plot Thins ", there's nothing magical about the strategy. Low-quality stocks have occasionally produced incredible gains dating back decades, but the gains always reverse, most commonly the following year. As an ETF analyst, it's my job to recognize why groups of stocks are performing the way they are and to act accordingly. Analysis based on historical returns is often only sufficient if you know why the market favored certain factors over others each year.
That said, knowing where market sentiment is today is essential. The first positive sign is the reversal of earnings surprises. To be sure, one quarter is not a trend, but two would be. Another positive earnings season, roughly beginning in July, could be the catalyst growth stocks require to reverse some of last year's losses. Second, readers can consider earnings revisions by Wall Street analysts, reflected in Seeking Alpha's EPS Revision Grades. DGRO ended the year with a 5.59/10 score. Today, it's 6.04/10. Again, this metric is below VIG's but better than VYM and SCHD. It's another data point that reflects how analysts currently favor growth stocks. Price changes are the output of these movements, not the input. That's how my approach differentiates from other analysts relying primarily on technical analysis to gauge market sentiment.
Optimizing DGRO Using VIG, VYM, and SCHD
Many factors suggest DGRO is an in-between ETF, so if you're looking to buy a dividend ETF but aren't sure which style the market favors, it's a safe choice. However, you can get better factor exposure and diversification if you are willing to hold VIG, VYM, and SCHD in different combinations. This approach also allows for greater flexibility, as you won't feel the need to drastically change your strategy by selling what are all likely suitable long-term holds.
Instead of DGRO, investors may wish to allocate 50% to VIG, 30% to VYM, and 20% to SCHD, to improve on all of DGRO's key factors and its industry-level diversification. Below are the results.
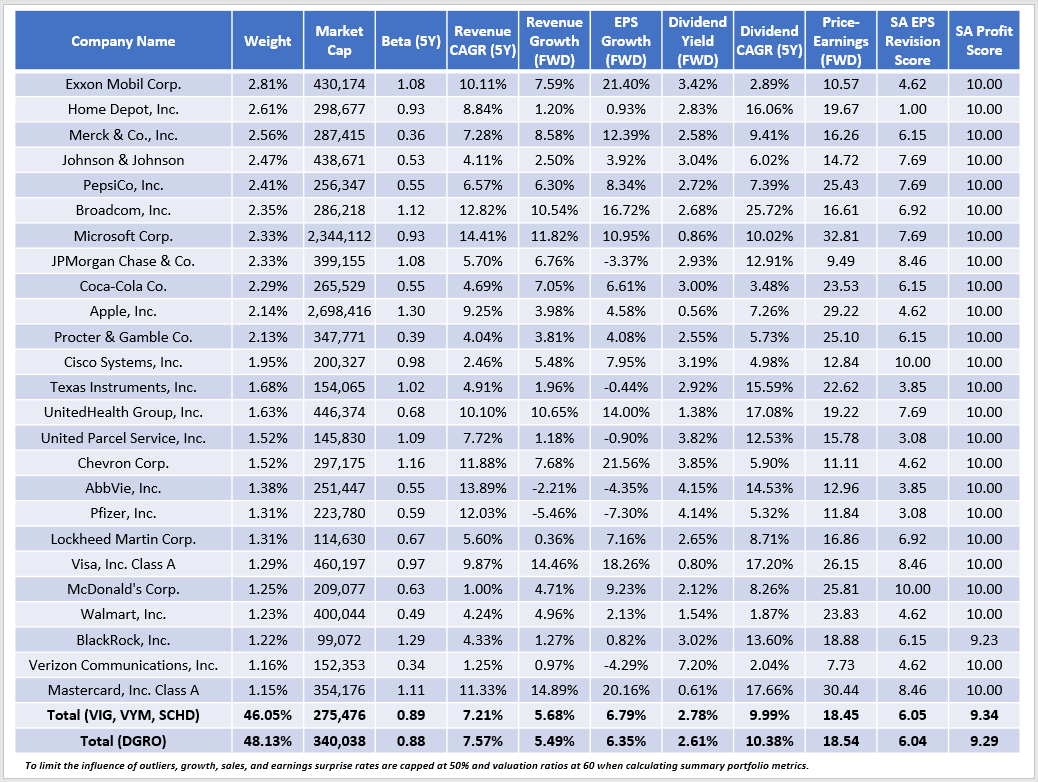
The top 25 holdings comprise 46% of the portfolio, slightly lower than DGRO's 48%. Importantly, all have less than 3% allocations, which isn't the case for any ETFs on their own. Volatility, valuation, earnings revisions, and profitability scores are roughly equal. However, this combined portfolio has the following:
- A higher expected sales growth rate: 5.68% vs. 5.49%
- A higher expected earnings growth rate: 6.79% vs. 6.35%
- A higher starting dividend yield: 2.78% vs. 2.61%
The suggested portfolio is more flexible and helps dividend investors spread out their risk while selecting stocks in a reasonably good position to increase future dividends. After all, that's DGRO's primary investment objective, so I'm hoping it will appeal to current shareholders looking to make some changes.
Investment Recommendation
After evaluating DGRO's factors, it's somewhere between the growth-oriented VIG and high-dividend ETFs like VYM and SCHD. A 50/30/20 combination improves on nearly every critical metric DGRO features, including sales growth, earnings growth, dividend yield, and diversification. Therefore, I'm confident DGRO isn't needed. Personally, I'm in no rush to add to high-dividend ETFs right now because of improving market sentiment. If you agree with me, VIG is the correct buy today. If you disagree or simply want to protect your capital, VYM and SCHD are more suitable. Regardless, the main takeaway is that you can use these ETFs as an alternative to DGRO and adjust the allocations according to your view of the markets and dividend income needs. I hope you found this analysis helpful, and as always, I look forward to continuing the discussion in the comments section below.
For further details see:
DGRO: Optimizing This $23B Dividend Growth ETF With VIG, VYM, And SCHD