LQD - DHF: Decent Junk Bond Fund At A Good Price But Distribution History Problematic
2023-09-20 12:49:38 ET
Summary
- BNY Mellon High Yield Strategies Fund offers a high yield of 8.18%, higher than many other investments in the market.
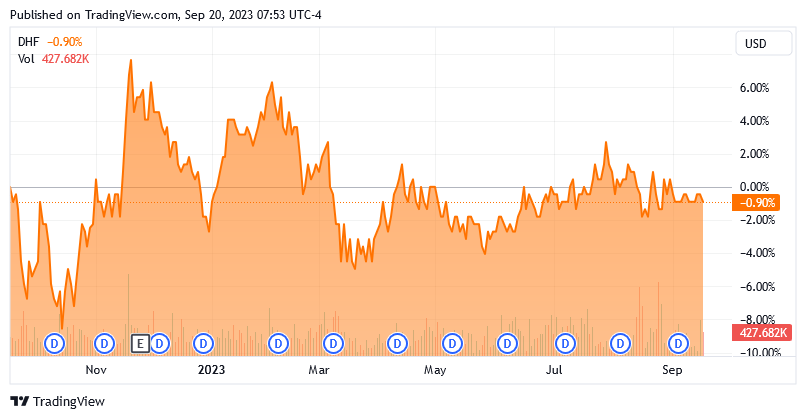
- The DHF closed-end fund's recent price performance has been decent, only down 0.90% over the past year.
- The fund primarily invests in junk bonds, which may concern risk-averse investors, but it has a diversified portfolio to minimize individual issuer risks.
- The default rate of junk bonds has been increasing along with their popularity, which could increase the risks of investing in them.
- The fund's valuation is very attractive, but its poor distribution history may be a turn-off to income-focused investors.
The BNY Mellon High Yield Strategies Fund ( DHF ) is a closed-end fund, or CEF, that income-seeking investors can use to achieve their goals. The fund’s current 8.18% yield is a testament to this, as that is a much higher yield than many other things in the market, and it is much higher than the S&P 500 Index (SP500) or the Bloomberg U.S. Aggregate Bond Index ( AGG ). The fund’s recent performance has not been too bad, either, as it is only down 0.90% over the past year:
The fund’s current yield more than makes up for this and overall investors who have held the fund for at least a year have made money from it. This alone should be something that attracts some investors, particularly given the significant number of closed-end funds that have delivered rather disappointing returns in the face of interest rate hikes over the past twelve months. The fact that the fund is trading at a price that is well below the intrinsic value of the shares only adds to its appeal.
A cursory look thus reveals the fund to be reasonably decent but let us have a closer look at it to determine if that is indeed the case.
About The Fund
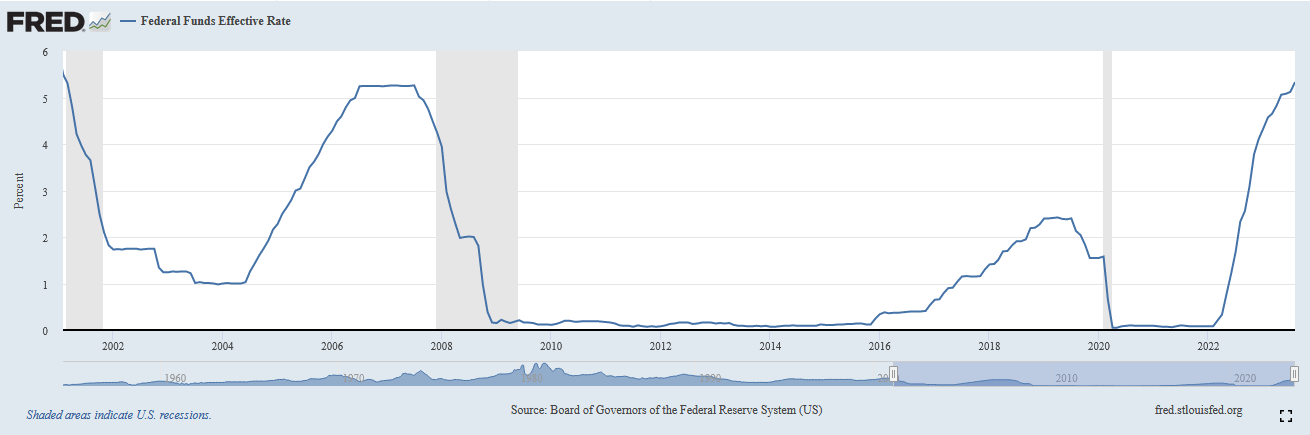
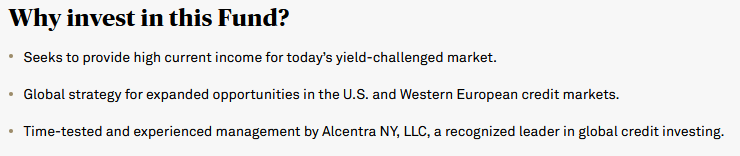
According to the fund’s website , the BNY Mellon High Yield Strategies Fund seeks to provide a high level of current income. This is a reasonable strategy, but the website also describes the current market as being “yield-challenged.” It may be true that the stock market is somewhat yield-challenged, as the current yield on the S&P 500 Index is only 1.47%, but it is emphatically not true that the bond market is yield-challenged. In fact, the effective federal funds rate is currently at the highest level that we have seen since February 2001:
The current federal funds rate is pretty similar to where it was at in most of the 1990s, which was one of the strongest economic environments that the United States has seen since the Great Depression. In fact, the only period of history in which interest rates were on average higher than today was the 1980s. When we consider that bonds and other fixed-income assets tend to trade in line with interest rates, it is pretty hard to argue that the fixed-income market is currently “yield-challenged.” Then again, the market was certainly yield-challenged two years ago when interest rates were basically at zero in the aftermath of the COVID-19 pandemic. It is quite possible that this part of the fund’s website has not been updated for a few years, but if that is the case then it certainly does not inspire a great deal of confidence in the rest of the data on the site. After all, it takes only a minute or so to update a website.
The fund’s strategy and objectives section on the webpage gives little insight into how exactly the fund will attempt to achieve its objectives:
It does mention that the manager has a great deal of experience with investing in credit securities from issuers around the world, which suggests that this is a fixed-income fund. Elsewhere on the site, it states that the fund’s portfolio has an average effective maturity of 4.79 years and a weighted average coupon of 6.79%, which also suggests that this is a fixed-income fund. More specifically, it would almost certainly have to be a junk bond fund since anything invested in investment-grade bonds is not going to have such a high weighted average coupon yield. Indeed, the five-year U.S. Treasury is only at 4.487% so investment-grade corporates are not going to be trading at 6.79%. In fact, the iShares iBoxx $ Investment Grade Corporate Bond ETF ( LQD ) has a weighted average maturity of 5.74% right now, so that gives us a pretty good idea of where investment-grade corporate bonds are at.
Fortunately, CEF Connect gives us a good idea of exactly what this fund is investing in. It states that 95.37% of the fund’s portfolio is invested in bonds with the remainder in cash and preferred stock:
CEF Connect
As the weighted average coupon yield implied, the portfolio does indeed primarily consist of junk bonds. We can see this by looking at the credit ratings that have been assigned to the securities in the fund’s portfolio:
CEF Connect
As I have pointed out numerous times in the past, an investment-grade security is anything rated BBB or higher. As we can easily see, this only accounts for 1.40% of the fund’s portfolio. The remainder of the fund's portfolio is invested in speculative-grade debt, which is colloquially known as “junk bonds.” That is something that may concern some readers, particularly those who are risk-averse and are concerned about the safety of their principal. This is quite understandable since we have all heard about the high risk of default that these securities possess. However, we can see that 74.94% of the fund’s portfolio is invested in securities that carry either a BB or a B rating.
According to the official bond ratings scale , a company whose securities carry one of these two ratings has sufficient financial strength to carry and satisfy its current debt obligations even in the event of a short-term economic shock. As such, we probably do not need to worry too much about losses due to defaults, although the risk is certainly not zero. In order to reduce this risk, the fund includes securities from 288 unique issuers in its portfolio. This ensures that the fund only has minimal exposure to the risks of any individual issuer. Indeed, CCO Holdings, which is the largest individual position in the fund’s portfolio, only accounts for 2.14% of its total assets:
BNY Mellon
As such, we can clearly see that any individual default should not have a noticeable impact on the fund as a whole. It would take mass defaults across a variety of industries in order to really hand investors significant losses. It is a fair bet that the global economy has some severe problems if that were to occur.
The fund does have a great deal of industry diversity, which should serve as a source of comfort. We can see this here:
BNY Mellon
This is an advantage because many times crises are localized to a specific sector. For example, back in 2008, the Finance sector was negatively affected by the subprime crisis, but crude oil producers and telecommunications companies were largely unscathed. This is the way problems usually are, so the fact that the fund is avoiding having outsized exposure to any individual sector should help minimize losses in the event of a problem.
Unfortunately, companies that issue junk bonds are somewhat more impacted by interest rates than investment-grade firms. One reason for this is that these companies tend to have higher debt loads relative to their revenues and cash flows and spend a much larger portion of their revenue on debt service than investment-grade firms. As a result, when interest rates increase sufficiently, it can be enough to push their debt service costs above their operating profit. I suppose that this is technically a possibility with an investment-grade company as well, but these companies usually have sufficiently large margins between operating profit and debt service costs that it would take an enormous increase in interest rates to push them into default. As a result, default rates among speculative-grade issuers tend to increase when interest rates go up.
This is something that is very important right now, since as we just discussed, the Federal Reserve has aggressively raised interest rates to the highest levels that have been seen in two decades in an effort to reduce the high inflation that has been plaguing the economy. As such, we can expect to see the default rate on junk bonds go up, and since the BNY Mellon High Yield Strategies Fund invests almost exclusively in junk bonds, this is something that we need to keep in mind when investing in this fund.
Moody’s Investors Service, one of the major credit rating agencies, expects that the trailing default rate this year will be roughly triple that of last year. The rating agency suggests that 4.4% of speculative-grade issuers will default in the twelve-month period that ended in August compared to the 1.5% trailing twelve-month default rate that was observed in August 2022. It seems likely that this will offset some of the benefits that the fund receives from the higher yields that it receives on junk bonds right now. However, given the diversity of both issuers and sectors, it seems likely that investors will not really notice the increase in defaults.
Performance
As mentioned in the introduction, the BNY Mellon High Yield Strategies Fund managed to deliver a reasonably strong performance over the past year. This is partly due to a surprising amount of strength in the junk bond market. As Reuters reports :
U.S. junk bond offerings have spiked in recent weeks on the back of strong demand from investors looking to boost their returns by buying the risky yet high-yielding debt.
The ICE BofA High Yield Index had total year-to-date returns of 7.25%, while the Morningstar LSTA U.S. Leveraged Loan 100 Index has returned 9.66%. In comparison, the ICE BofA Corporate Index, which tracks investment-grade bonds, has seen a 2.01% total return so far this year.
More supply of new junk debt, including that backing recently announced leveraged buyouts, is expected to lift overall issuance volume of bonds and loans to $20 billion or more this month, said some investors.
The Reuters article makes it quite clear that the demand for junk bonds is quite strong despite the fact that default rates are rising. This has undoubtedly had a positive impact on this fund’s performance since the high demand for junk bonds will drive up the price of the junk bonds held by the fund. We saw in the introduction that the fund’s shares have been almost flat over the past twelve months.
However, one of the important things to consider when determining the actual return that an asset delivers is its distribution. This is especially true with closed-end funds, which tend to pay out a substantial portion of their returns as distributions to the shareholders. It only takes a moment of thought to realize this. After all, if an asset’s price goes down by 1% in a given year but it pays a distribution equal to 10% of its share price, you are still richer at the end of the year than you were when you started. As such, we want to have a look at the fund’s total returns, not its price return.
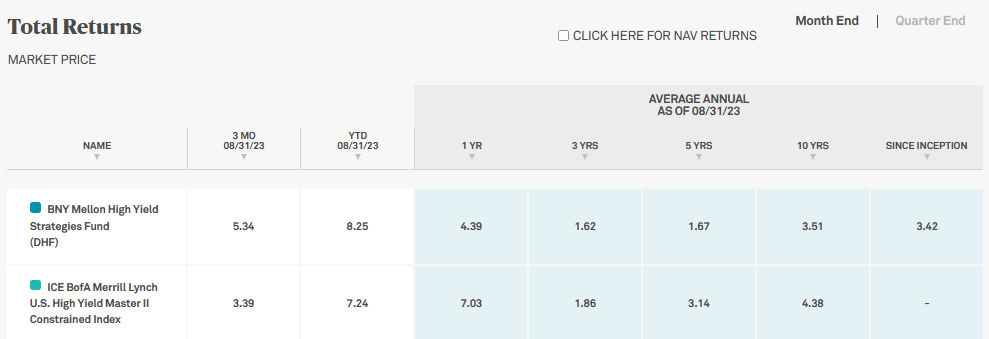
The BNY Mellon High Yield Strategies has managed to deliver a very respectable total return over the past year by virtue of its high yield. As we can see here, the fund has managed to deliver an 8.05% total return to its shareholders over the past year:
The fund benchmarks itself against the ICE BofA Merrill Lynch U.S. High Yield Master II Constrained Index. There is no index fund that specifically tracks this index, but as we can see here, the fund has underperformed it during most periods exceeding a year in length:
In fact, the only period during which the fund outperformed this index was the year-to-date and the trailing three-month periods, both of which are for the periods that ended on August 31, 2023. As such, the above chart does not consider the fund’s performance in September.
This does not mean that we are completely out of luck for benchmarking purposes. After all, there are a few indices that track junk bonds and have an exchange-traded fund freely available. One of them is the Bloomberg High Yield Very Liquid Index ( JNK ). The BNY Mellon High Yield Strategies Fund has compared fairly well against this index over the past year, as shown here:
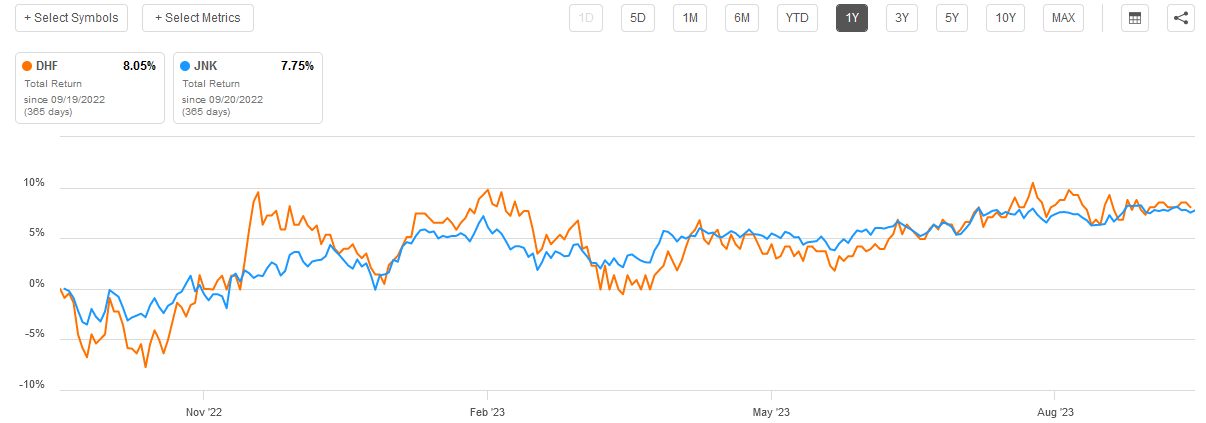
This is certainly a very reasonable performance for the fund, as it did manage to beat a comparable junk bond index over the past year.
However, income-focused investors frequently like to purchase an asset with the intention of holding it for a very long time. After all, the basic goal is to receive a regular cash distribution from the assets that can be spent or used to purchase more assets for their portfolios. Unfortunately, the BNY Mellon High Yield Strategies Fund does not compare as favorably to the index over extended periods. Here is the ten-year comparison as evidence of this:
As we can clearly see here, in this case, the index completely outperformed the closed-end fund. We see similar results over a five-year period:
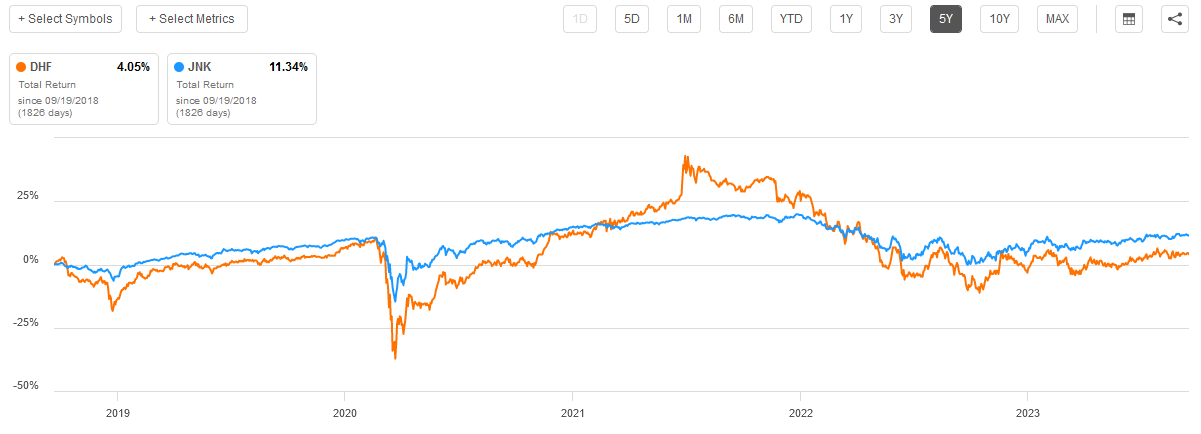
The big thing that we see here is that when the index, the BNY Mellon Fund typically declines by much more. These larger declines during bear markets add up over time and result in the fund underperforming the index over extended periods. While past performance is no guarantee of future results, it appears that the closed-end fund is a better fund for speculation during bull market runs while the index fund is more appropriate for risk-averse investors who just want a regular stream of income that they do not have to worry about too much.
Leverage
As we just saw, the BNY Mellon High Yield Strategies Fund tends to make amplified downward moves during periods of weakness for junk bonds. This is due to the fund’s use of leverage. I explained how this works in a previous article :
In short, the fund borrows money and then uses that borrowed money to purchase bonds or other income-producing assets. As long as the purchased assets have a higher yield than the interest rate that the fund needs to pay on the borrowed money, the strategy works pretty well to boost the effective yield of the portfolio. As this fund is capable of borrowing money at institutional rates, which are considerably lower than retail rates, that will usually be the case.
However, the use of debt in this fashion is a double-edged sword. This is because leverage boosts both gains and losses. As such, we want to ensure that the fund is not using too much leverage since that would expose us to too much risk. I do not generally like to see a fund’s leverage exceed a third as a percentage of its assets for this reason.
As of the time of writing, the BNY Mellon High Yield Strategies Fund has levered assets comprising 29.71% of its portfolio. This is fairly reasonable compared to many other fixed-income funds. It is also below the one-third limit. Overall, the fund is probably striking a reasonable balance between the risk and reward here. It is important to note though that the larger losses during bear markets due to the fund’s leverage do result in it having lower total returns over extended periods as already discussed.
Distribution Analysis
As mentioned earlier in this article, the primary objective of the BNY Mellon High Yield Strategies Fund is to provide its investors with a very high level of current income. In pursuit of this objective, the fund has assembled a portfolio consisting of junk bonds, which tend to have a very high yield in today’s environment. The fund applies a layer of leverage on top of this to boost the effective yield beyond that offered by any of the bonds that are currently in the portfolio. Finally, the fund collects all of the coupon payments made by the bonds that it owns as well as any capital gains that it manages to generate through trading bonds, and pays them out to the shareholders net of any expenses. It can be expected that this would result in the fund having a very high distribution yield. This is indeed the case as the fund pays a monthly distribution of $0.15 per share ($1.80 per share annually), which gives it an 8.18% yield at the current price. Unfortunately, the fund has not been particularly consistent with respect to its distribution over the years:
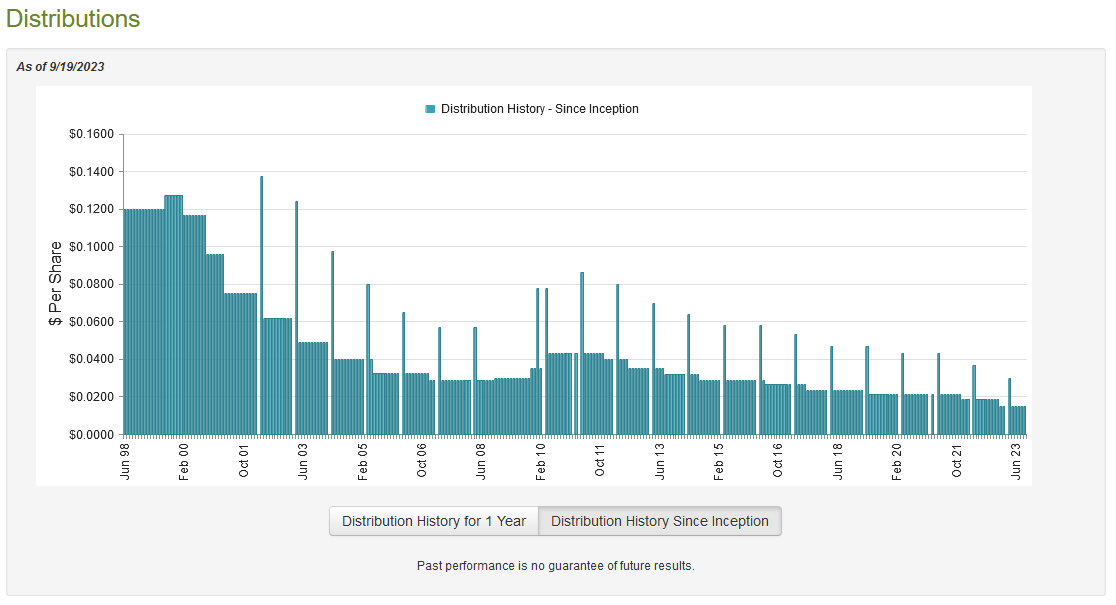
As we can see here, the fund has been steadily reducing its distribution ever since the economy started to recover from the financial crisis of 2008 and 2009. This will almost certainly reduce the appeal of the fund in the eyes of those investors who are seeking a safe and secure source of income with which to pay their bills and finance their lifestyles. The fund’s distribution cut in January will not help matters here. While most fixed-income funds vary their distribution over time, such variance usually at least somewhat correlates to interest rates. In this case, interest rates were at historically low levels during nearly all of the period in which the fund was cutting its distribution, which is a stark departure from what we normally see with similar funds. That is not a good sign.
With that said, the fund’s history is not necessarily the most important thing for new investors. After all, anyone purchasing the fund’s shares today will receive the current distribution at the current yield. A new buyer will not be negatively affected by the actions that the fund has taken in the past. As such, the most important thing for us right now is the fund’s ability to sustain its current distribution at the current level. Let us investigate this and attempt to determine how reliable its distribution is likely to be.
Fortunately, we have a relatively recent document that we can consult for the purpose of our analysis. As of the time of writing, the fund’s most recent financial report corresponds to the full-year period that ended on March 31, 2023. This report will admittedly not include any information about the fund’s performance over the past six months or so, but it will still give us a very good idea of how well it handled the challenging market conditions that existed at the end of last year. It should also give us a good idea of how well it was able to take advantage of the market optimism that existed early this year.
During the full-year period, the BNY Mellon High Yield Strategies Fund received a total of $19,395,785 in interest along with $316,397 in dividends from the assets in its portfolio. This gives the fund a total investment income of $19,712,182 during the period. It paid its expenses out of this amount, which left it with $14,212,930 available for shareholders. Unfortunately, this was not enough to cover the $15,383,777 that the fund paid out in distributions to its shareholders, although it did manage to get fairly close. This could still be concerning though as we usually like fixed-income funds to completely pay their distributions out of net investment income.
Fortunately, this fund does have other methods through which it can obtain the money that it needs to cover its distributions. For example, it might be able to exploit price fluctuations and trade bonds for some capital gains. Unfortunately, the fund failed miserably at this task during the period. It reported net realized losses of $33,135,528 and had another $1,860,312 net unrealized losses. Overall, the fund’s net assets went down by $36,166,687 after accounting for all inflows and outflows over the period. This certainly explains why the fund reduced its distribution back at the start of this year. It certainly needed to stem the bleeding. The unfortunate thing is that this represents the fund’s second straight year of net asset declines, although it did manage to cover its distributions during the preceding period. This is not a good sign, overall.
The sustainability of the distribution depends on one major factor right now. As we just saw, the fund’s net investment income was just a bit short of the distribution. If the fund’s net investment income remains sufficient to cover its distribution at the new level, then we probably do not need to worry about another distribution cut. We will have to wait for the fund to release its semi-annual report to determine if this is indeed the case. I am cautiously optimistic, but the two straight years of declining net assets have been causing net investment income to decline even as the yield that the fund receives on newly purchased bonds has been rising. The fund is probably okay for now, but we want to keep watching its finances very closely.
Valuation
As of September 19, 2023 (the most recent date for which data is currently available), the BNY Mellon High Yield Strategies Fund has a net asset value of $2.57 per share but the shares currently trade for $2.21 each. This gives the fund’s shares a 14.01% discount on net asset value at the current price. This is a very respectable discount that would normally represent an excellent price to pay for the fund. It is also a bit better than the 13.57% discount that the shares have had on average over the past month. As such, the current price is quite reasonable for anyone who wants this fund.
Conclusion
In conclusion, the BNY Mellon High Yield Strategies Fund could be a reasonable option for someone who wants to invest in the junk bond market right now. Investors have been showing an increasing amount of interest in these high-yielding securities, which has been exerting a positive effect on both junk bonds and seemingly the share price of this fund. Unfortunately, default rates are rising, so it appears that these securities are becoming riskier than they once were. This fund appears to be managing the risk reasonably well, though. The current valuation certainly represents a fairly good place to get in, but the distribution history could certainly be a major turn-off for those that want a safe and secure source of income.
For further details see:
DHF: Decent Junk Bond Fund At A Good Price, But Distribution History Problematic