HOMZ - DHS: High Dividends And A Monthly Payout But Watch Those Fees
2023-03-09 13:30:00 ET
Summary
- DHS, from WisdomTree, is a high-dividend ETF. It pays dividends monthly and is based on an index methodology that is somewhat unique among its peers.
- In this article, using DHS's summary prospectus, I briefly summarize this unique strategy and discuss some of its pros and cons.
- Next, I compare DHS against 2 competitors, both of which I hold in my personal portfolio, and reveal whether I plan to make any changes based on my findings.
(This article was co-produced with Hoya Capital Real Estate.)
In my roughly 7-1/2 years writing as ETF Monkey for Seeking Alpha, this is the first time that I have taken a look at WisdomTree U.S. High Dividend Fund (DHS). In short, the likely reason for this is that DHS carries an expense ratio of .38%. I tend to focus on ETFs with very low expense ratios, since any fees come out of returns in both the good times, when the market is rising, as well as the bad times, when the market is falling. Related to this, there are several high-quality, dividend-focused ETFs that carry expense ratios in the range of .06% to .08%, roughly 1/3 of one percent lower than DHS.
At the same time, I have made exceptions to my general rule to feature funds that are doing something unique, thus possibly deserving of investors' attention despite slightly higher expense ratios. As one example, I have on several occasions reviewed Hoya Capital Housing ETF ( HOMZ ). This unique ETF, which has been dubbed "The Housing ETF," takes a very unique approach to packaging housing, whether owned or rented, in a single ETF.
It is in this spirit that I come around to taking a look at DHS. Shall we take a look at it together?
DHS - A Unique Methodology Seeks High Dividends While Reducing Risk
What, exactly, is that "something unique" that piqued my interest in DHS? In short, WisdomTree uses a most interesting methodology in the development of this ETF.
Investors desirous of income tend to look to stocks which offer a higher level of dividends than the market as a whole. At the same time, this can be a risky section of the market, as it is often the case that high dividends are paid by companies that are at least growing very slowly and, potentially even more disastrous, are in financial distress.
To combat this, the index on which DHS is based employs a composite risk score to prevent distressed stocks from entering the portfolio. Let's see how this works. As it turns out, it is a subset of a larger index from WisdomTree, the WisdomTree U.S. Dividend Index . The series of quotes that follow are all from the methodology document for this parent index as well as all sub-indexes derived therefrom.
First off, the requirements for inclusion in the parent index.
To be eligible for inclusion in the Domestic Dividend Indexes, a company must list its shares on a U.S. stock exchange, be incorporated and headquartered in the United States and pay regular cash dividends on shares of its common stock in the 12 months preceding the annual reconstitution, which takes place in December. Companies need to have a market capitalization of at least $100 million . . . and shares of such companies need to have had an average daily dollar volume of at least $100,000 for three months preceding the Screening Date.
From there, a quality screen is applied to filter out lower-quality stocks.
Companies that fall within the bottom decile of a composite risk factor score, which is composed of on equally weighted score of the below two factors, are not eligible for inclusion.
Quality Factor - determined by static observations and trends of return on equity (ROE), return on assets (ROA), gross profits over assets and cash flows over assets. Scores are calculated within industry groups.
Momentum Factor - determined by stocks' risk adjusted total returns over historical periods (6 and 12 months)
Companies that fall within the top 5% ranked by dividend yield and also the bottom 1?2 of the composite risk factor score are not eligible for inclusion.
Here is where things get a little more interesting. As opposed to weighting companies that pass the above tests by market cap, the index weights by the total amount of dividends to be paid .
The initial weight of a component in the Index at the annual reconstitution is equal to the dollar value of the company's cash dividends to be paid in the coming year based on the company's indicated annual dividend per share. To calculate the weighting factor - Cash Dividends to be paid - indicated annual dividend per share is multiplied by common shares outstanding. Thus, each component's weight . . . reflects its share of the total Dividend Stream projected to be paid in the coming year by all of the component companies in the Index.
In summary, then,
- Stocks are first scored on an equal-weighted combination of momentum and quality metrics .
- Stocks that score the highest are then weighted by the indicated annual dividend to be paid, bringing the highest-yielding stocks to the top.
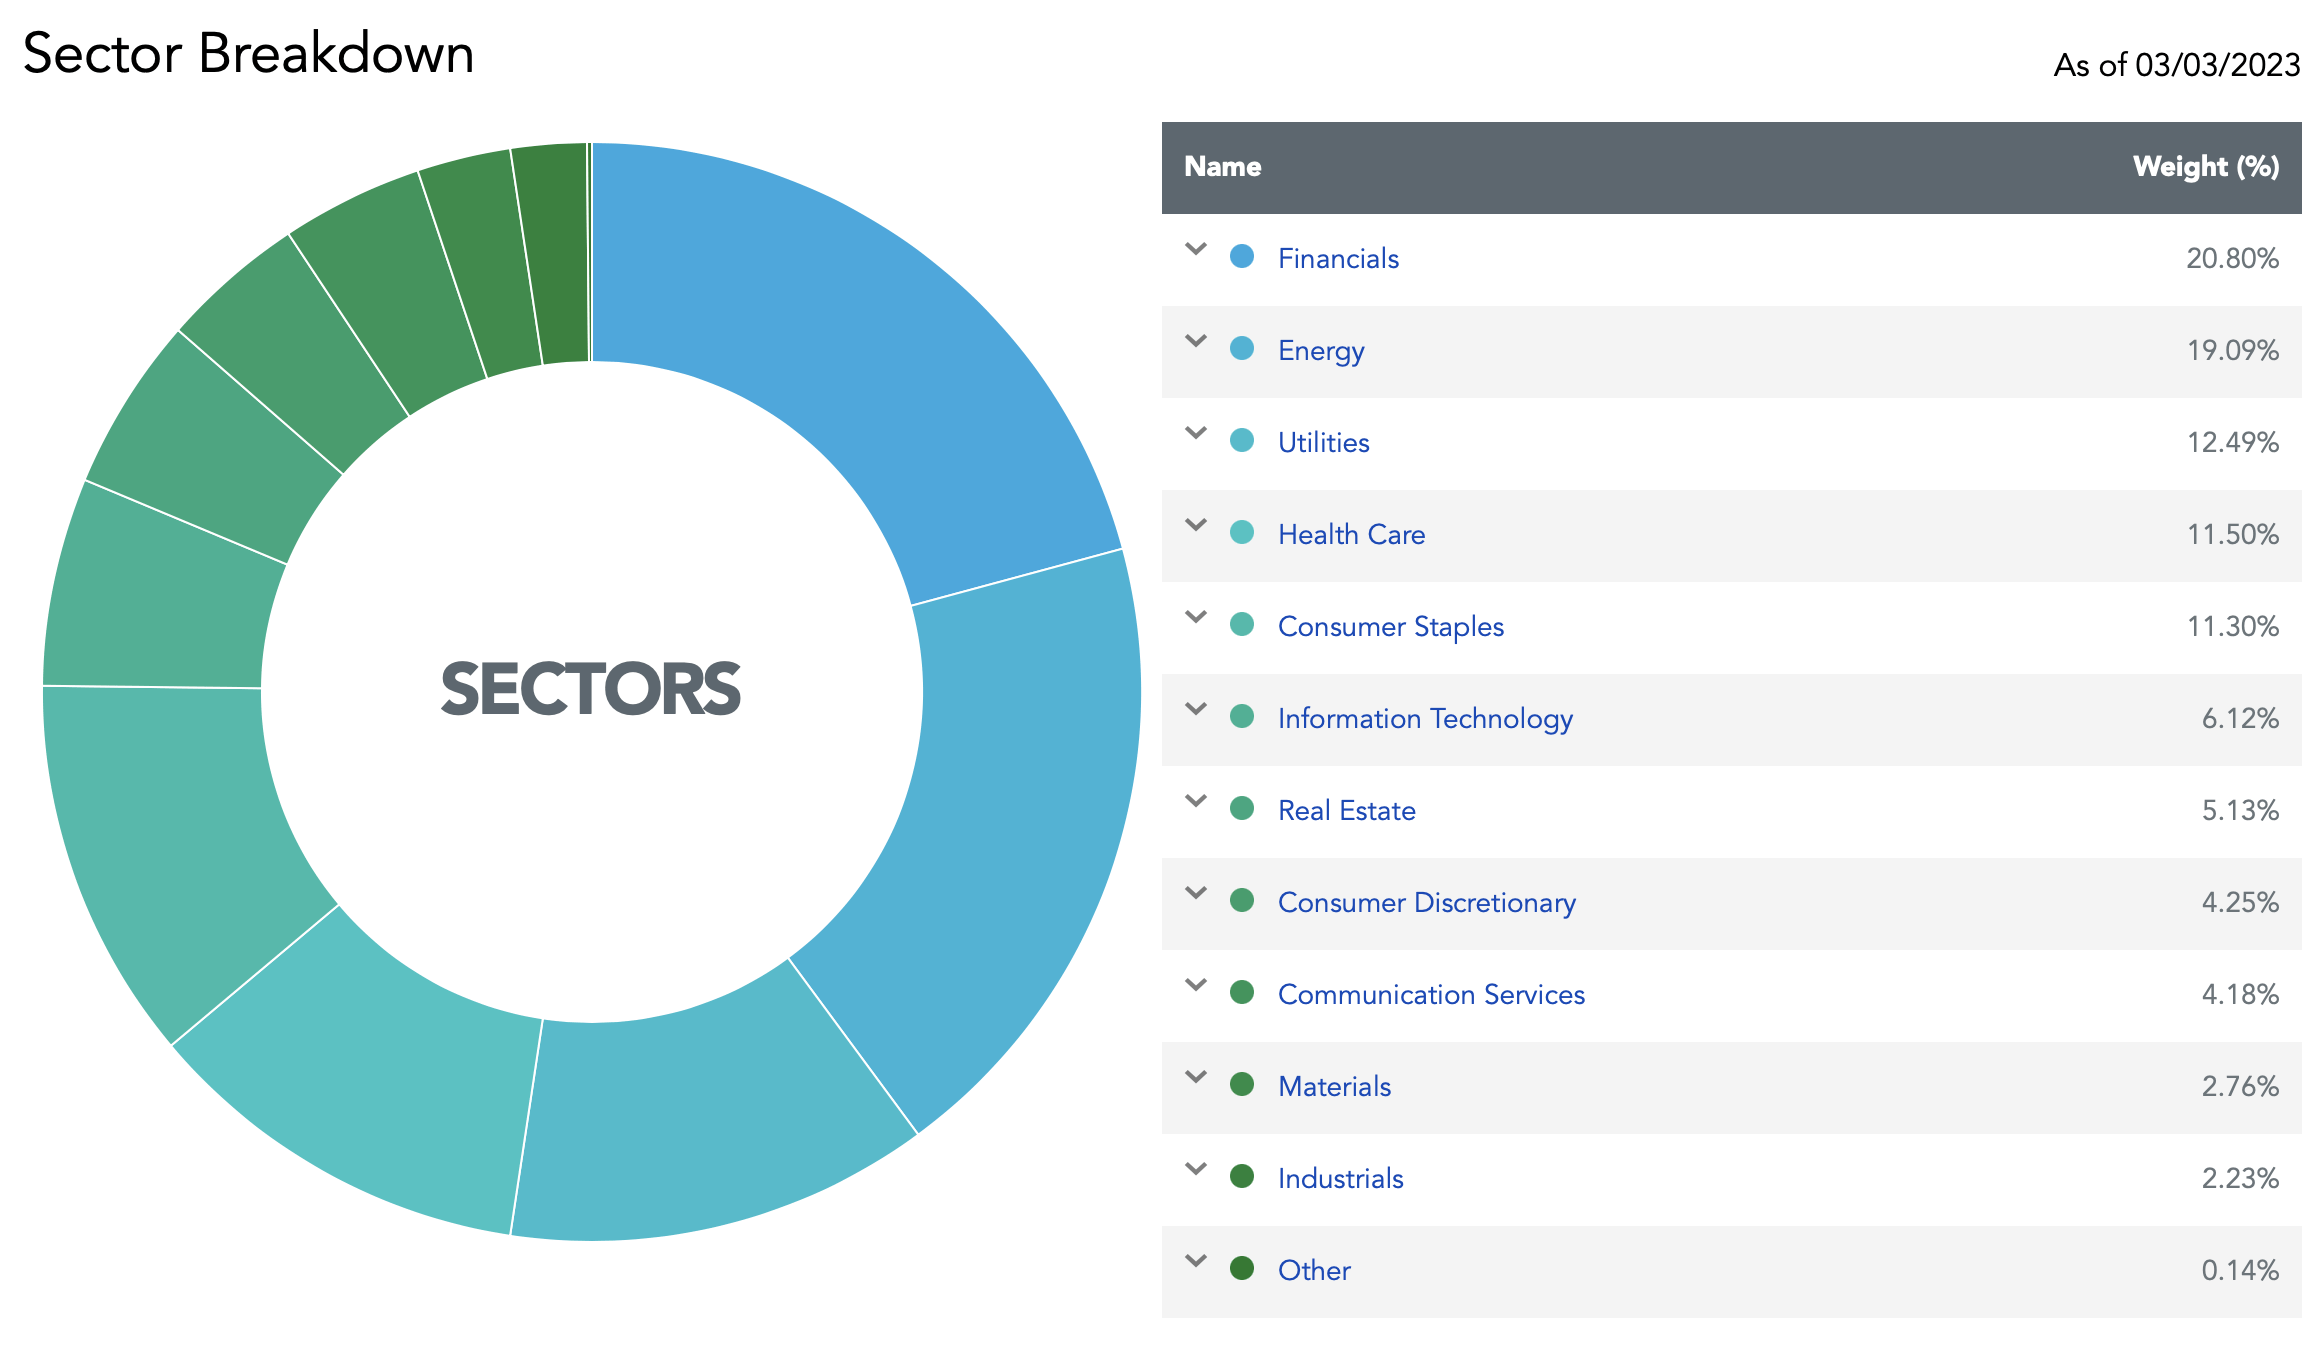
How does this selection criteria play out, as of the latest reconstitution of the index? Courtesy of the DHS webpage from WisdomTree, here is the latest sector breakdown:
DHS: Sector Weightings (WisdomTree DHS Webpage)
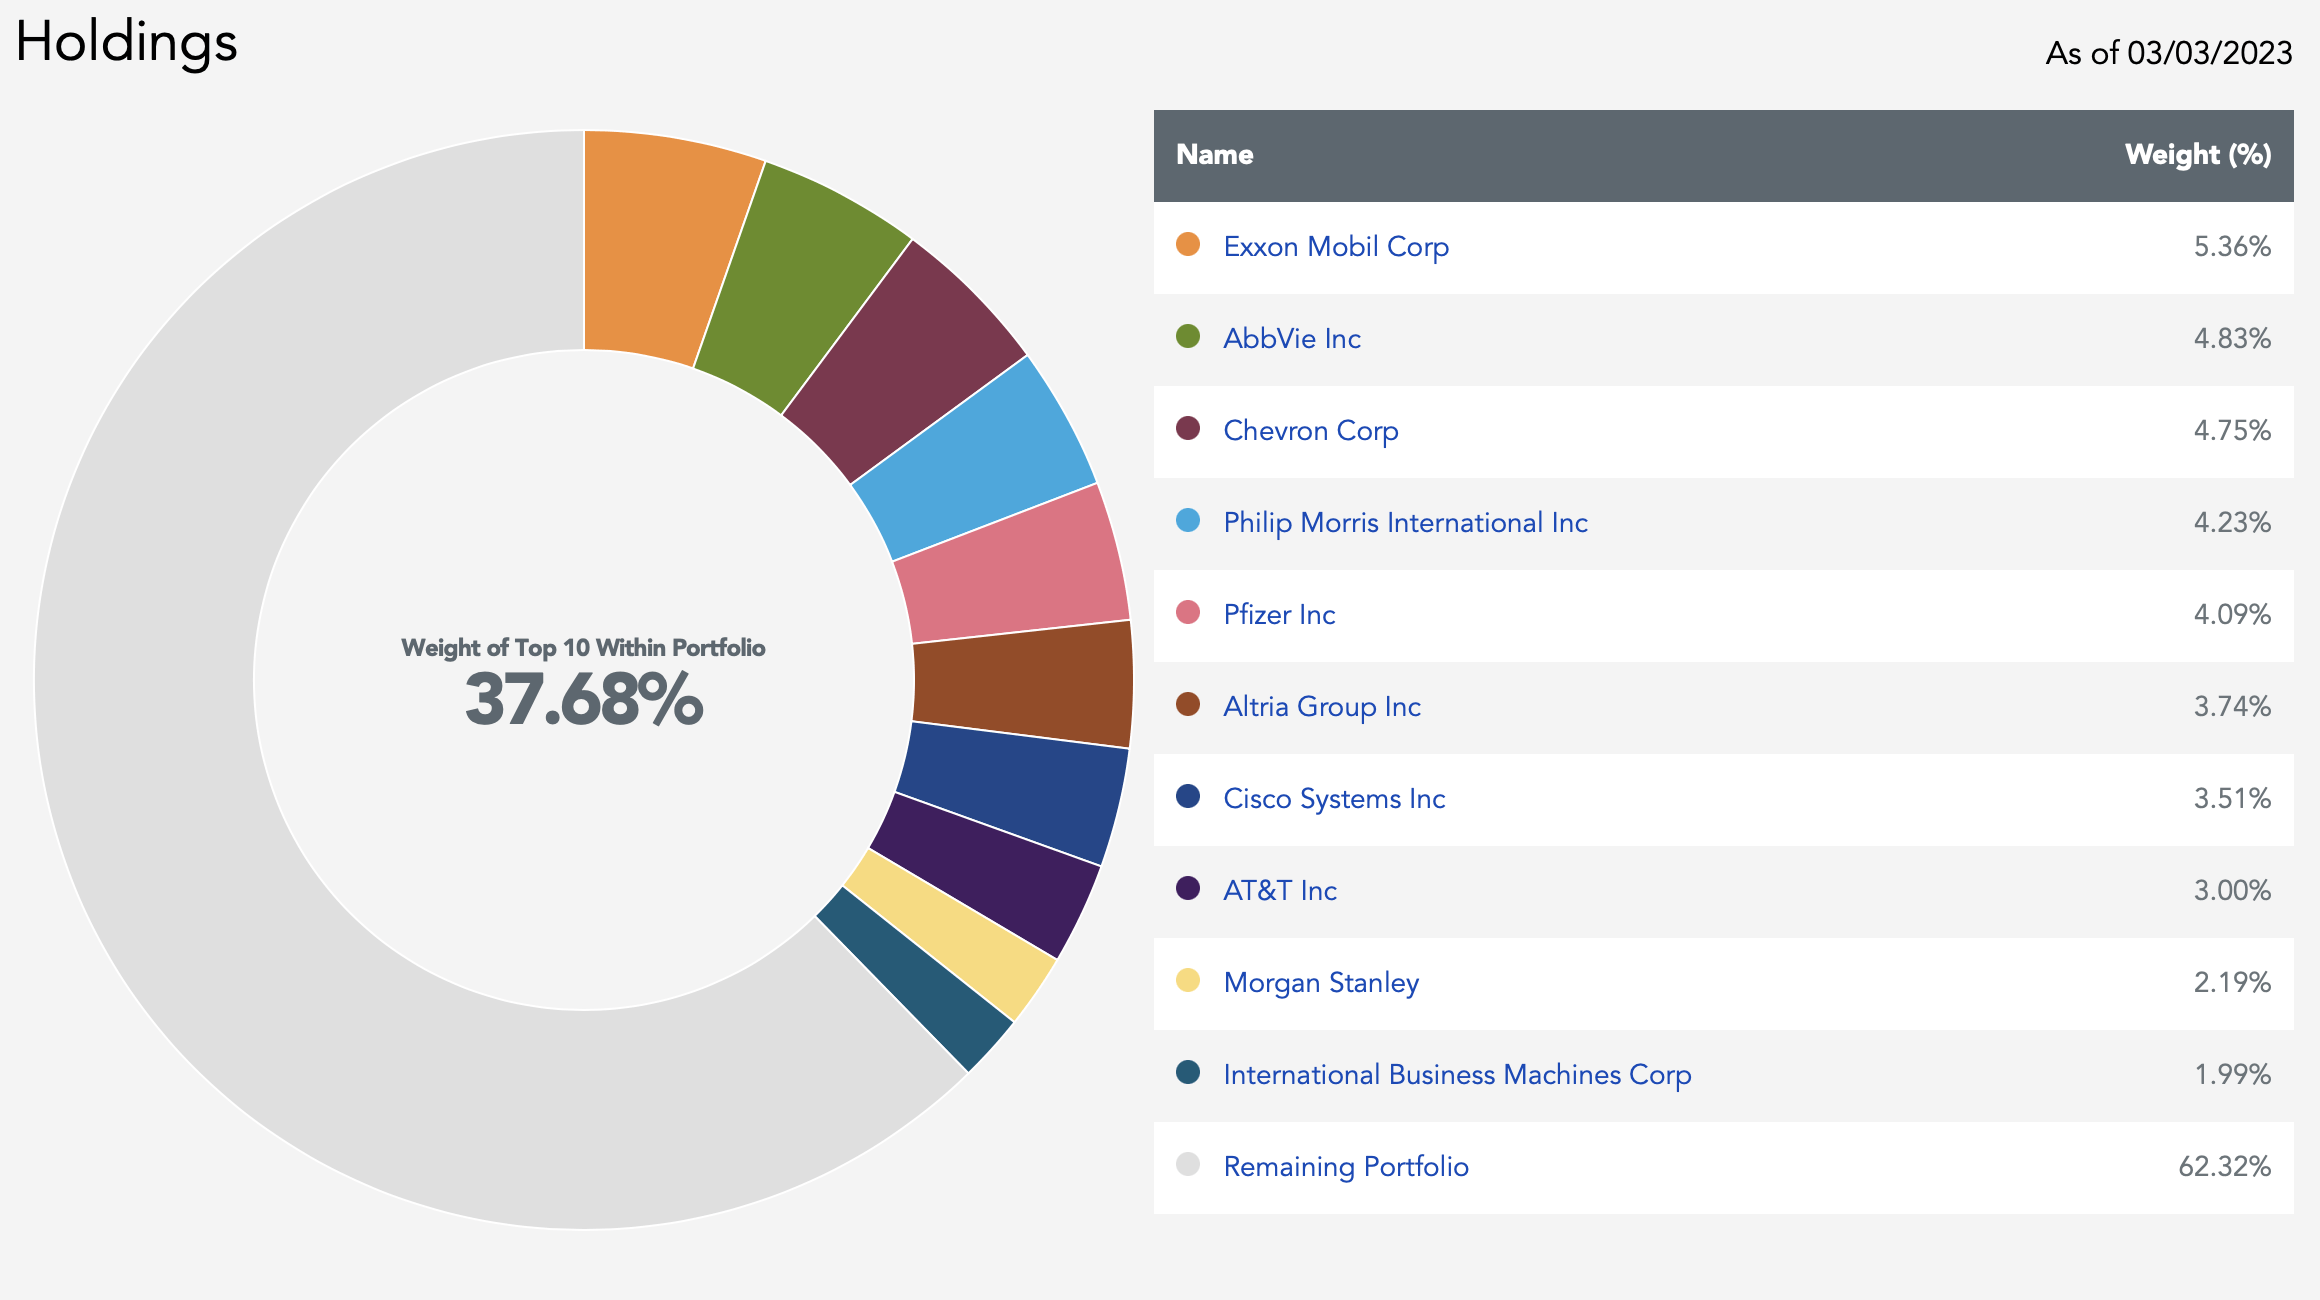
Next, the most current Top 10 holdings:
DHS: Top 10 Holdings (WisdomTree DHS Webpage)
It comes as no surprise that Energy, Utilities, and Health Care are 3 of the 4 most heavily weighted sectors. Dropping down to the Top 10 list, we see some of the most recognizable names within those industries.
With that, let's turn our attention to how the fund has performed.
Examining SCHY's Performance - Where The Rubber Meets The Road
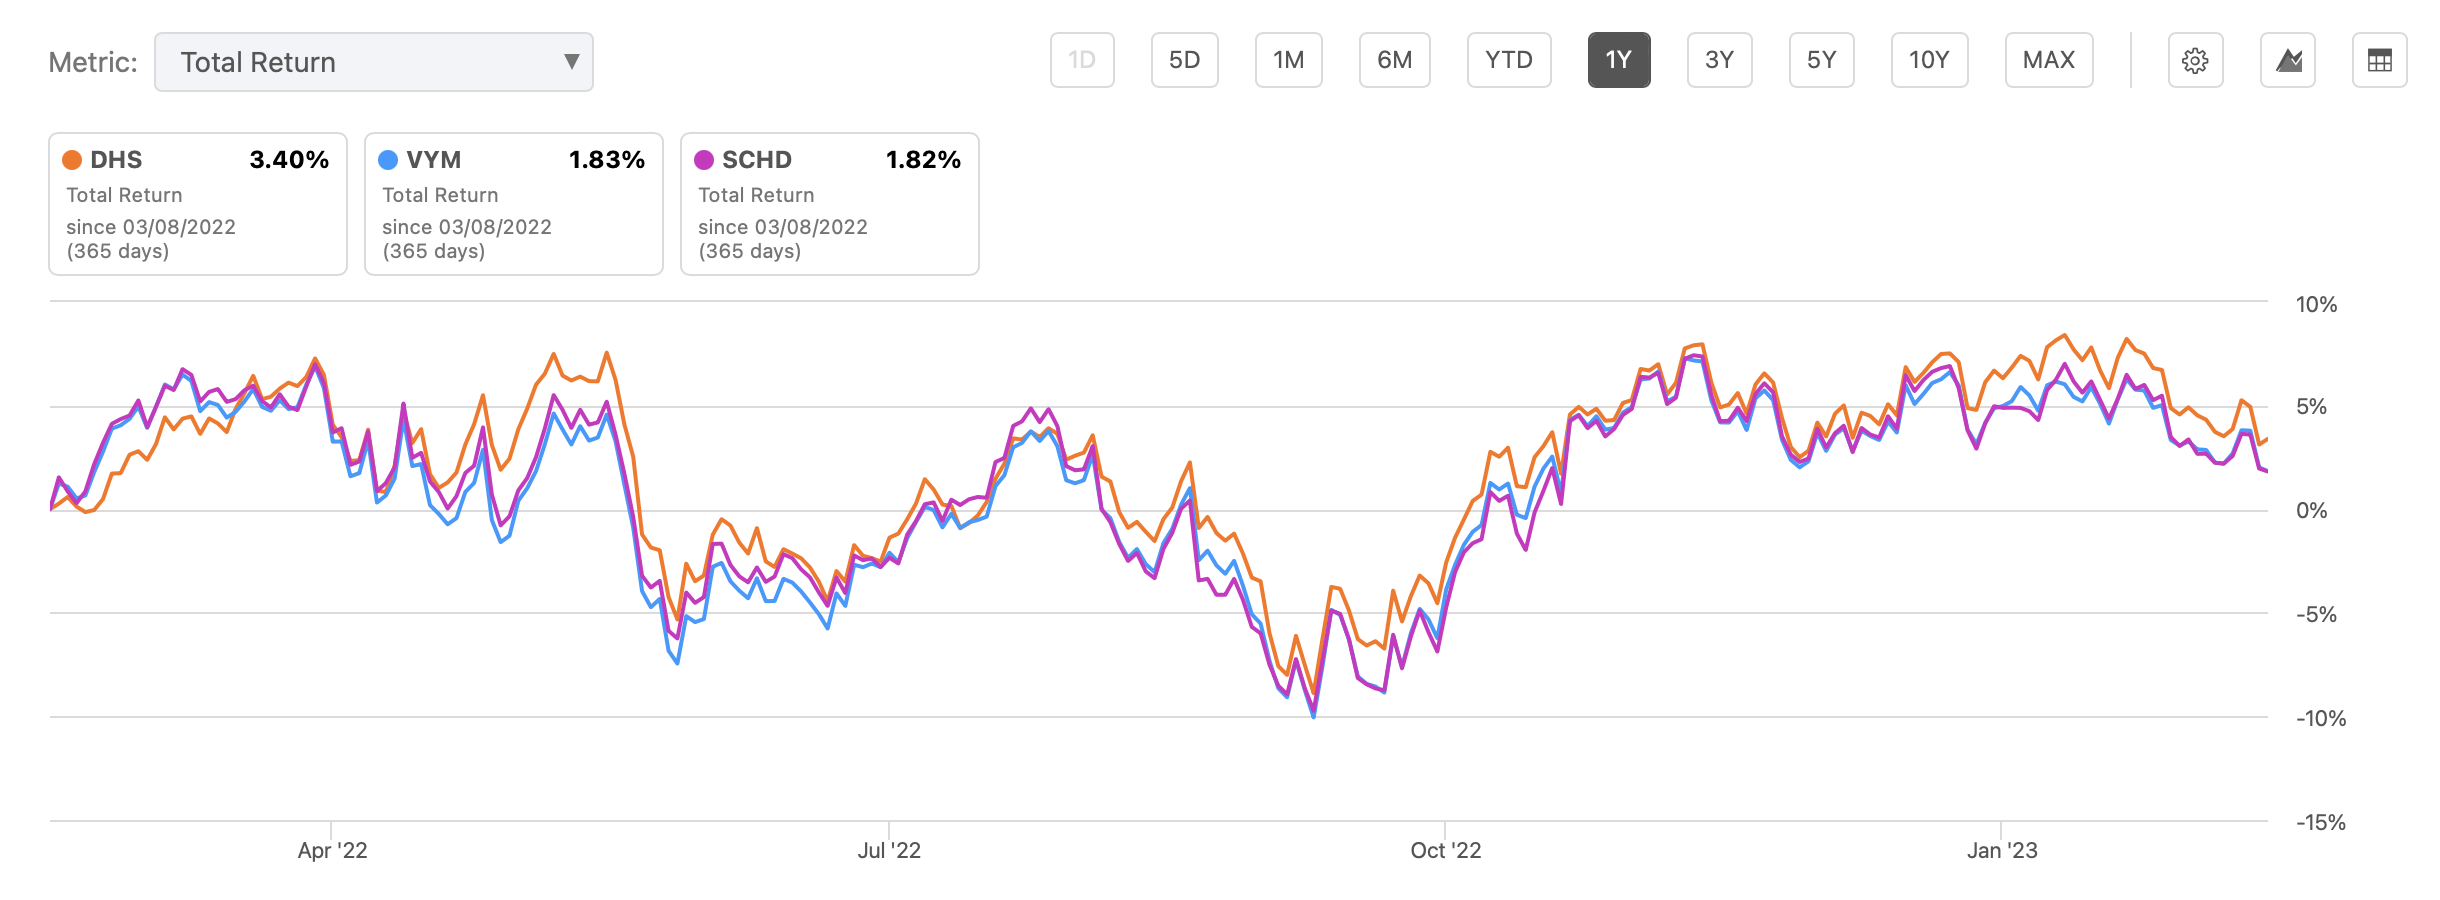
In terms of analyzing how well DHS has fared, I decided to compare it against a couple of well-known high-dividend ETFs; Schwab U.S. Dividend Equity ETF ( SCHD ) and Vanguard High Dividend Yield ETF ( VYM ) As a reference point, both SCHD and VYM sport expense ratios of .06%, or over 30 basis points less than DHS. I took advantage of a helpful comparison tool available here on Seeking Alpha. Here are the comparative results for DHS, SCHD, and VYM over the past year.
DHS/SCHD/VYM: Performance Comparison (Seeking Alpha)
As can be seen, DHS has held up very nicely over the past year, when compared with SCHD and VYM. Not only that, at 3.66%, DHS's dividend yield edged out SCHD's 3.45% and VYM's 3.05% over this same period. I found all of this of interest personally, as I currently hold both SCHD and VYM in my personal portfolio.
On top of that, DHS pays dividends on a monthly basis, whereas the other two ETFs pay on the more common quarterly basis. Given the choice, I like that feature. After all, many bills associated with the running of a household are payable monthly, so having a flow of income that matches this may be very desirable for investors who live off that income.
Putting all of this together, it might seem that I should immediately sell my SCHD and VYM and exchange it for DHS, despite its slightly higher expense ratio.
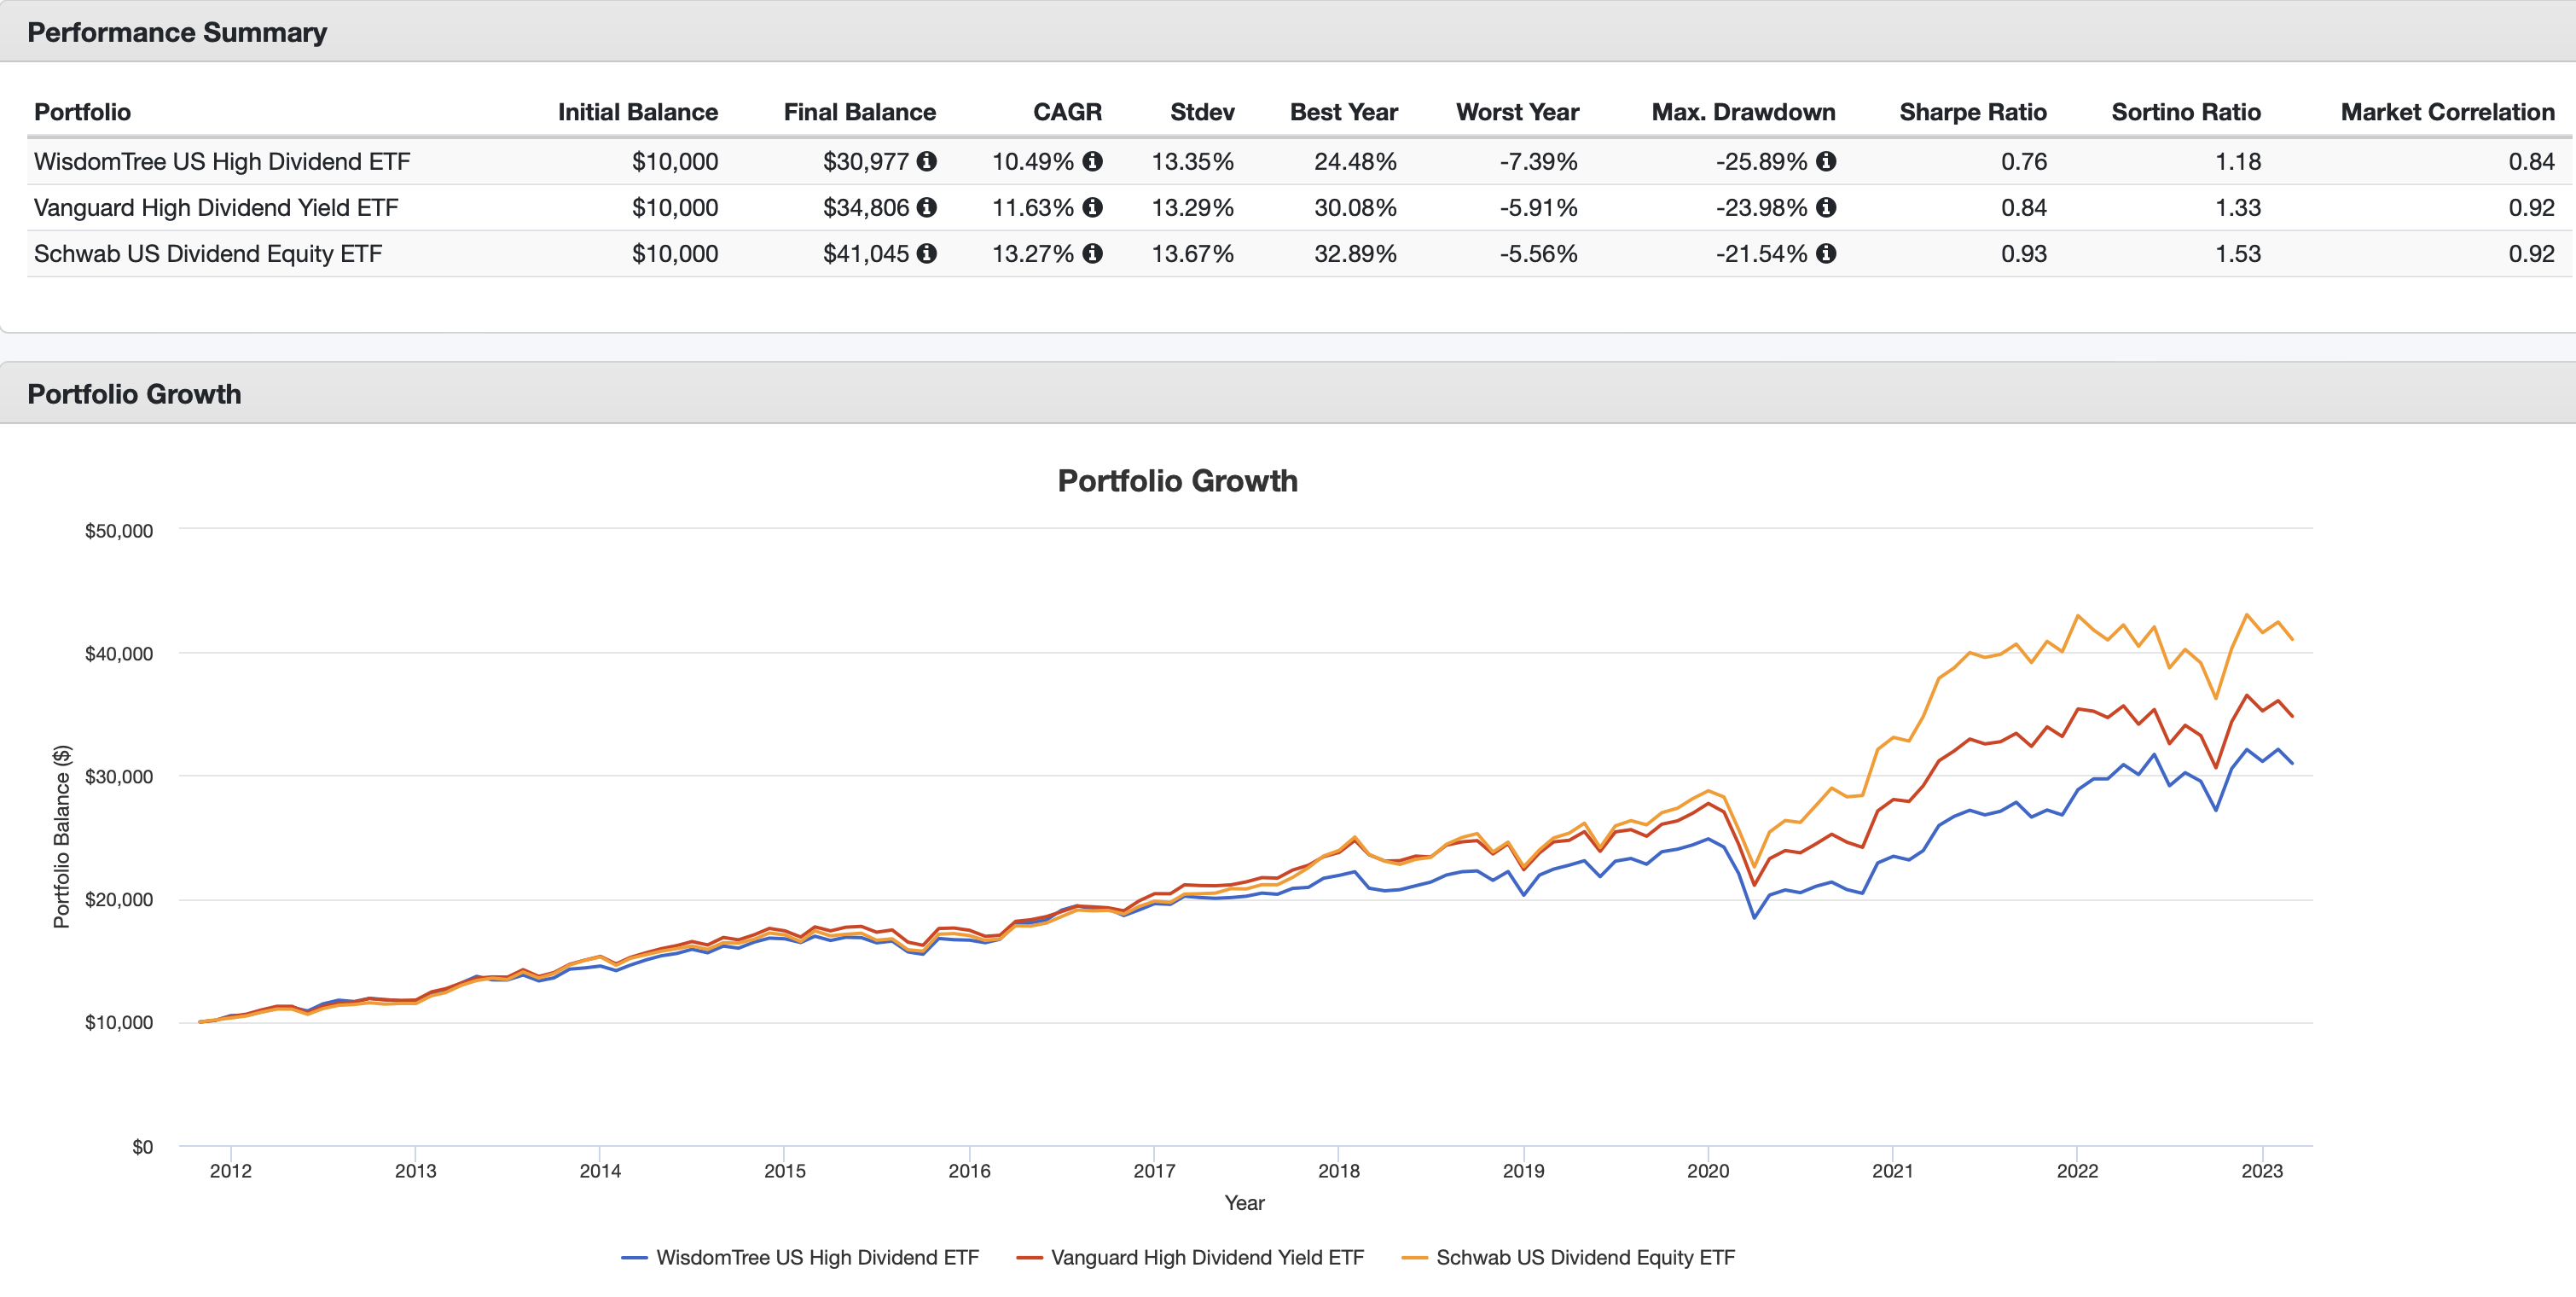
However, as a second point of reference, what if we expand the time horizon of a backtest to a much longer period? As it happens, we can quickly obtain a backtest from Portfolio Visualizer that covers roughly 11 years, from late-2011 to the present. All dividends were accounted for and reinvested.
DHS/SCHD/VYM: 10+ Year Backtest (PortfolioVisualizer.com)
As can quickly be seen, over this time span the results are quite different. Both SCHD and VYM have been able to produce superior total returns, without any significant increase in volatility.
Summary And Conclusion
So where does all of this leave us?
Looking at the Portfolio Visualizer backtest I featured above, it can clearly be seen that, since roughly 2017, both SCHD and VYM have handily outperformed DHS. Is there a chance that this could turn around in the future, particularly given how much has changed in the world around us in the past year or so?
As one last check, I dug into the portfolio composition sections from the WisdomTree, Schwab, and Vanguard websites for the 3 ETFs. Take a look at the 3 data points I captured below.
| DHS |
| SCHD |
| VYM |
| 30-Day SEC Yield |
| 4.12% |
| 3.44% |
| 3.01% |
| Price/Earnings Ratio |
| 11.41 |
| 14.91 |
| 15.2 |
| Price/Book Ratio |
| 2.07 |
| 3.69 |
| 2.7 |
Putting it together, it appears that DHS might be considered fairly valued at the present time. Both its P/E and P/B ratios are substantially lower than the competitors I considered. In addition to that, DHS may have something to offer for investors primarily concerned with current income, both because its 30-day SEC yield is higher and because the dividends are paid on a monthly basis.
At the same time, there is that 30+ basis point difference in expense ratios to consider, along with the fact that SCHD and VYM have historically offered a superior risk/reward profile.
Given all of that, I think I will sit tight with the two ETFs I currently hold in my personal portfolio.
For further details see:
DHS: High Dividends And A Monthly Payout, But Watch Those Fees