VNOM - Diamondback Energy: Good Company In A Weak Environment
2023-06-13 06:57:12 ET
Summary
- Diamondback Energy reported 2023 first quarter earnings of $3.88 per share. This compares to $4.35 per share in Q1'22.
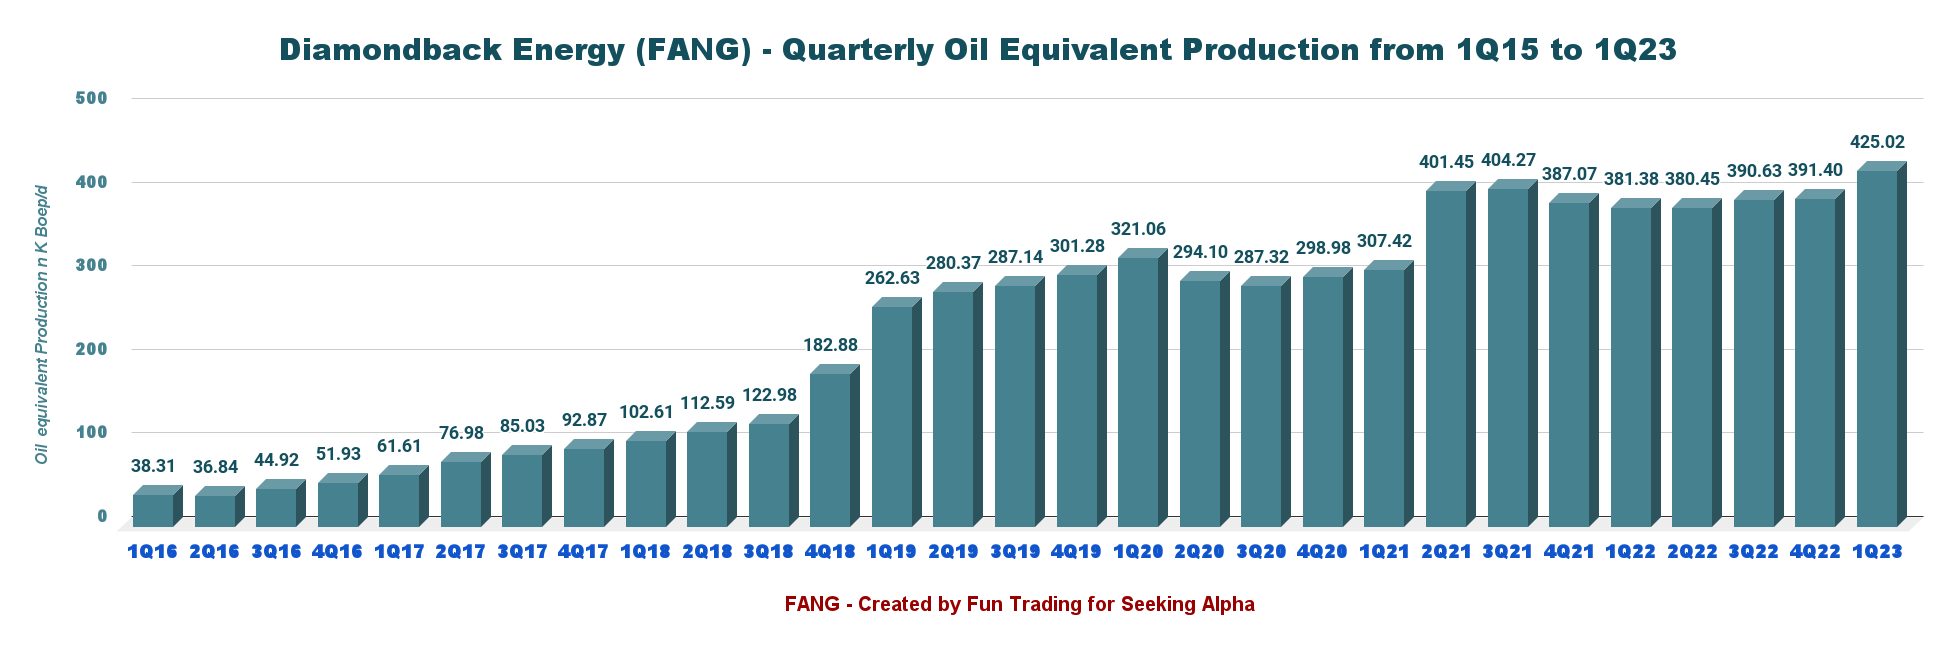
- This quarter's oil-equivalent production was 425.022K Boep/d at a composite oil price of $49.72 per Boe compared with $69.60 a year ago.
- I recommend buying FANG between $126 and $124 with potential lower support at $118.
Introduction
Midland, Texas-based Diamondback Energy, Inc. ( FANG ) released its first-quarter 2023 on May 1, 2023.
Note: This article updates my article published on Mars 20, 2023. I have been following Diamondback Energy since 2019.
1 - 1Q23 Results Snapshot
The company reported the first quarter of 2023 earnings of $3.88 per share . This compares to $4.35 per share in 1Q22.
This quarter's oil-equivalent production was 425.022K Boep/d at a composite oil price of $49.72 per Boe compared with $69.60 a year ago. Oil production was 251.38K Bop/d or 59.1% of the total output.
Diamondback's first-quarter cash operating cost was $11.61 per Boe compared to $11.36 in the prior-year quarter.
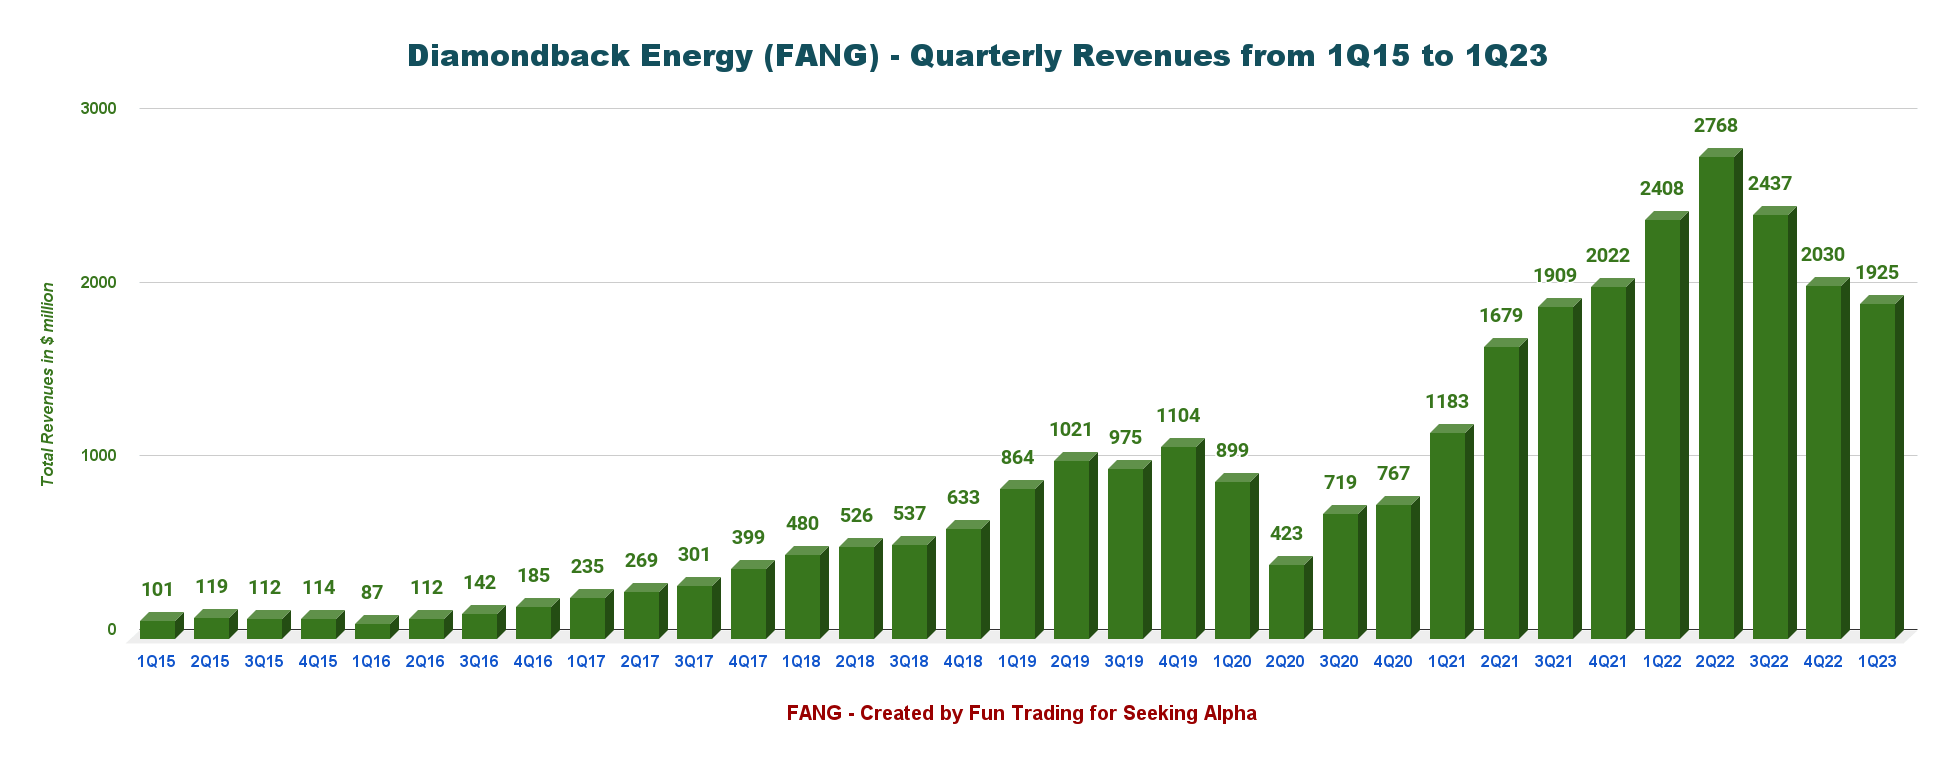
This quarter's revenues were $1.925 billion , down 20% from the year-ago quarter's sales of $2.408 billion. Commodity prices have cooled off significantly from the preceding quarter. The decrease reflects lower overall price realization, partially compensated by higher-than-expected production.
Diamondback declared a variable cash dividend of $0.03 per share , representing a total base-plus-variable dividend of $0.83 per share in 1Q23. A big drop sequentially.
Diamondback Energy repurchased 2,530,646 shares of common stock in 1Q23 for $332 million (at a weighted average price of $131.34/share); repurchased 511,200 shares of common stock to date in 2Q23 for $72 million (at a weighted average price of $141.77/share).
As previously announced, Diamondback completed divestitures of:
- 10% equity ownership in the Gray Oak crude oil pipeline.
- ~4,900 net acres in Ward and Winkler counties.
- ~19,000 net acres in Glasscock County.
- Certain royalty interests to Viper Energy Partners LP for approximately $75 million.
- $773 million of gross proceeds in non-core asset sales are on track to meet or exceed our $1 billion target by year-end 2023.
Travis Stice, the CEO, said in the conference call :
Our commitment to our shareholders remain unchanged to be the low-cost leader in efficiency and in execution. And it's certainly been our track record, and that's what we anticipate going forward.
2 - Investment Thesis
As I said in my preceding article, the investment thesis for FANG is turning bearish in 2023. The company is still solid with excellent growth prospects, but the economy is weakening, and oil and gas prices are struggling again. The obvious result is a quick drop in free cash flow.
Thus, while I continue to recommend a long-term investment in this industry, it is time to take some profit off and build a cash position for further retreat later this year.
Thus, trading LIFO using a combination of technical and fundamental analysis is the only viable strategy that can provide a decent long-term reward while reducing the risks.
It allows you to profit from the short-term recurring swings and increase your leverage during unfavorable or unexpected turnarounds that can last longer than expected. This dual strategy is what I am suggesting and constitutes the backbone of my Gold and Oil marketplace.
This two-level strategy has prevailed in my marketplace, "The Gold and Oil Corner," and I believe it is the most rewarding strategy in those circumstances.
3 - Stock Performance
Diamondback Energy owns one subsidiary after acquiring Rattler Midstream. The subsidiary is Viper Energy Partners ( VNOM ), which trades separately with similar results.
Diamondback Energy's performance over a one-year turned into a rout since November 2022, with a drop of 27% on a one-year basis. FANG fared a bit better and is down 17%.
Diamondback Energy - 1Q23 Quarterly Financial History: The Raw Numbers
| Diamondback FANG |
| 1Q22 |
| 2Q22 |
| 3Q22 |
| 4Q22 |
| 1Q23 |
| Total Revenues and others in $ Million |
| 2,408 |
| 2,768 |
| 2,437 |
| 2,030 |
| 1,925 |
| Net income in $ Million |
| 779 |
| 1,416 |
| 1,184 |
| 1,007 |
| 712 |
| EBITDA $ Million |
| 1,372 |
| 2,225 |
| 1,929 |
| 1,690 |
| 1,402 |
| EPS diluted in $/share |
| 4.36 |
| 7.93 |
| 6.72 |
| 5.62 |
| 3.88 |
| Operating cash flow in $ Million |
| 1,252 |
| 1,707 |
| 1,925 |
| 1,441 |
| 1,425 |
| CapEx in $ Million |
| 733 |
| 553 |
| 739 |
| 1,480 |
| 1,537 |
| Free Cash Flow in $ Million |
| 519 |
| 1,154 |
| 1,186 |
| -39 |
| -112 |
| Cash and cash equivalent $ Million |
| 149 |
| 43 |
| 27 |
| 157 |
| 46 |
| Total debt in $ Million |
| 5.848 |
| 5.456 |
| 5,357 |
| 6,248 |
| 6,960 |
| Dividend per share in $ |
| 3.05 |
| 3.05 |
| 2.26 |
| 2.95 |
| 0.83 |
| Shares outstanding (diluted) in Million |
| 178.56 |
| 176.88 |
| 174.41 |
| 177.65 |
| 181.99 |
| Oil Production |
| 1Q22 |
| 2Q22 |
| 3Q22 |
| 4Q22 |
| 1Q23 |
| Oil Equivalent Production in K Boepd |
| 381.38 |
| 380.45 |
| 390.63 |
| 391.40 |
| 425.03 |
| Oil Composite realized price ($/Boe)/Hedge |
| 69.60/ 61.30 |
| 79.49/ 70.65 |
| 67.25/ 64.67 |
| 55.76 /55.01 |
| 49.72 /49.72 |
| OIL % |
| 58% |
| 58% |
| 57% |
| 58% |
| 59% |
| Oil in Bo |
| 20,055 |
| 20,120 |
| 20,638 |
| 20,803 |
| 22,624 |
| NG in Mcf |
| 42,645 |
| 42,912 |
| 45,799 |
| 45,020 |
| 47,388 |
| NGL in Boe |
| 7,161 |
| 7,349 |
| 7,667 |
| 7,703 |
| 7,730 |
| Total in Boe |
| 34,324 |
| 34,621 |
| 35,938 |
| 36,009 |
| 38,253 |
Source: Diamondback Energy press release
Analysis: Revenues, Free Cash Flow, Net Debt, and Oil & Gas Production
1 - Quarterly revenues and others were $1,925 million in 1Q23
FANG Quarterly Revenues History (Fun Trading) Note: Oil revenues were $1,902 million, not including other operating income. FANG announced the first quarter of 2023 results on May 1, 2023. The quarter's revenues were $1,925 million, with a net income of $712 million or $3.88 per diluted share. The adjusted net income was $4.10 per diluted share compared to $5.20 last year. Diamondback's cash operating costs for the first quarter of 2023 were $11.61 per BOE compared to $11.36 in the prior-year quarter, including:
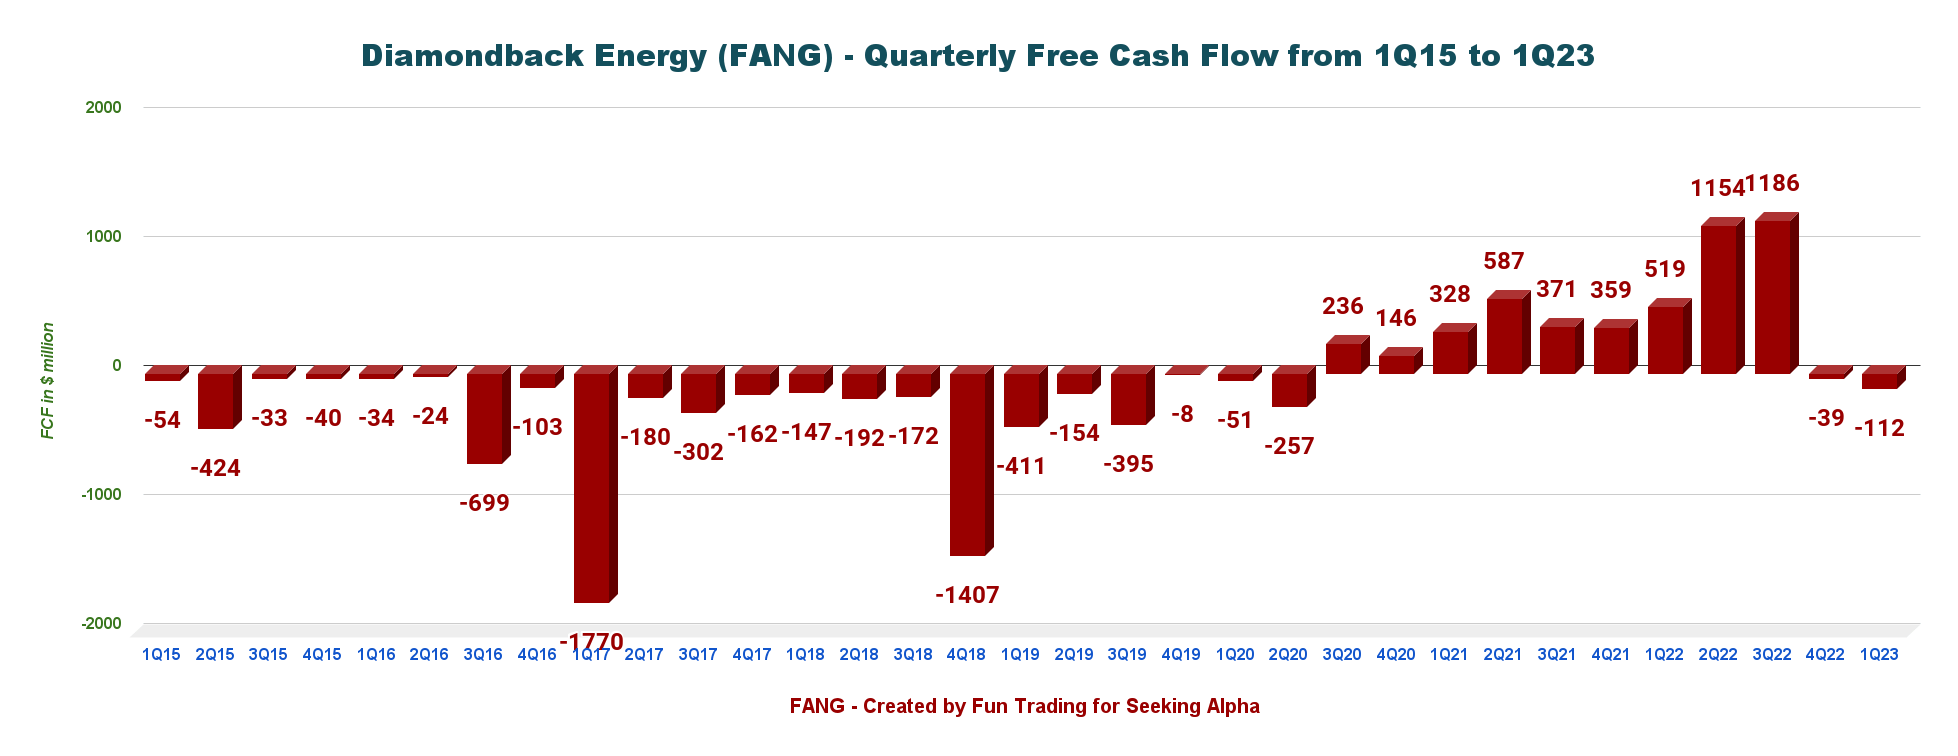
2 - Generic free cash flow was a loss of $112 million in 1Q23
FANG Quarterly Free Cash Flow History (Fun Trading)
Operating cash flow is $1,425 million, and CapEx is $1,537 million.
Trailing 12-month free cash flow is now $2,177 million , with the first quarter's free cash flow at a loss of $112 million .
FANG declared a 4Q22 base cash dividend of $0.80 per share and an extra cash dividend of $0.03. It is a total base-plus-variable dividend of $0.83 per share for 1Q23.
Also, FANG repurchased 2,530,646 shares of common stock in 1Q23 for $332 million (at a weighted average price of $131.34/share); repurchased 511,200 shares of common stock to date in 2Q23 for $72 million (at a weighted average price of $141.77/share).
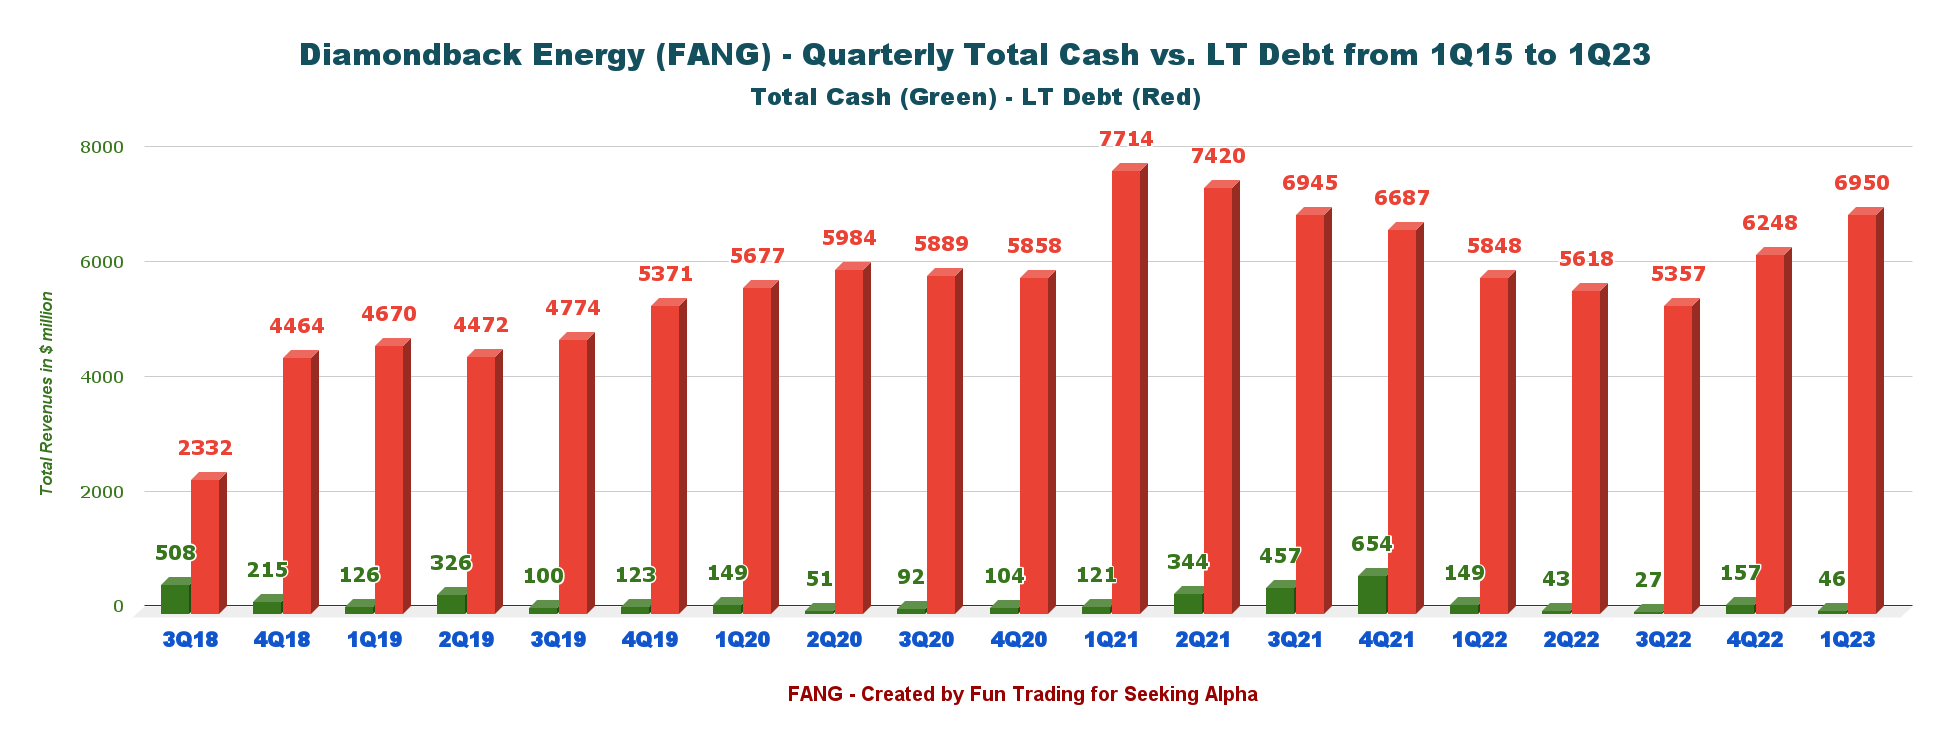
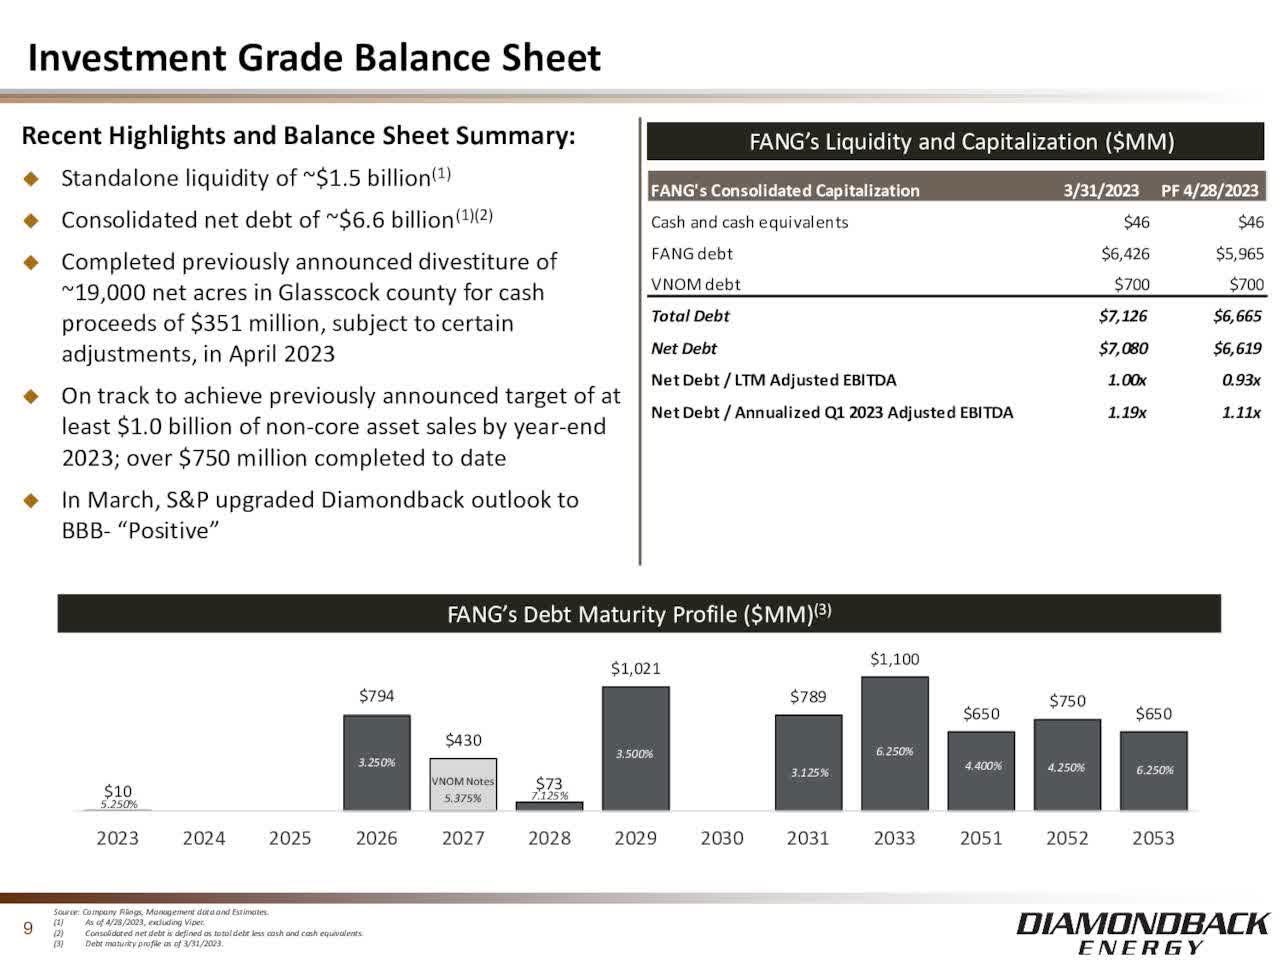
3 - Consolidated Net debt is $6.26 billion in 1Q23 (incl. subsidiaries). Standalone liquidity is ~1.7 billion.
FANG Quarterly Cash versus Debt History (Fun Trading)
FANG's total debt, excluding its subsidiary VNOM, is $5,837 million. Details are shown below:
FANG Balance Sheet (FANG Presentation)
4 - Quarterly production was 425.022 Boep/ d in 1Q23
FANG Quarterly Oil Equivalent Production History (Fun Trading)
Production for 1Q23 was 425.022K Boep/d, up 11.4% sequentially and up from 381.38K Boep/d the same quarter a year ago (see chart above).
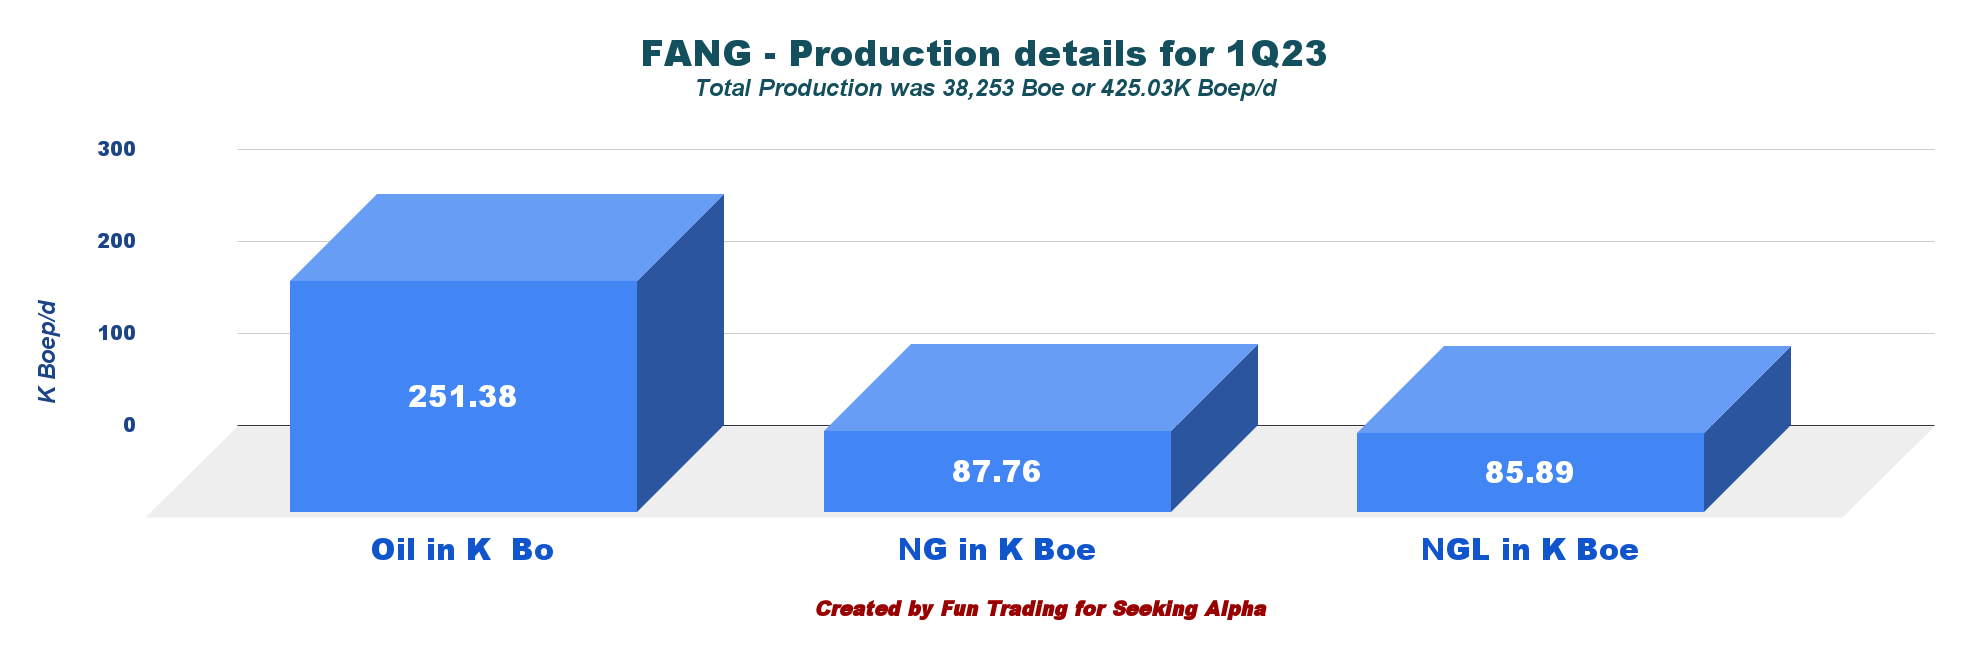
The percentage of oil is 59.2% in 1Q23. Below is the chart repartition between oil, NG, and NGL.
FANG 1Q23 Production detail Oil, NG, NGL (Fun Trading)
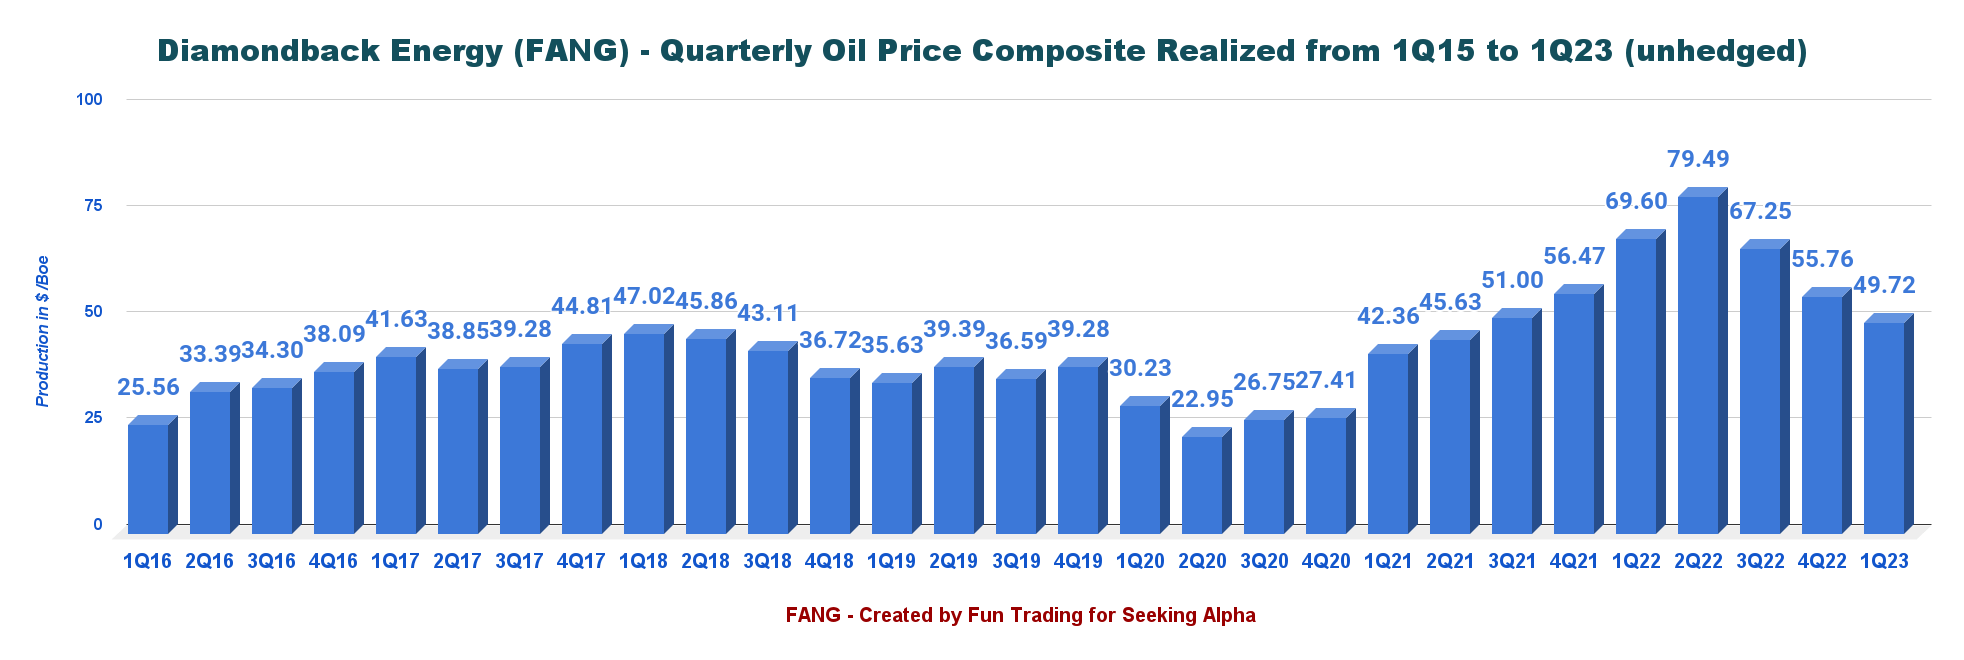
The average oil composite in 1Q23 (unhedged) was $49.72 per Boe , down slightly from $69.60 a year-ago quarter and down 28.6% sequentially.
FANG Quarterly Liquid Price History (Fun Trading)
During the first quarter, the average realized oil price was $73.11 per barrel , and realized natural gas prices were $1.46 per thousand cubic feet (MMcf) from $3.61 in the year-ago period.
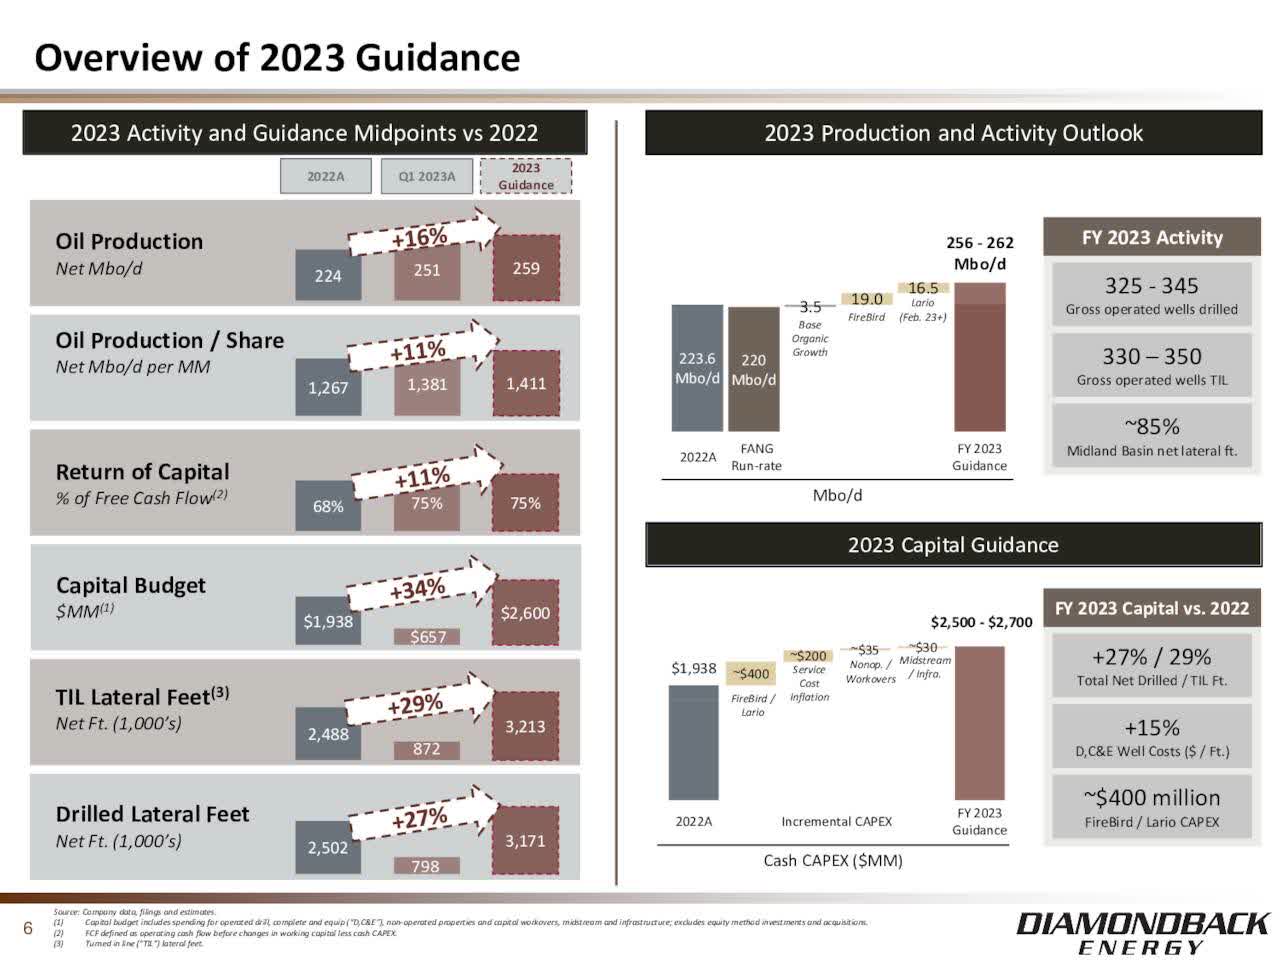
5 - 2023 Guidance - Production expected to be 430K - 440K Boep/d with CapEx between $2.5 billion and $2.7 billion.
FANG 2023 Guidance (FANG Presentation)
- Full-year 2023 oil production guidance of 256 - 262 Mbop/d (430 - 440 MBoep/d).
- Full-year 2023 cash CapEx guidance of $2.5 - $2.7 billion.
- The Company expects to drill between 325 and 345 gross (293 - 311 net) wells and complete between 330 and 350 gross (297 - 315 net) wells with an average lateral length of approximately 10,500 feet in 2023.
- 1Q23 oil production guidance of 248 - 252 MBO/d (415 - 422 MBOE/d) and 1Q23 cash CapEx guidance of $625 - $675 million.
Technical Analysis (Short Term) and Commentary
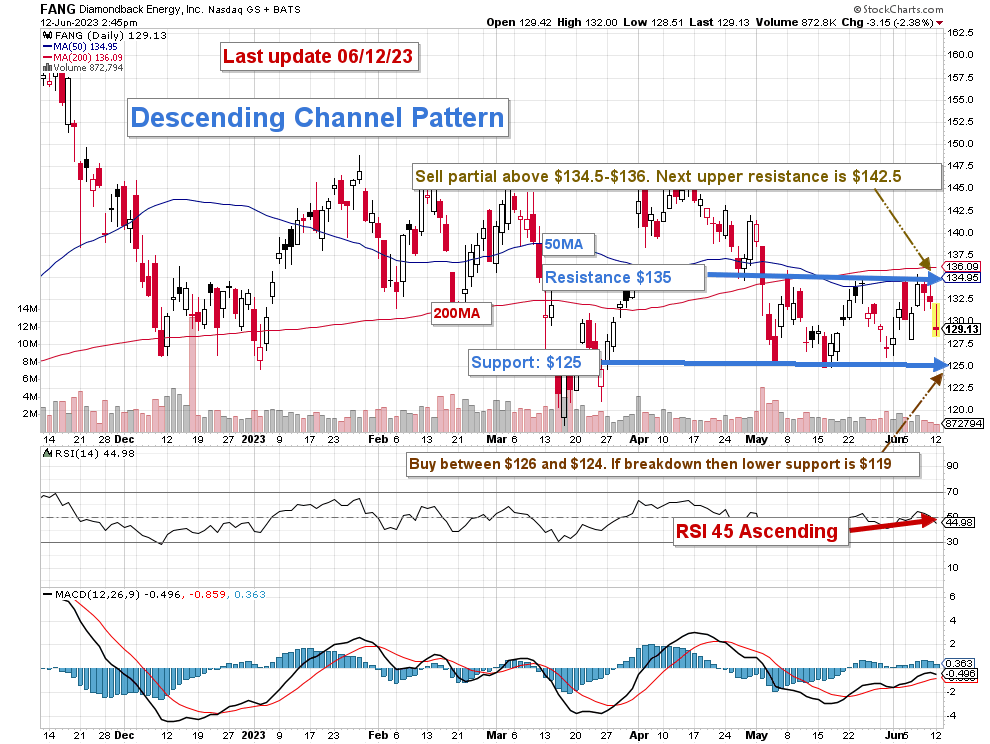
FANG TA Chart Short-Term (Fun Trading StockCharts) Note: The chart has been adjusted for dividends.
FANG forms a descending channel pattern with resistance at $135 and support at $125. RSI is now 45, implying that FANG could retest support within a week.
The trend of oil and NG prices is essential before selecting a definitive strategy. Oil and Gas prices have retraced significantly in 1Q23, and the subsequent earnings results show weakness and reduced cash flow generation, dramatically affecting the dividend payment. Notably, the Natural gas price in the USA has collapsed this quarter and represents 21% of the total output for Diamondback Energy.
FANG 1-Year Chart Brent NG prices (Fun Trading StockCharts)
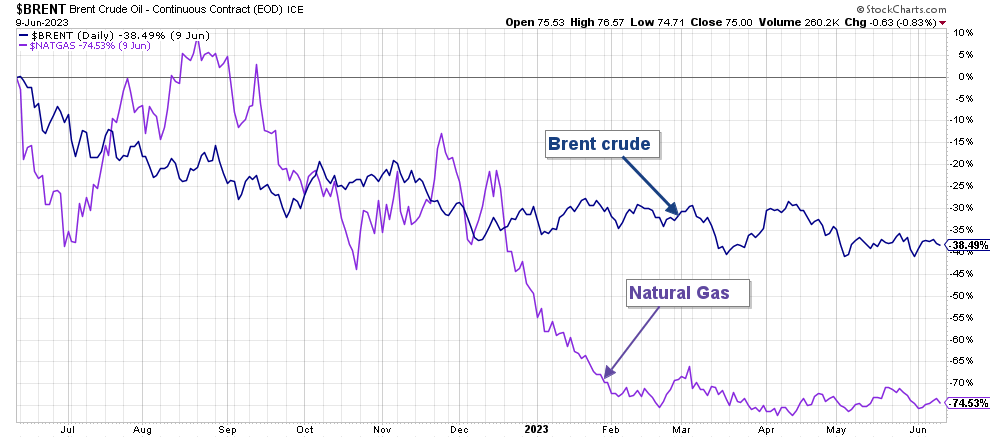
Thus, I raise the short-term trading strategy to trade LIFO to 50% of your position and keep your long-term core holding for a much higher payday or as a good source of steady income, which has dropped significantly.
I suggest selling between $134.5 and $136 with possible higher resistance at $142.5 and waiting for a retracement between $126 and $124 with potential lower support at $118.
Warning: The TA chart must be updated frequently to be relevant. It is what I am doing in my stock tracker. The chart above has a possible validity of about a week. Remember, the TA chart is a tool only to help you adopt the right strategy. It is not a way to foresee the future. No one and nothing can.
For further details see:
Diamondback Energy: Good Company In A Weak Environment