VNOM - Diamondback Energy: Tough Year Ahead
2023-03-20 16:40:24 ET
Summary
- The company reported the fourth quarter of 2022 earnings of $5.62 per share. This compares to $5.54 per share in 4Q21.
- The company is still solid with excellent growth prospects, but the economy is weakening, and oil and gas prices are struggling again.
- I recommend buying FANG between $121.5 and $119.5 with potential lower support at $115.
Introduction
Midland, Texas-based Diamondback Energy, Inc. ( FANG ) released its fourth-quarter and full-year 2022 on February 21, 2023.
Note: This article is an update of my article published on November 15, 2022.
1 - 4Q22 and Full-year 2022 results snapshot
The company reported the fourth quarter of 2022 earnings of $5.62 per share. This compares to $5.54 per share in 4Q21.
This quarter's oil-equivalent production was 391.4K Boep/d at a composite oil price of $55.76 per Boe compared with $56.47 a year ago. Oil production was 226.1K Bop/d.
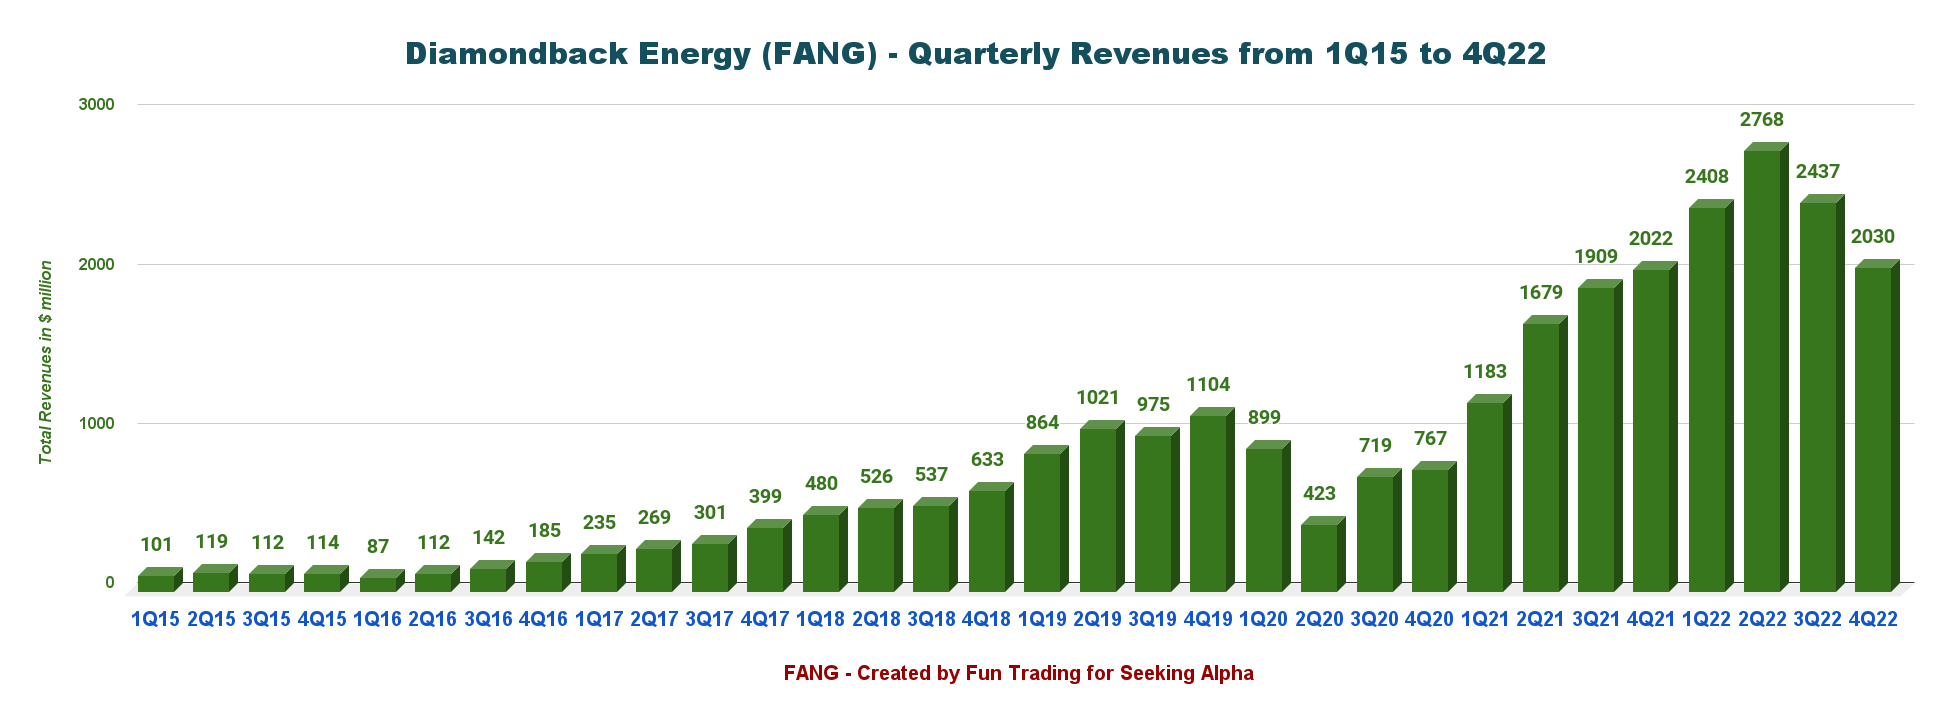
This quarter's revenues were $2.03 billion, up 0.4% from the year-ago quarter's sales of $2,022 billion. Commodity prices have cooled off significantly from the preceding quarter.
Diamondback declared a variable cash dividend of $2.15 per share, representing a total base-plus-variable dividend of $2.95 per share in 4Q22.
Finally, Diamondback Energy closed the previously announced acquisition of all leasehold interests and related assets of FireBird Energy LLC on November 30, 2022, and the previously announced acquisition of all leasehold interest and associated assets of Lario Permian, LLC, a wholly owned subsidiary of Lario Oil & Gas Company, and some related sellers, on January 31, 2023.
Travis Stice, the CEO, said in the conference call:
We successfully executed on our capital program, accelerated our return of capital plan and generated record cash flow. I'm very proud of all that we were able to accomplish and look forward to what I believe will be another strong year for the company. Looking back at last year, we produced over 223,000 barrels of oil per day, exceeding our production expectations.
2 - Investment Thesis
The investment thesis for FANG is turning bearish in 2023 due to an elevated risk of recession accentuated by the recent bank crisis. The company is still solid with excellent growth prospects, but the economy is weakening, and oil and gas prices are struggling again.
Oil and gas prices have dropped significantly, and while it is not showing in the balance sheet yet, it will be a definitive drag on revenues and free cash flow for the next couple of quarters, even if the company has a solid hedging scheme in place. (See press release page 11).
Natural gas, for instance, has dropped well below $2.50 per Mmcf or down over 40% on a one-year basis. Thus, while I recommend a long-term investment in this industry, it is time to take some profit off and build a cash position for a possible retreat later this year, which has already started.
Thus, trading LIFO using a combination of technical and fundamental analysis is the only viable strategy that can provide a decent long-term reward while reducing the risks.
It allows you to profit from the short-term swings and increase your leverage during unfavorable or unexpected turnarounds that can last longer than expected. This dual strategy is what I am recommending and constitutes the backbone of my Gold and Oil marketplace.
This two-level strategy has prevailed in my marketplace, "The Gold and Oil Corner," and I believe it is the most rewarding strategy in those circumstances.
3 - Stock Performance
Diamondback Energy owns one subsidiary after acquiring Rattler Midstream. The subsidiary is Viper Energy Partners ( VNOM ), which trades separately with similar results.
Diamondback Energy's performance over a one-year turned into a rout in February 2023, with a drop of 8% on a one-year basis.
Diamondback Energy - 4Q22 Quarterly Financial History: The Raw Numbers
| Diamondback FANG |
| 4Q21 |
| 1Q22 |
| 2Q22 |
| 3Q22 |
| 4Q22 |
| Total Revenues and others in $ Million |
| 2,022 |
| 2,408 |
| 2,768 |
| 2,437 |
| 2,030 |
| Net income in $ Million |
| 1,002 |
| 779 |
| 1,416 |
| 1,184 |
| 1,007 |
| EBITDA $ Million |
| 1,681 |
| 1,372 |
| 2,225 |
| 1,929 |
| 1,690 |
| EPS diluted in $/share |
| 5.54 |
| 4.36 |
| 7.93 |
| 6.72 |
| 5.62 |
| Operating cash flow in $ Million |
| 1,167 |
| 1,252 |
| 1,707 |
| 1,925 |
| 1,441 |
| CapEx in $ Million |
| 808 |
| 733 |
| 553 |
| 739 |
| 1,480 |
| Free Cash Flow in $ Million |
| 359 |
| 519 |
| 1,154 |
| 1,186 |
| -39 |
| Cash and cash equivalent $ Million |
| 654 |
| 149 |
| 43 |
| 27 |
| 157 |
| Total debt in $ Million |
| 6,687 |
| 5.848 |
| 5.456 |
| 5,357 |
| 6,248 |
| Dividend per share in $ |
| 0.60 |
| 3.05 |
| 3.05 |
| 2.26 |
| 2.95 |
| Shares outstanding (diluted) in Million |
| 180.18 |
| 178.56 |
| 176.88 |
| 174.41 |
| 177.65 |
| Oil Production |
| 4Q21 |
| 1Q22 |
| 2Q22 |
| 3Q22 |
| 4Q22 |
| Oil Equivalent Production in K Boepd |
| 387.07 |
| 381.38 |
| 380.45 |
| 390.63 |
| 391.40 |
| Oil Composite realized price ($/Boe)/Hedge |
| 56.47/ 45.30 |
| 69.60/ 61.30 |
| 79.49/ 70.65 |
| 67.25/ 64.67 |
| 55.76 /55.01 |
| OIL % |
| 59% |
| 58% |
| 58% |
| 57% |
| 58% |
| Oil in Bo |
| 20,819 |
| 20,055 |
| 20,120 |
| 20,638 |
| 20,803 |
| NG in Mcf |
| 45,220 |
| 42,645 |
| 42,912 |
| 45,799 |
| 45,020 |
| NGL in Boe |
| 7,254 |
| 7,161 |
| 7,349 |
| 7,667 |
| 7,703 |
| Total in Boe |
| 35,610 |
| 34,324 |
| 34,621 |
| 35,938 |
| 36,009 |
Source: Diamondback Energy press release
Analysis: Revenues, Free Cash Flow, Net Debt, and Oil & Gas Production
1 - Quarterly revenues and others were $2,030 million in 4Q22
FANG Quarterly Revenues history (Fun Trading) Note: Oil revenues were $2,008 million, not including other operating income. FANG announced the fourth quarter of 2022 results on February 21, 2023. The quarter's revenues were $2,030 million, with a net income of $1,007 million or $5.62 per diluted share. The adjusted net income was $948 million, or $5.29 per diluted share. Fourth quarter 2022 Consolidated Adjusted EBITDA was $1.64 billion. Diamondback's cash operating costs for the fourth quarter of 2022 were $10.16 per BOE, including:
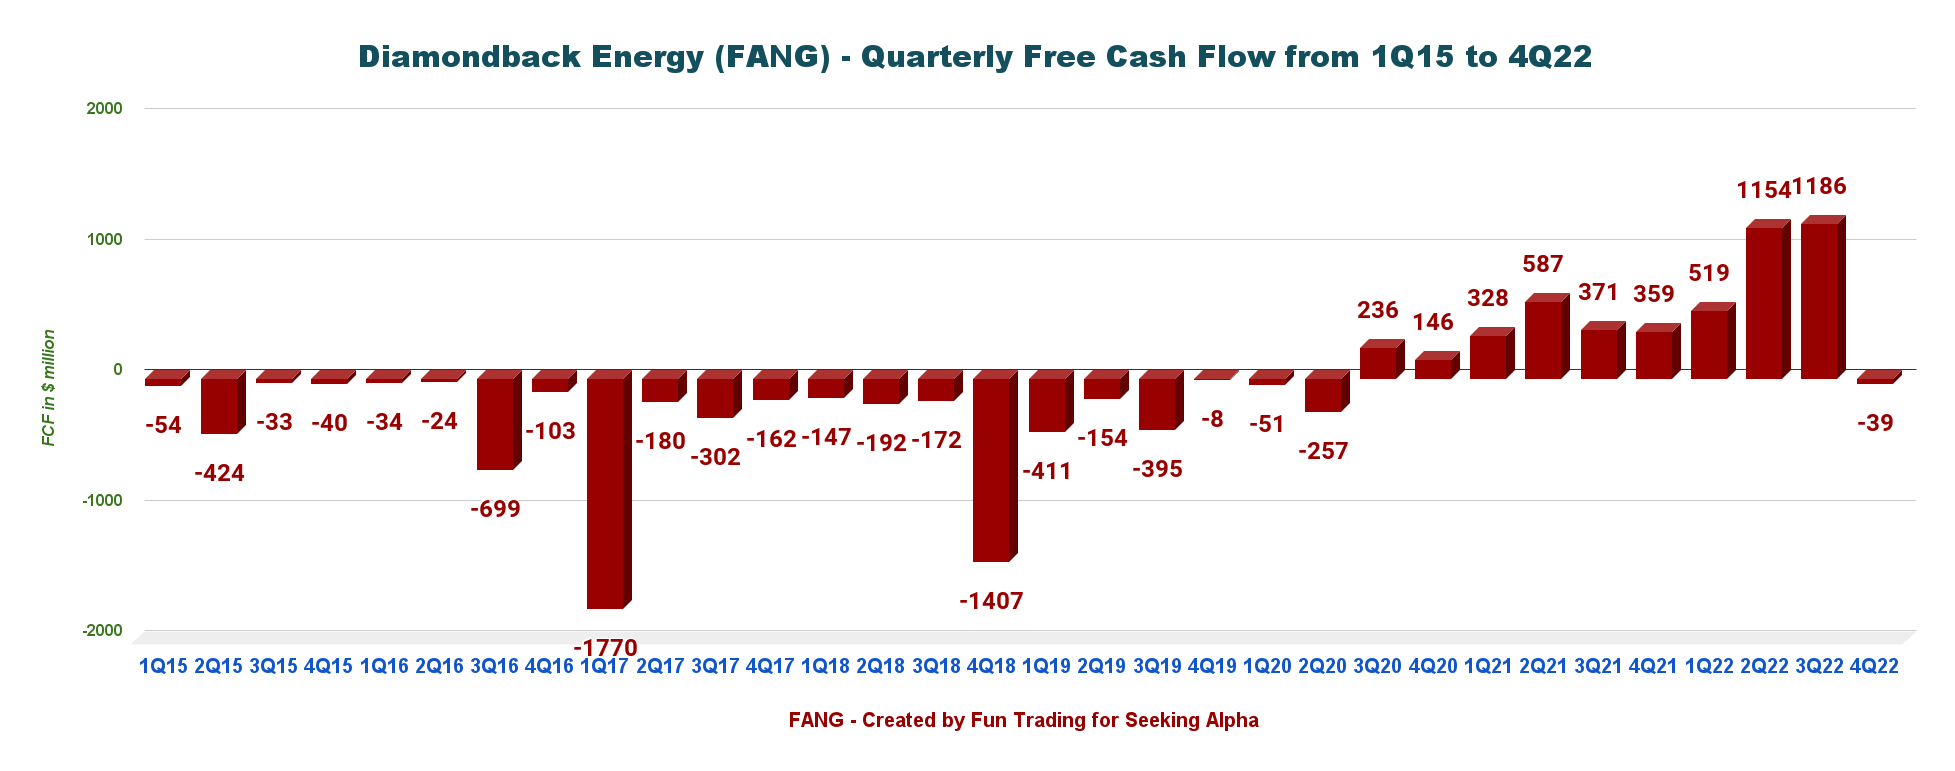
2 - Generic free cash flow was a loss of $39 million in 4Q22
FANG Quarterly Free cash flow history (Fun Trading)
Operating cash flow is $1,441 million, and CapEx is $1,480 million.
Trailing 12-month free cash flow is now $2,82 million, with the fourth quarter's free cash flow at a loss of $39 million.
FANG declared a 4Q22 base cash dividend of $0.80 per share and a cash dividend of $2.15. It is a total base-plus-variable dividend of $2.95 per share for 4Q22.
Also, FANG repurchased 2,344,850 shares of common stock in 4Q22 for $316 million (at a weighted average price of $134.76/share).
Finally, free cash flow was negative due to a high CapEx this quarter after the acquisition of FireBird.
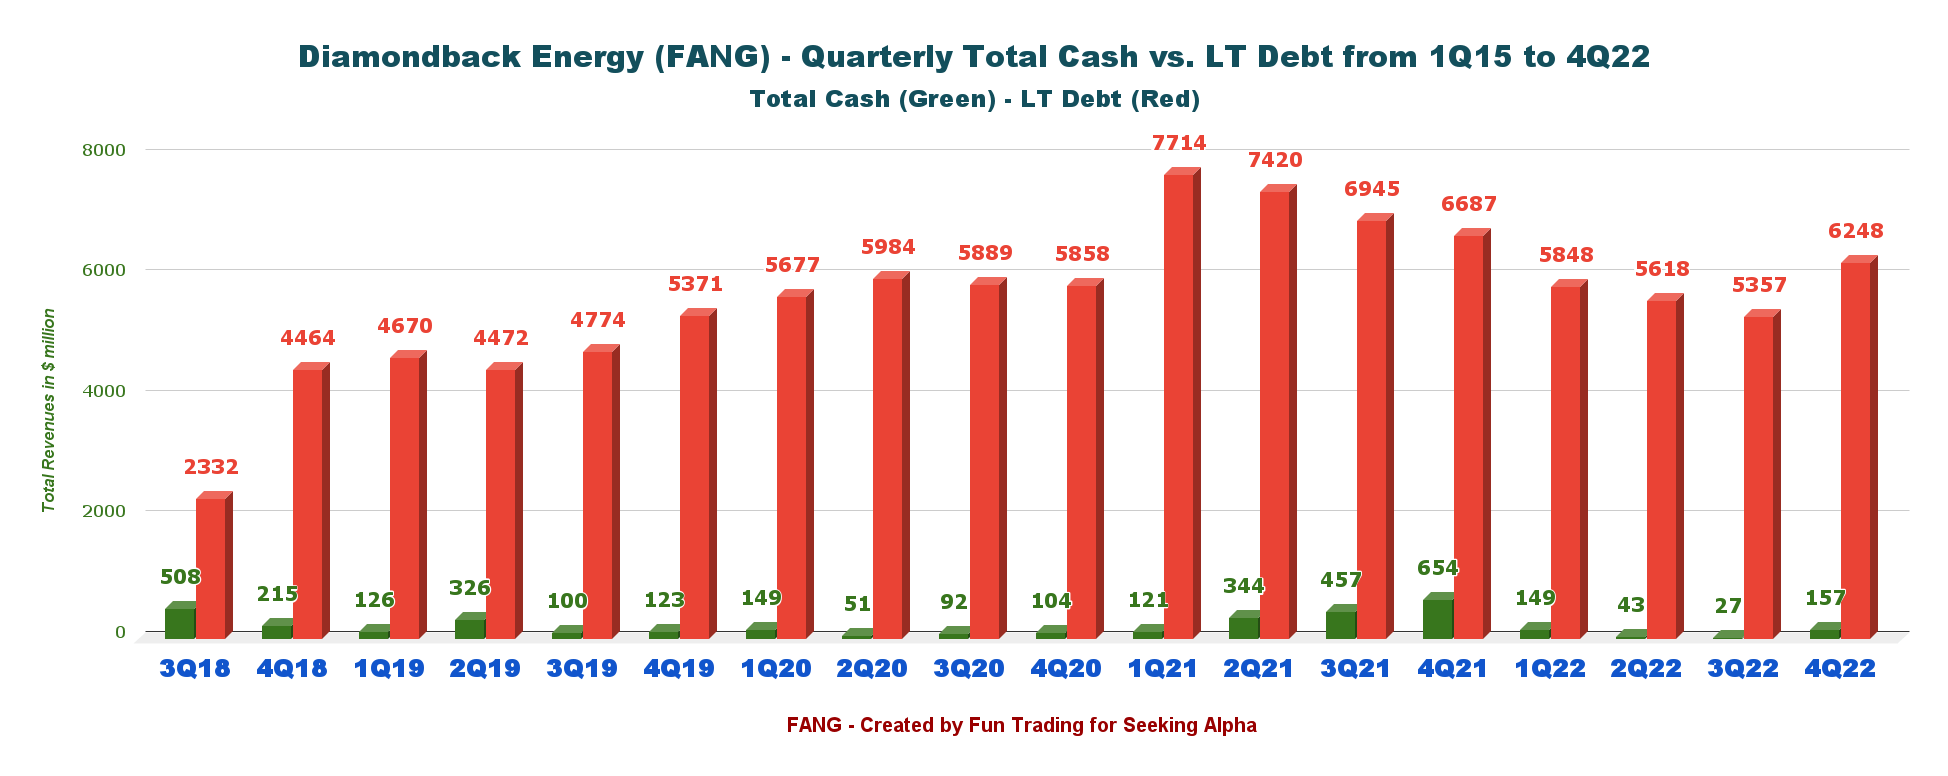
3 - Consolidated Net debt is $6.26 billion in 4Q22 (incl. subsidiaries).
FANG Quarterly Cash versus Debt history (Fun Trading)
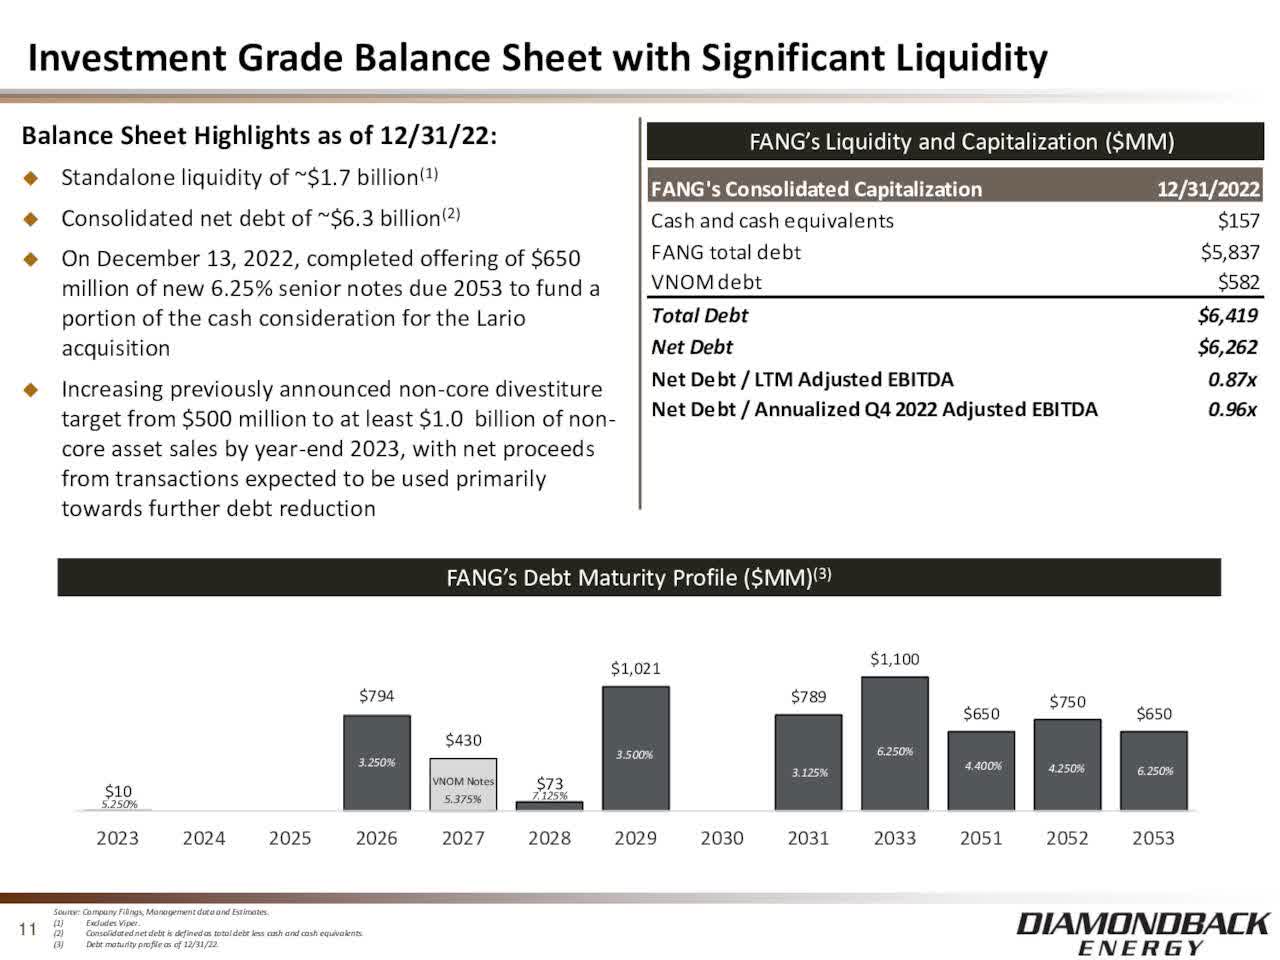
FANG's total debt, excluding its subsidiary VNOM, is $5,837 million. Details are shown below:
FANG Balance sheet Presentation (FANG Presentation)
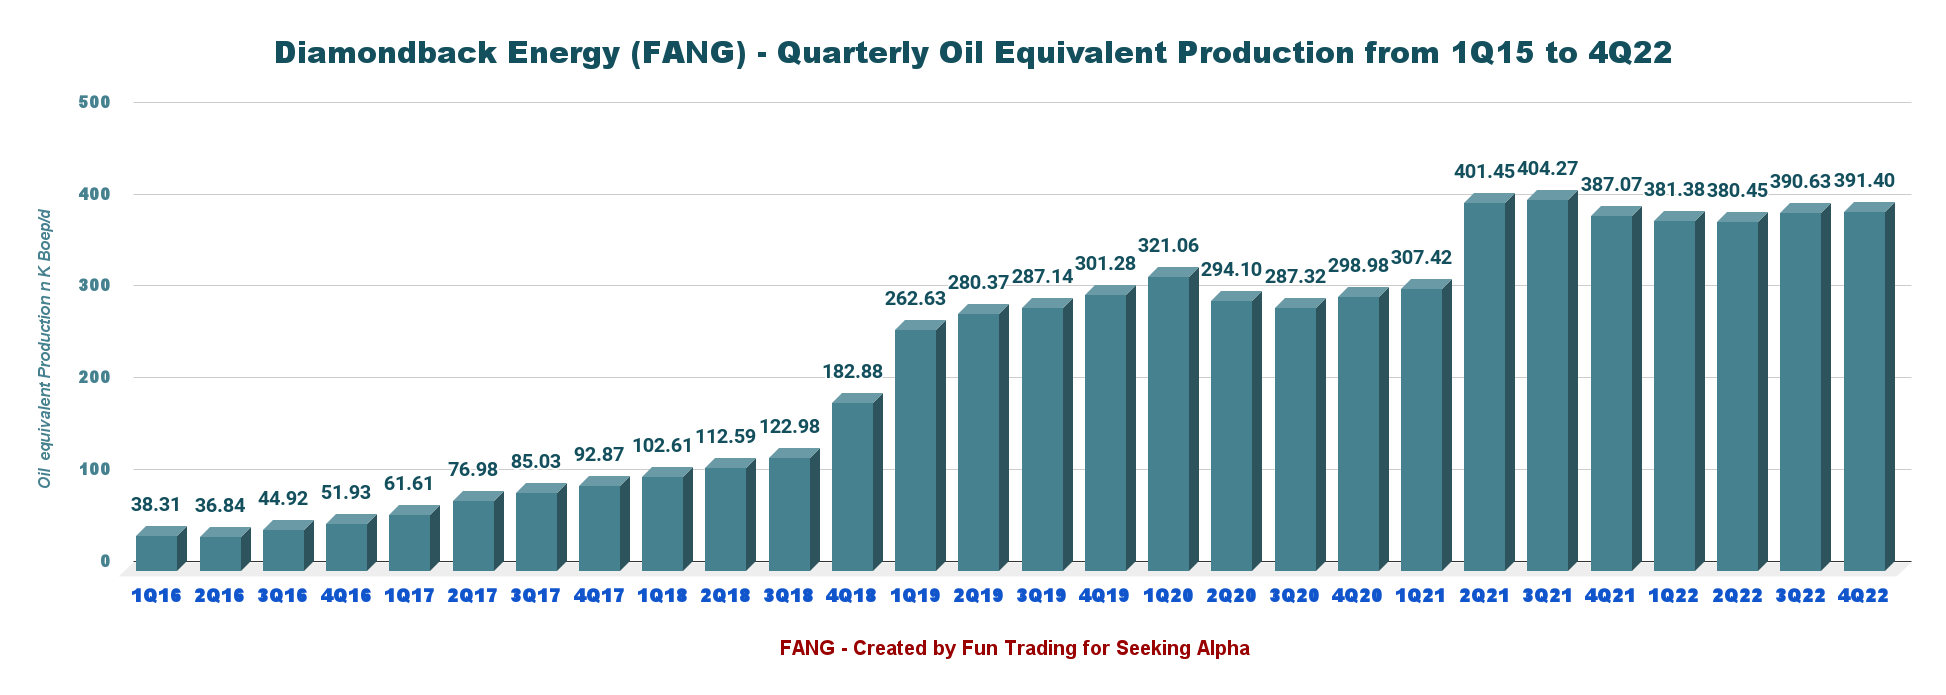
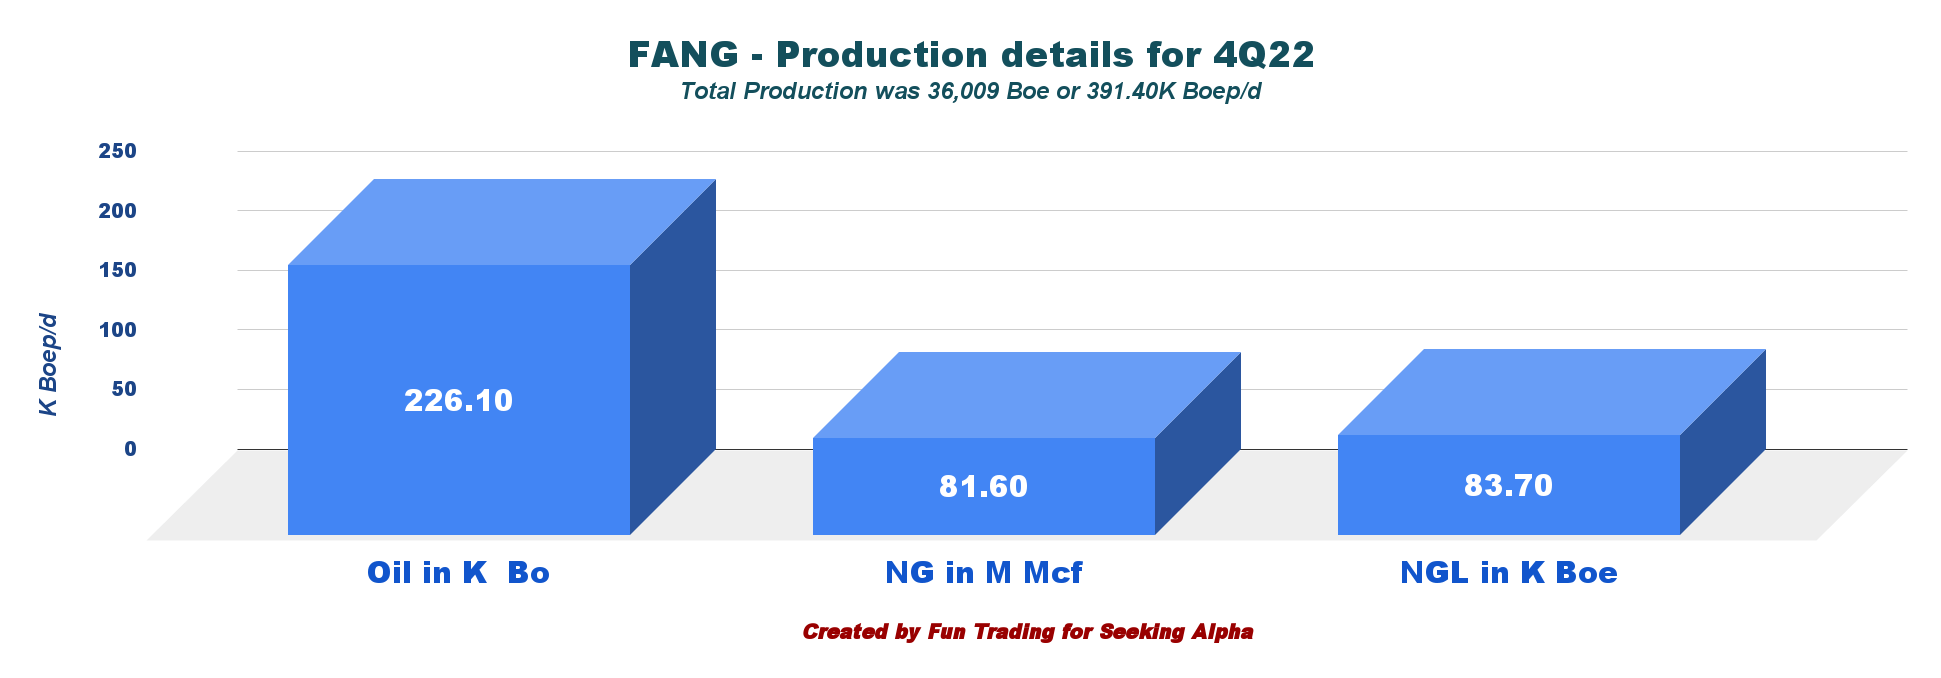
4 - Quarterly production was 391.40 Boep/ d in 4Q22
FANG Quarterly Oil equivalent history (Fun Trading)
Production for 4Q22 was 390.40K Boep/d, up 0.2% sequentially and up from 387.07K Boep/d the same quarter a year ago (see chart above).
The percentage of oil is 57.8% in 4Q22. Below is the chart repartition between oil, NG, and NGL.
FANG Quarterly oil equivalent detail Oil, NG, NGL (Fun Trading)
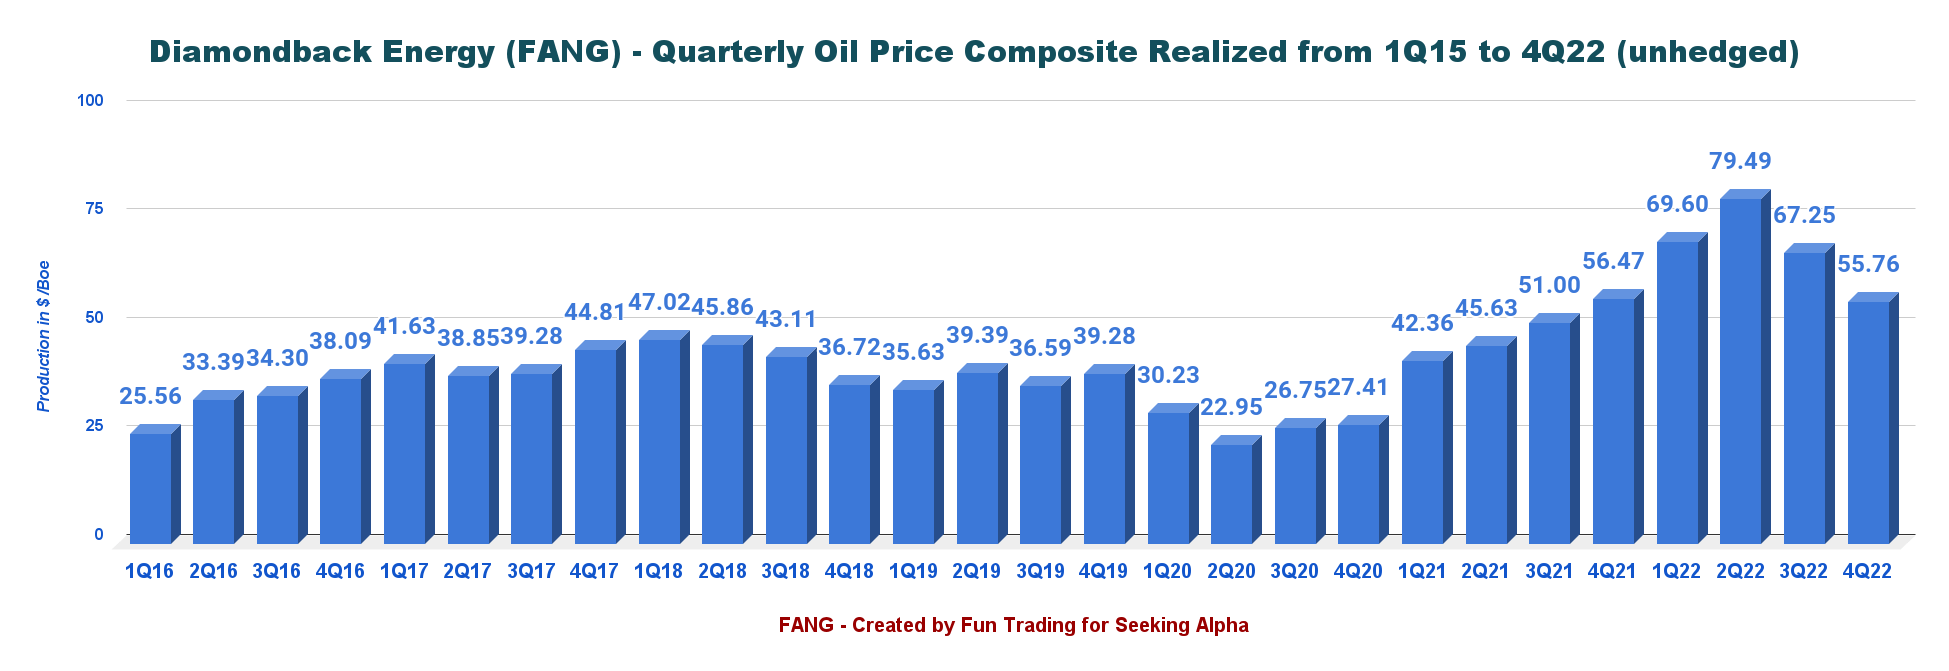
The average oil composite in 4Q22 (unhedged) was $55.76 per Boe, down slightly from $56.47 a year-ago quarter and down 17.1% sequentially.
FANG Quarterly Oil composite price history (Fun Trading)
During the fourth quarter, the average realized oil price was $80.37, and realized natural gas prices were $3.20 per thousand cubic feet (MMcf) from $4.56 in the year-ago period.
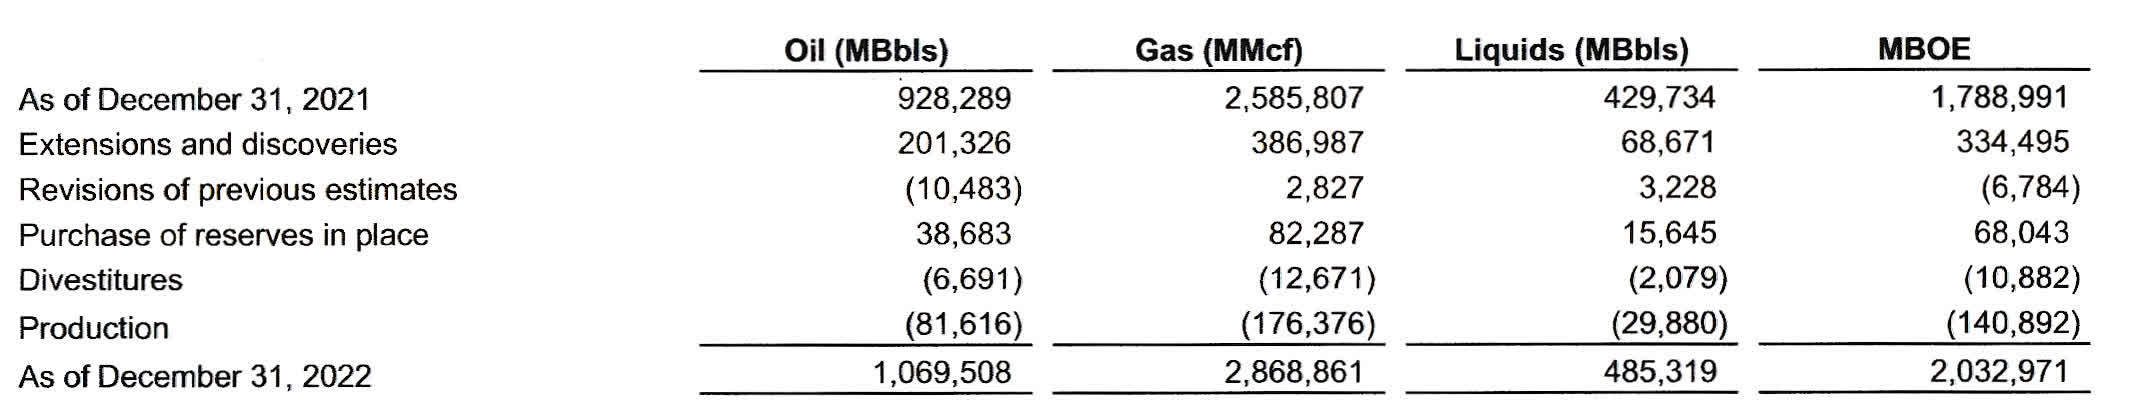
FY22 proved reserves increased 14% YoY to 2,033 MMBoe with 53% oil, 23% NG, and 24% NGL.
FANG new Reserve as of December 2022. (FANG Press release)
5 - 2023 Guidance - Production expected to be 430K - 440K Boep/d with CapEx between $2.5 billion and $2.7 billion.
FANG 2023 Guidance (FANG Presentation)
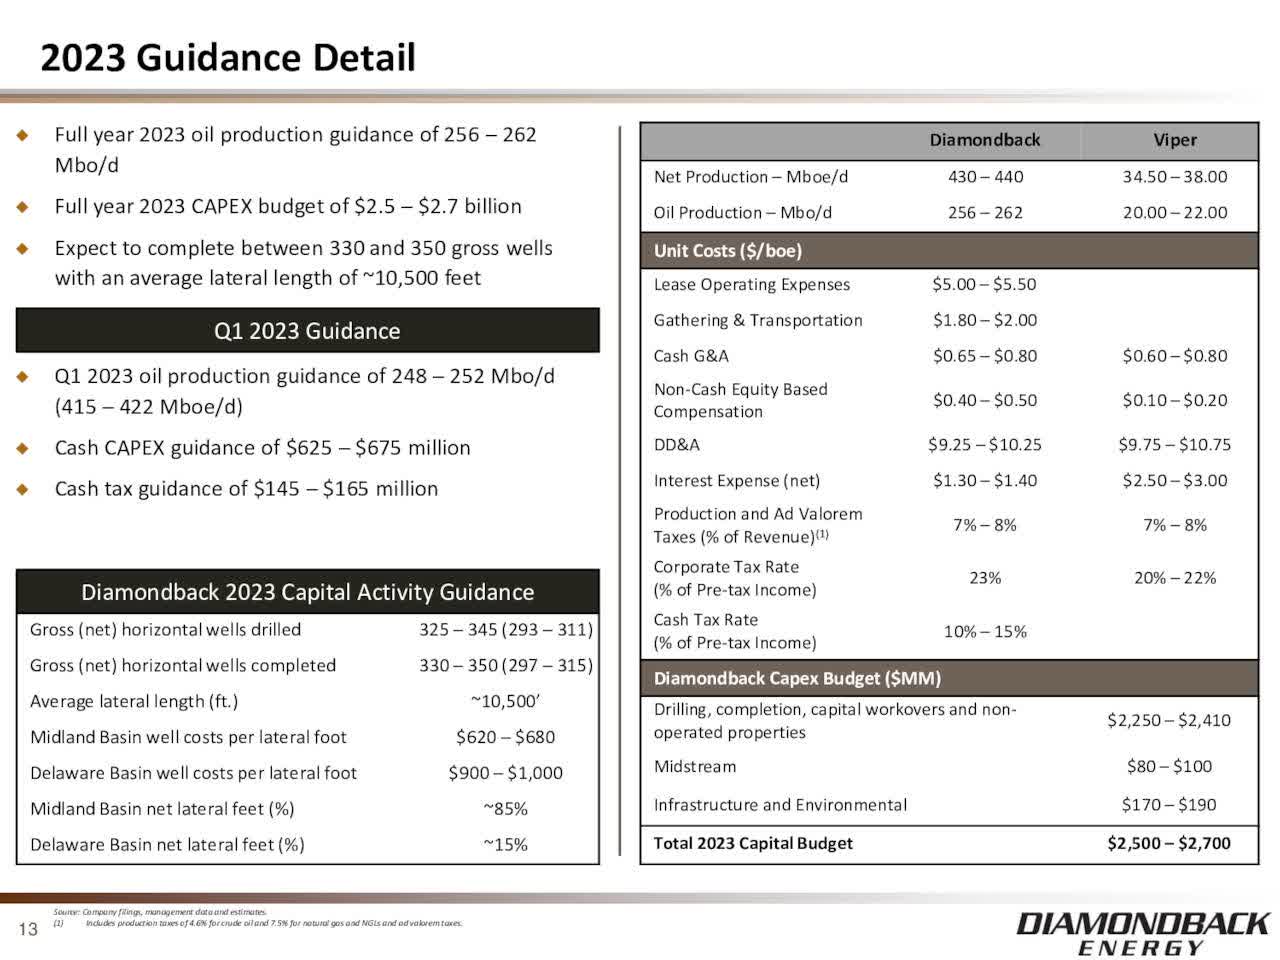
- Full-year 2023 oil production guidance of 256 - 262 Mbop/d (430 - 440 MBoep/d).
- Full-year 2023 cash CapEx guidance of $2.5 - $2.7 billion.
- The Company expects to drill between 325 and 345 gross (293 - 311 net) wells and complete between 330 and 350 gross (297 - 315 net) wells with an average lateral length of approximately 10,500 feet in 2023.
- 1Q23 oil production guidance of 248 - 252 MBO/d (415 - 422 MBOE/d) and 1Q23 cash CapEx guidance of $625 - $675 million.
Technical Analysis (Short Term) and Commentary
FANG TA Chart short-term (Fun Trading StockCharts) Note: The chart has been adjusted for dividends.
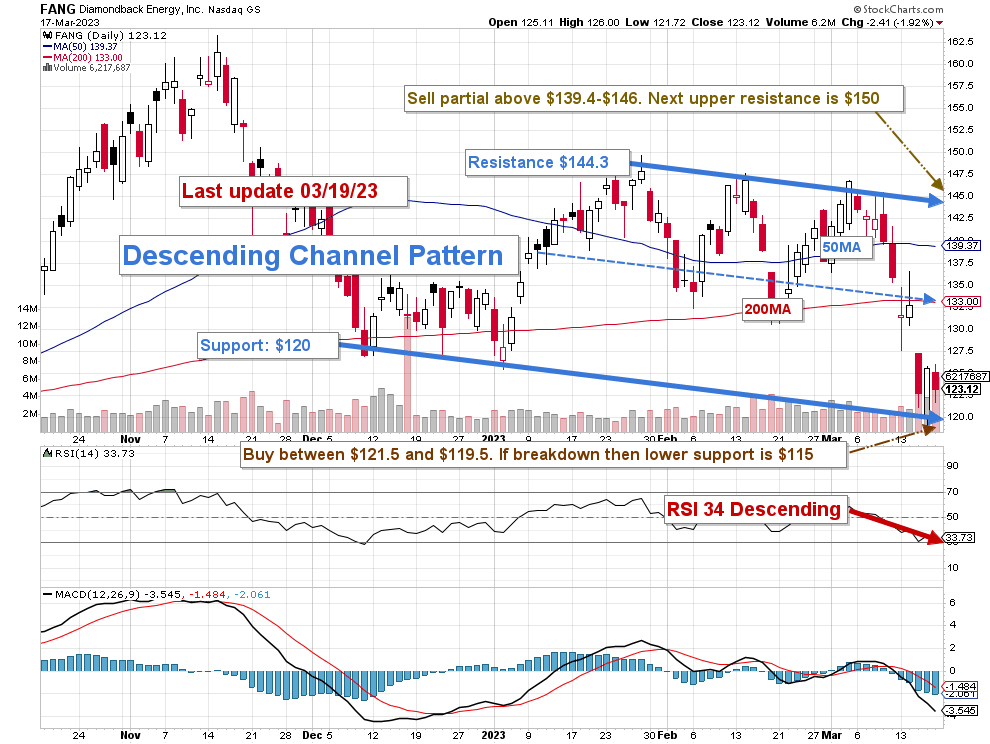
FANG forms a descending channel pattern with resistance at $144.3 and support at $120. RSI is now 34 and is oversold.
The Descending Channel Pattern is a short-term bearish continuation pattern. The price movement is contained within two parallel descending trend lines. The price moves lower while bouncing off upper and lower down-trending lines.
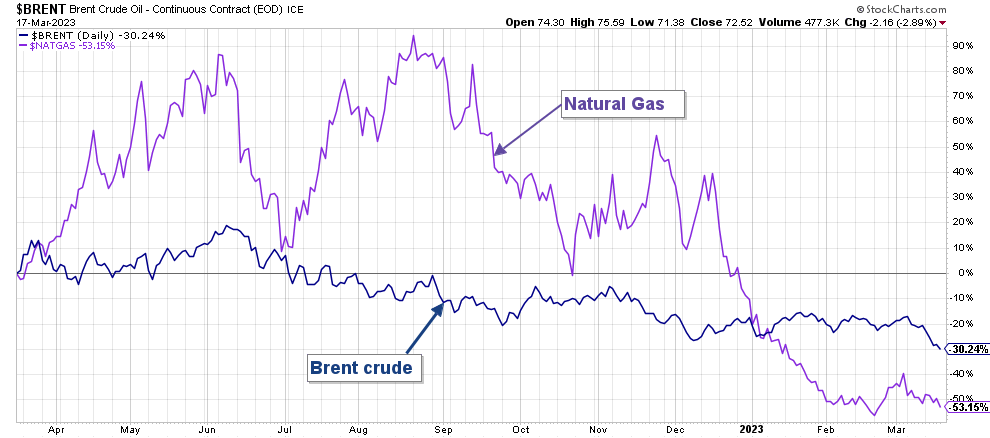
Considering the oil prices trend is essential before coming to a definitive strategy here. Oil and Gas prices have retraced significantly in 1Q23, and the subsequent earnings results could send the stock price to new lows.
If we look at oil and natural gas prices, we can see a massive drop in the past few months.
FANG 1-Year Chart Brent and NG prices (Fun Trading StockCharts)
Thus, the short-term trading strategy is to trade LIFO about 30% of your position and keep your long-term core holding for a much higher payday or as a good source of steady income.
I suggest selling between $139 and $146 with possible higher resistance at $150 and waiting for a retracement between $121.5 and $119.5 with potential lower support at $115.
Warning: The TA chart must be updated frequently to be relevant. It is what I am doing in my stock tracker. The chart above has a possible validity of about a week. Remember, the TA chart is a tool only to help you adopt the right strategy. It is not a way to foresee the future. No one and nothing can.
For further details see:
Diamondback Energy: Tough Year Ahead