VSTO - DICK'S Sporting Goods: An Industry Leader That's Returning To Normalcy
- After an explosive couple of years, DICK'S Sporting Goods is showing signs of returning to more normal results.
- If current guidance holds, DKS shares still look affordable, even though they are toward the pricey end relative to competitors.
- As an industry leader, however, DICK's Sporting Goods stock may still well be worth consideration at current prices.
Perhaps no company is as well known in the sporting goods retail space as DICK’S Sporting Goods ( DKS ). With a large retail footprint that includes 858 locations as of this writing and a burgeoning e-commerce market, this retailer is a giant in the sporting goods category. Although facing stiff competition from other players in this space, including those that are online, the firm has done incredibly well to grow both its top and bottom lines in recent years. Growth has been particularly strong from 2020 through today. More recent performance, however, indicates that we might be seeing some return to normalcy. But even basing the valuation of the company off of 2022 expected results, shares still do look cheap on an absolute basis even though they might be pricey relative to similar firms. Ultimately, I expect the future to be a bit less bullish than it has been in recent years, but I do still think that the company might be a good prospect for long-oriented investors who want an industry leader.
Shopping at DICK’S Sporting Goods
As I mentioned already, DICK’S Sporting Goods operates as an omnichannel sporting goods retailer. The company prides itself and offering a wide variety of products at its hallmark DICK’S Sporting Goods retail locations and online. However, the company does also have some other assets that are worth mentioning. For instance, it currently owns and operates Golf Galaxy, Field & Stream, Public Lands, and Going Going Gone! retail stores. Plus it has a pretty sizable e-commerce presence. In 2021, for instance, 21% of the company's revenue came from online channels.
For the most part, the products the company sells fall under the hardlines category. 44% of its sales, in fact, are under this umbrella. Products that are included in this category include sporting goods equipment, fitness equipment, golf equipment, hunting gear, and fishing gear. Apparel accounts for another 34% of sales, while footwear makes up an impressive 21%. The remaining 1% of revenue last year came from the ‘other’ category, which included non-merchandise sales categories like in-store services, shipping revenue, software subscription revenue, and credit card processing revenue.
Although the sporting goods space is notorious for being heavily concentrated across a few key brands, the company had only one serious supplier last year. It should come as no surprise that this supplier is NIKE ( NKE ), which accounted for 17% of the company's merchandise purchases. Beyond that, the company is truly diverse in its customer makeup, with the business acquiring merchandise from roughly 1,400 different vendors throughout the year. It distributes these goods through the five regional distribution centers that it operates, with over 90% of the merchandise that it ultimately sells flowing through these, while the remaining 10% comes directly to its stores from its vendors.
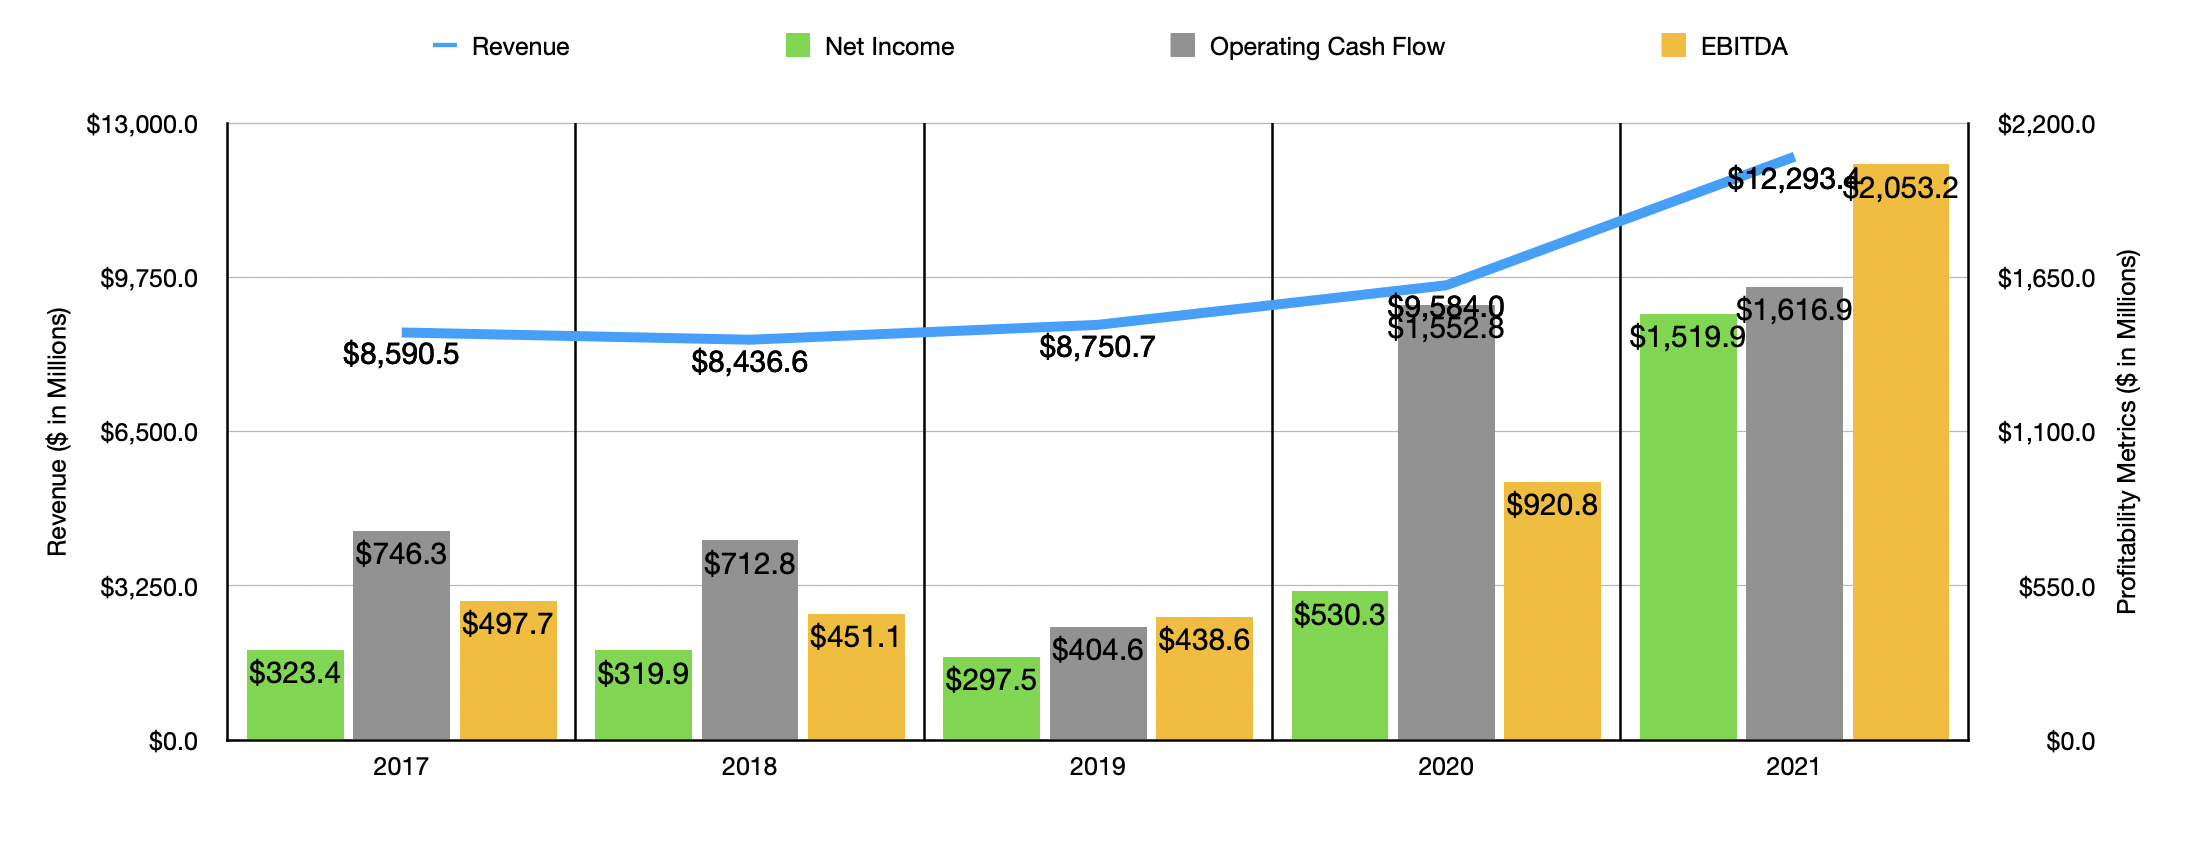
Over the past few years, growth at the company has been really impressive. Revenue rose from $8.59 billion in 2017 to $8.75 billion in 2019. In 2020, sales spiked to $9.58 billion before skyrocketing to $12.9 billion last year. Interestingly, this increase in revenue was not from an expansion in the number of stores in the company's network. Over this five-year window, the company's store count increased from 846 to 861. Instead, the rise was largely attributed to an increase in same-store sales. Between 2017 and 2019, aggregate comparable store sales grew by just 0.08%. But then, in 2020, this figure increased by 9.9% before jumping by 26.5% last year. According to management, this increase in comparable store sales from 2020 to 2021 was driven by two key factors. The largest was an 18.8% rise in the number of transactions, while the other was a 7.7% increase in sales per transaction. E-commerce sales were particularly strong, rising by 81% from 2019 through 2021, with that increase likely attributed to social distancing initiatives caused by the pandemic. After all, it's much safer to shop at home than it is to go into a store. Although this increase in revenue may seem odd, it makes sense when you consider that the greater social distancing and the temporary economic shutdown would have been conducive to people getting out more to engage in playful activities and exercise.
As revenue has risen, profitability has followed suit. Net income rose from $323.4 million in 2017 to $530.3 million in 2020 before jumping to $1.52 billion last year. This makes sense when you consider that the store count of the company has not risen all that much. In short, the company's fixed cost structure has remained mostly unchanged while the volume and pricing of products pushed through its stores and website increased markedly. This would have a major positive impact on margins. This can also be seen when looking at other profitability metrics. From 2017 through 2021, operating cash flow went from $746.3 million to $1.62 billion, while EBITDA soared from $451.1 million to $2.05 billion.
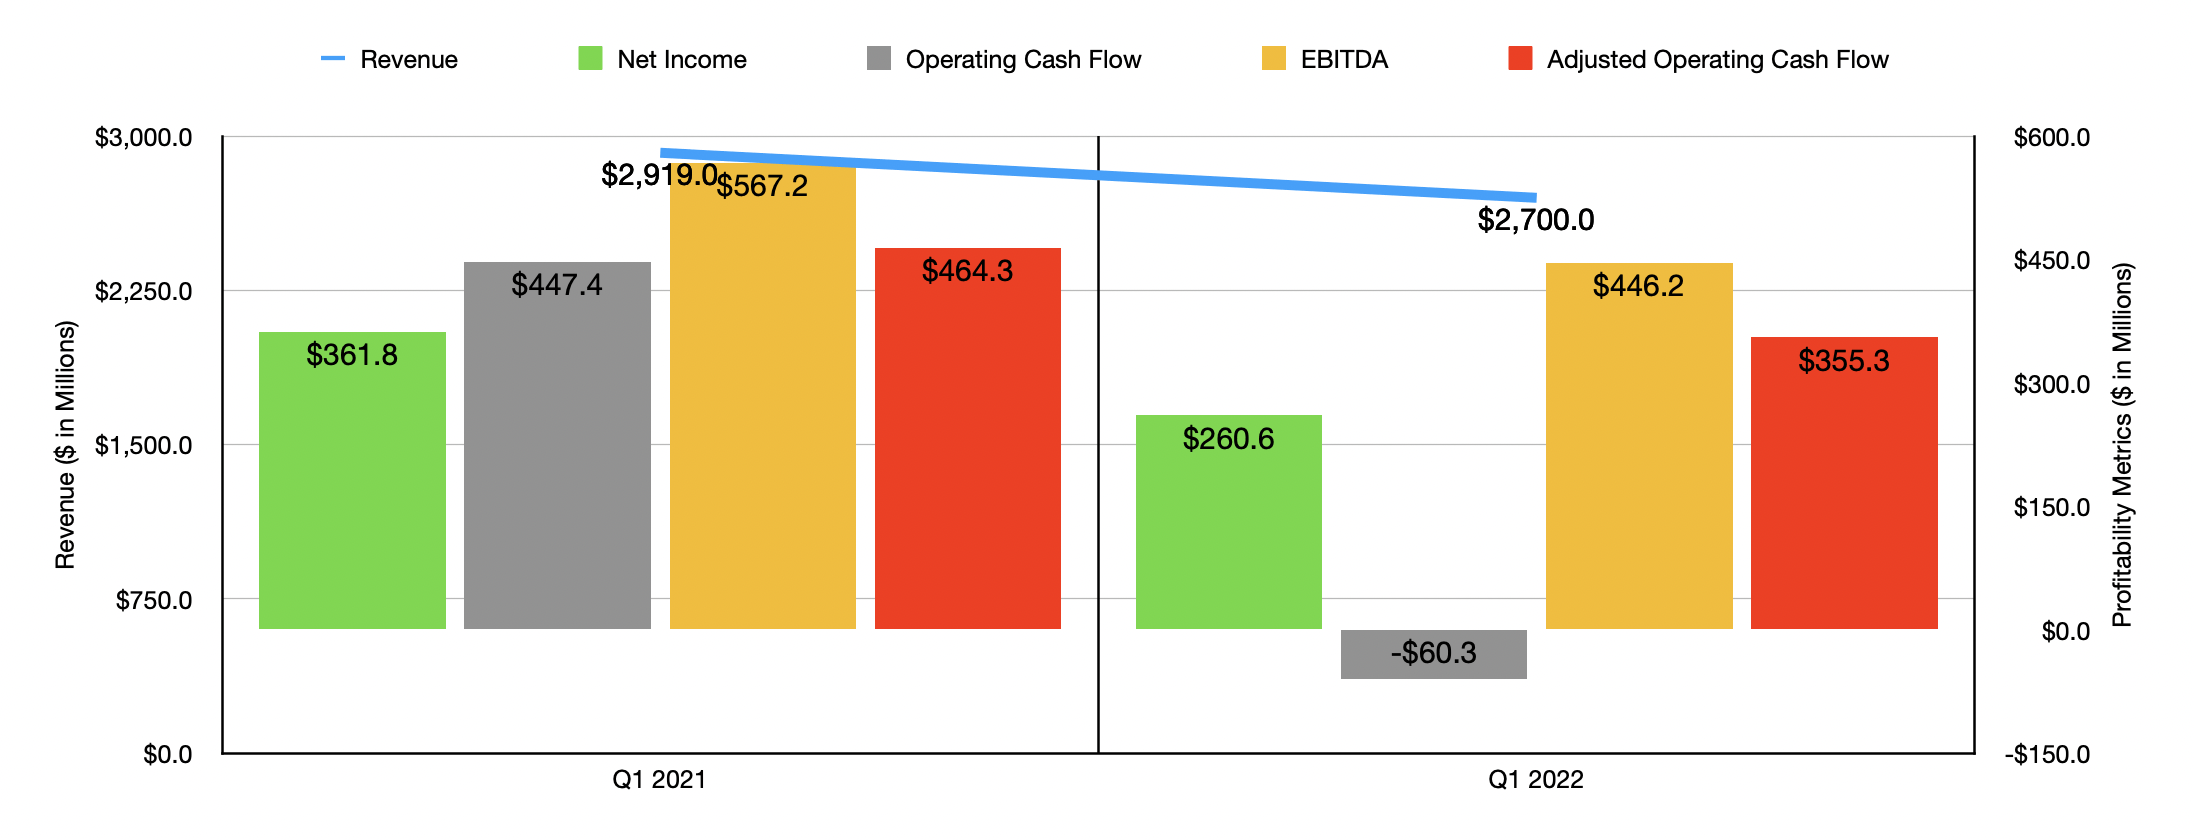
Now, when it comes to the 2022 fiscal year, management is less optimistic. During the first quarter of the year , for instance, total revenue came in at $2.70 billion. That's down from the $2.92 billion generated just one year earlier. Even though the company's store count increased from 855 to 858 during this timeframe, same-store sales dropped by 8.4%. Naturally, profitability also contracted. Net income dropped from $361.8 million to $260.6 million. Operating cash flow declined from $447.4 million to negative $60.3 million. Even if we were to adjust for changes in working capital, this metric would have declined from $464.3 million to $355.3 million. Meanwhile, EBITDA also worsened, dropping from $567.2 million to $446.2 million.
Management expects this weakness to continue for the rest of the current fiscal year. They currently anticipate same-store sales falling by between 2% and 8% year over year, which makes sense when you consider my explanation about the reason for the initial surge in revenue anyways. Earnings per share should come in at between $7.95 and $10.15. This translates to net income, at the midpoint, of $932.2 million and factors in $300 million worth of share repurchases. No guidance was given when it came to other profitability metrics. But if these change at the same rate that net income should, then we should anticipate adjusted operating cash flow of around $991.7 million and EBITDA of roughly $1.26 billion.
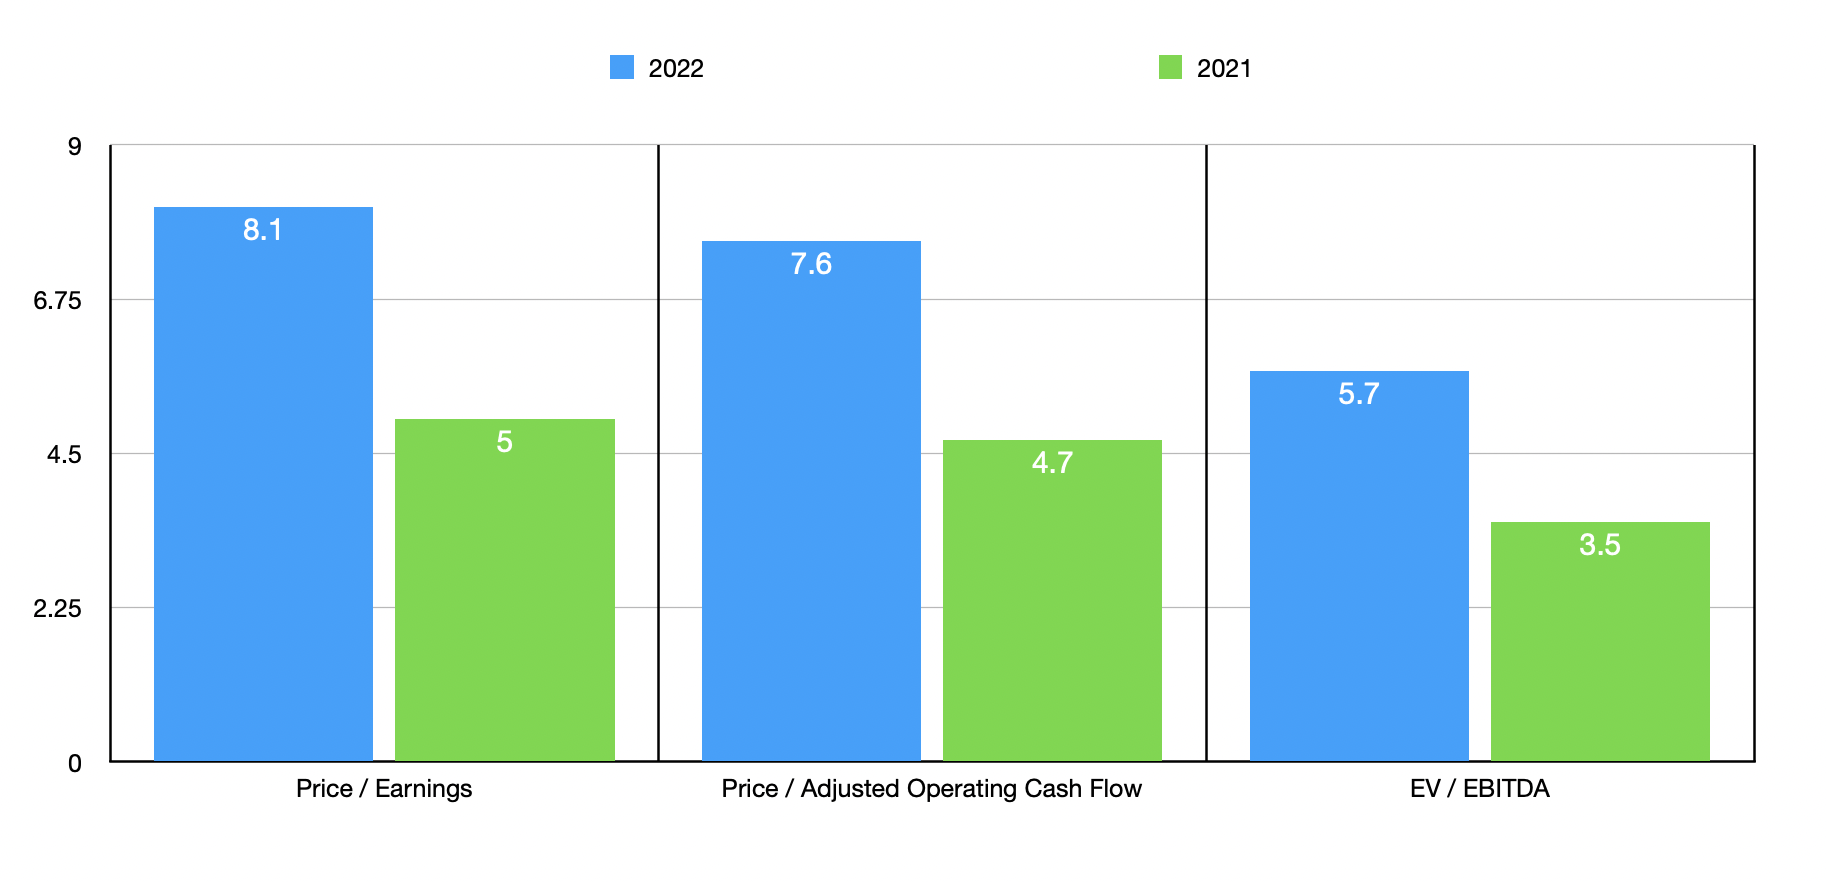
Taking this data, we can easily value the firm. On a forward basis, the firm is trading at a price-to-earnings multiple of 8.1. This is up from the 5 multiple that we get if we rely on 2021 figures. The price to adjusted operating cash flow multiple should be 7.6. That's higher than the 4.7 reading that we get if we use 2021 figures. Meanwhile, the EV to EBITDA multiple should rise from 3.5 last year to 5.7 this year. To put this all in perspective, I decided to compare the company to five similar firms. For context, I also valued them based on their forward multiples. On a price-to-earnings basis, these companies ranged from a low of 3.2 to a high of 14.7. And using the price to operating cash flow approach, the range was from 3.9 to 17.9. In both cases, four of the five firms were cheaper than DICK’S Sporting Goods. Meanwhile, using the EV to EBITDA approach, the range was from 3.4 to 6.7. In this scenario, three of the five businesses were cheaper than our prospect.
| Company |
| Price / Earnings |
| Price / Operating Cash Flow |
| EV / EBITDA |
| DICK'S Sporting Goods |
| 8.1 |
| 7.6 |
| 5.7 |
| Academy Sports and Outdoors ( ASO ) |
| 6.2 |
| 5.7 |
| 5.3 |
| Big 5 Sporting Goods ( BGFV ) |
| 3.2 |
| 5.7 |
| 5.8 |
| Hibbett ( HIBB ) |
| 4.8 |
| 3.9 |
| 4.2 |
| Vista Outdoor ( VSTO ) |
| 4.2 |
| 4.3 |
| 3.4 |
| Johnson Outdoors ( JOUT ) |
| 14.7 |
| 17.9 |
| 6.7 |
Takeaway
All things considered, DICK’S Sporting Goods has had a remarkable run these past couple of years. This year is slated to be weaker for the company and that should not be much of a surprise. Assuming the picture doesn't deteriorate more than what management anticipates, shares are still pretty cheap on an absolute basis even though they are slightly pricey relative to similar firms. This suggests that there might be better opportunities in this space for investors who like sporting goods. But for somebody who wants an industry leader that is stable and likely has a bright future, DICK’S Sporting Goods might be worth that relative premium.
For further details see:
DICK'S Sporting Goods: An Industry Leader That's Returning To Normalcy