DSTL - Distillate Capital Q2 2023 Letter To Investors
2023-07-14 09:15:00 ET
Summary
- Distillate Capital Partners LLC was formed in 2017 and is based in Chicago, IL. The firm is 100% employee-owned, and DCP’s partners each have invested significantly in the firm’s investment strategies.
- A strong rally moved market levels markedly higher in the second quarter, leaving any angst of the first quarter’s focus on banking turmoil behind.
- While the S&P 500 was up 16.9% in the first half, 74% of that gain was generated by just seven companies.
- Going forward, we believe it will be critical tonavigate around rich valuations and avoid overpaying for enticing stories wheresubstantial optimism is priced in and risk/reward profiles look resultinglymore precarious.
Expensive at the Top
Letter Summary
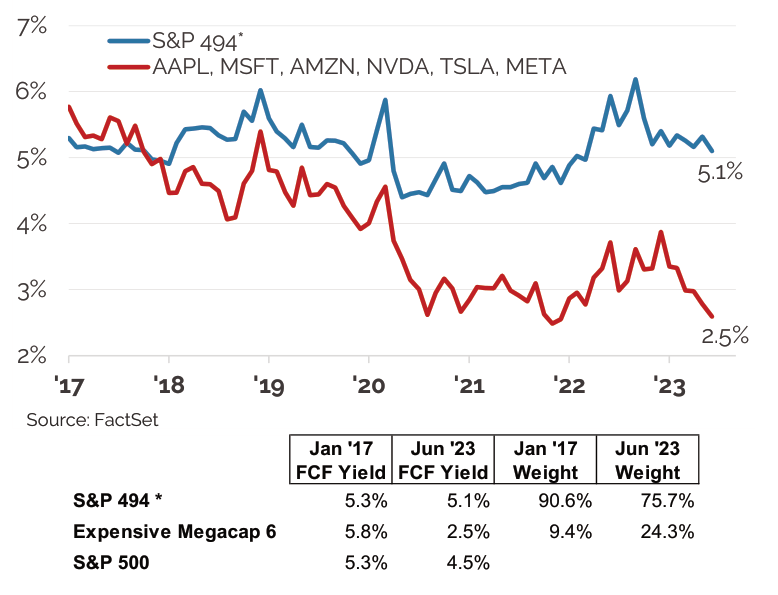
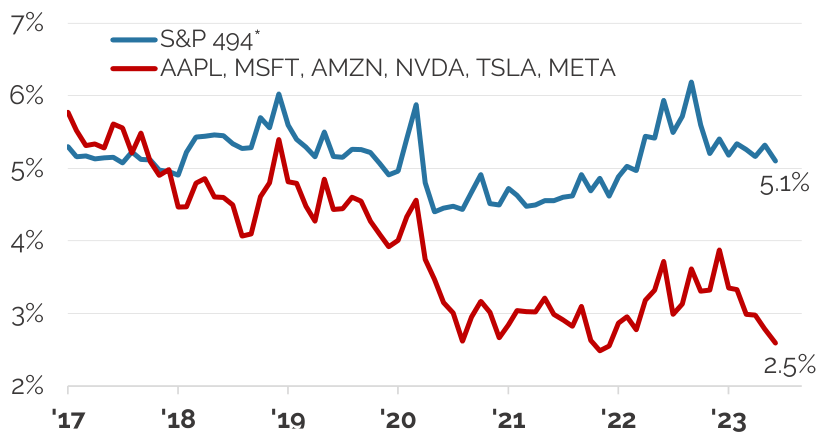
A strong rally moved market levels markedly higher in the second quarter, leaving any angst of the first quarter’s focus on banking turmoil behind. The rally, however, was driven mostly by a handful of the biggest stocks that look increasingly rich relative to the market overall (see Figure 1 below).
Figure 1: Free Cash Yield (NTM) for the "S&P 494" vs. the Expensive Megacap 6
| * The "S&P 494" is a hypothetical index that removes the 6 largest stocks by weight that are more expensive than the S&P 500 average from the S&P 500 Index. Onecannot invest directly in an index. See disclosures. |
While the S&P 500 ( SP500 , SPX ) was up 16.9% in the first half, 74% of that gain was generated by just seven companies, which had an average return of 89% while the other 493 constituents in the S&P 500 had an average gain of just under 7%. Alphabet ( GOOG , GOOGL ) was owned in our U.S. FSV strategy, but it was alone among the seven largest stocks. At this point, the other six largest stocks are significantly dampening the overall market’s valuation though the remainder of the market looks much more reasonably priced. Going forward, we believe it will be critical to navigate around rich valuations and avoid overpaying for enticing stories where substantial optimism is priced in and risk/reward profiles look resultingly more precarious.
Performance Summary
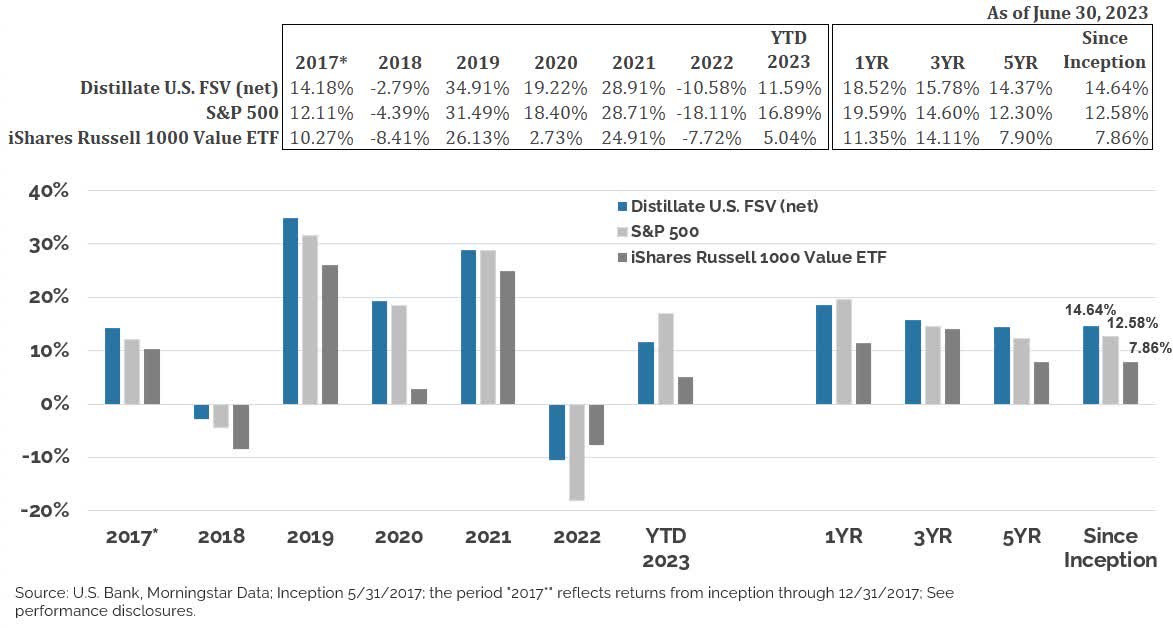
U.S. Fundamental Stability & Value (U.S. FSV): In the H1 2023, our U.S. large-cap strategy returned 11.6% after fees and lagged the S&P 500 by 5.3% as a substantial headwind from large gains among a small number of unowned stocks more than offset better performance versus the remainder of the market. The drag from just six large outperforming unowned stocks (NVIDIA, Microsoft, Tesla, Meta, Amazon, and Apple) was around 7.2%. Against the Russell 1000 Value ETF, our U.S. FSV strategy outperformed by 6.5%. Annualized net of fee returns remain ahead of each benchmark since inception, at 1.94% and 6.68% compared to the S&P 500 Index and Russell 1000 ETF, respectively (See Figure 2).
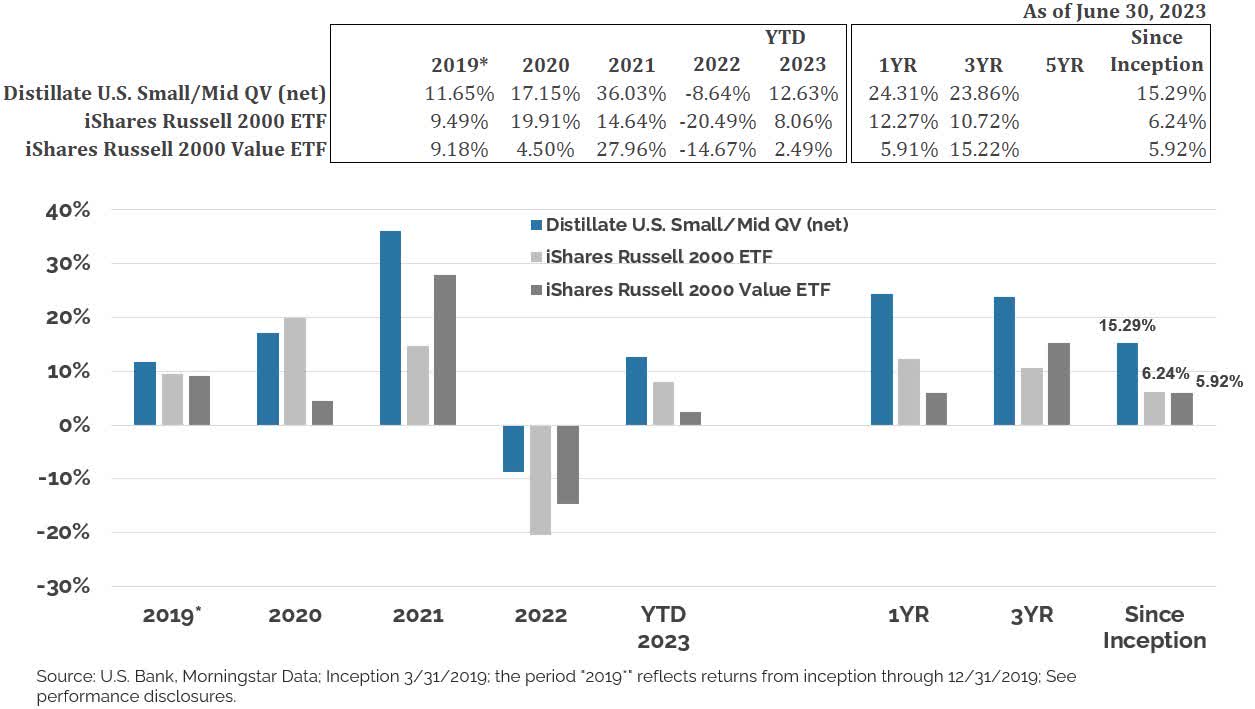
U.S. Small/Mid Cap Quality & Value (SMID QV): Our SMID QV strategy outperformed its Russell 2000 benchmark by 4.6% and its Russell 2000 Value benchmark by 10.1% in the first half of the year, and annualized excess returns since inception and net of fees are 9.06% and 9.38% ahead of those benchmarks (See Figure 3).
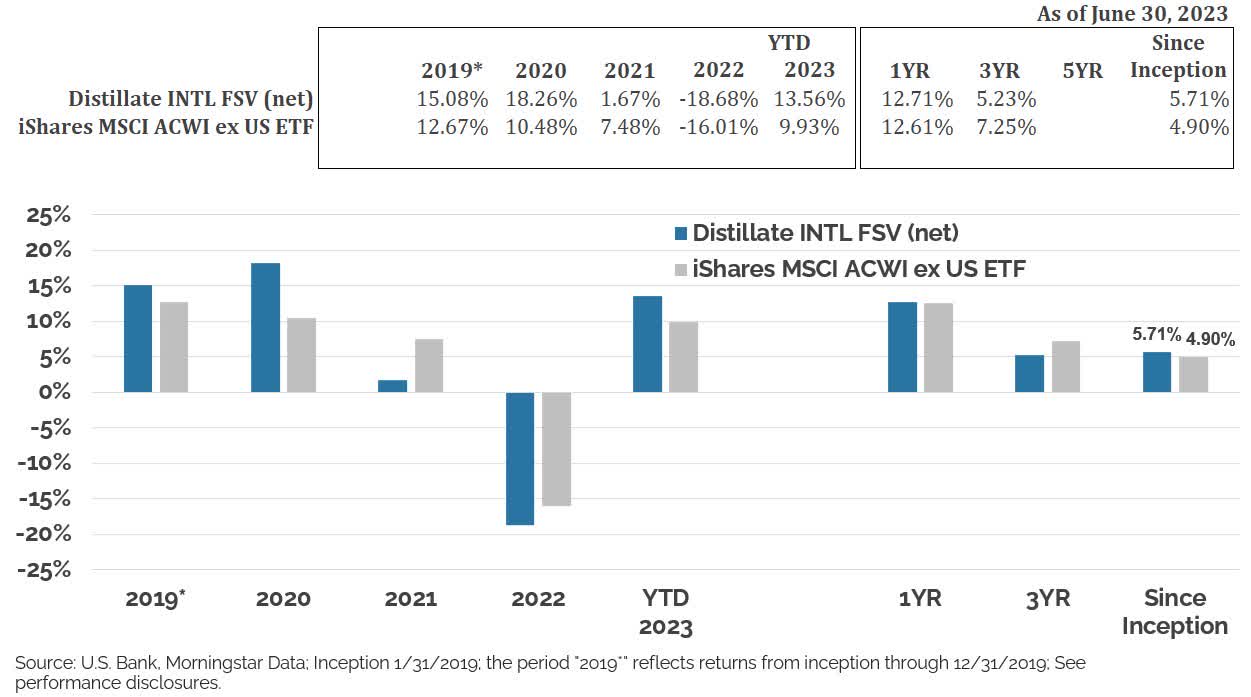
International Fundamental Stability & Value (Intl. FSV): Our International FSV strategy returned 13.6% after fees in the first half of the year, which was 3.6% ahead of the MSCI All Country Ex US ETF benchmark. Annualized net of fee performance since inception is ahead of its benchmark by 0.80% (See Figure 4).
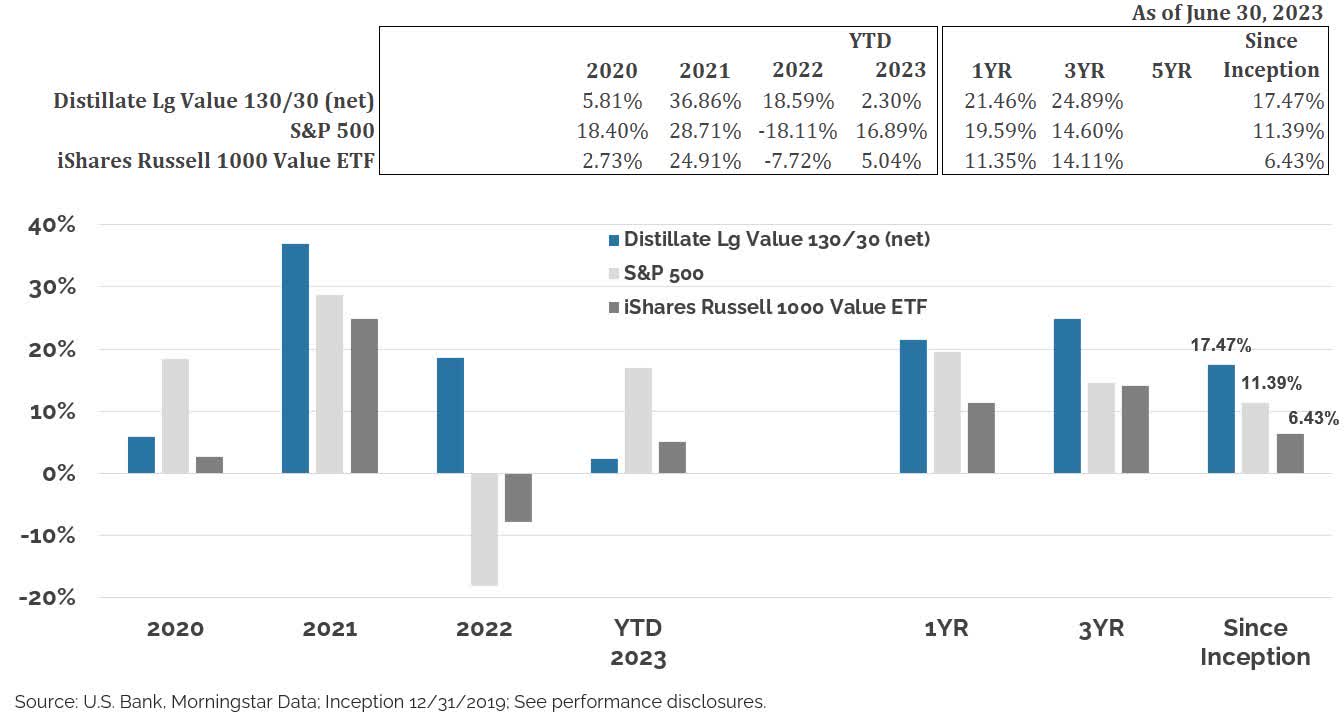
U.S. Large Cap Value Long 130%/Short 30% (U.S. Value 130/30): Our 130/30 strategy returned 2.3% net of fees on a total return basis, trailing well behind the comparable 16.9% figure for the S&P 500 Index. This underperformance follows significant outperformance last year such that annualized net of fee returns are still ahead of the S&P 500 Index by 6.08% and above the Russell 1000 Value ETF by 11.04% (See Figure 5).
Performance Charts: Figures 2 through 5 depict net returns for Distillate’s U.S. FSV, SMID QV, International FSV and U.S. Value 130/30 composite strategies versus their respective benchmarks since inception.
Figure 2: Distillate U.S. Fundamental Stability & Value Composite Performance
Figure 3: Distillate U.S. Small/Mid Quality & Value Composite Performance
Past performance does not guarantee future results. One cannot invest directly in an index. See disclosures.
Figure 4: Distillate INTL Fundamental Stability & Value Composite Performance
Figure 5: Distillate U.S. Large Cap Value 130/30 Composite Performance
Past performance does not guarantee future results. One cannot invest directly in an index. See disclosures.
Market Commentary
Despite banking turmoil, persistent inflation, resultingly higher interest rates, and moderating economic conditions that caused rolling next-twelve-month free cash flow estimates to be flat in the first half of the year, the S&P 500 rose 16.9% on a total return basis. A key tenet in investing is that it is not so much what happens that matters for equities, but what happens relative to what is already embedded in prices. Thus, despite these negatives, banking issues did not become systemic and pressures were fairly benign for the largest and most economically-impactful banks, there are favorable signs inflationary pressures like wages are easing even though they remain elevated, and while economic activity is slowing amid higher interest rates, it has endured much better than feared.
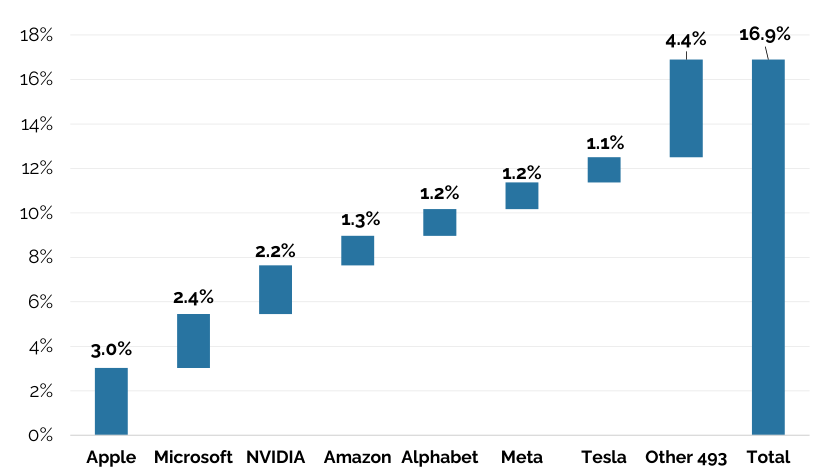
But as the market defied prior pessimism to rise solidly in H1, the rally was extremely top-heavy and that portion of the market now looks richly valued. The seven largest stocks contributed 12.5% of the 16.9% gain in the S&P 500, while the remaining 493 stocks collectively added only 4.4% (See Figure 6). The average and median returns for those seven biggest stocks were 89% and 55% compared to just 6.7% and 4.7% for the other 493 stocks. Collectively, the largest seven stocks increased by over $4 trillion in market capitalization in the first half of the year and are now worth $11 trillion.
First half gains were dominated by the largest 7 stocks.
Figure 6: S&P 500 Contribution to H1 Return by Stock
The strong gains among the biggest few stocks have led to an extraordinary amount of concentration in the large-cap U.S. equity space with the top 5 stocks comprising over 24% of the S&P 500’s total value, a figure higher than at any point since we have data for all 500 constituents going back to 1980. There are several concerns with high levels of concentration. First and most obviously, an investor in the overall index or fund that tracks it will be less diversified and more exposed to company-specific risk. Second, the largest stocks tend not to remain the largest over time, as forces of creative destruction, the innovator’s dilemma, and the sheer challenges of growing from an enormous size tend to make it difficult to stay at the top despite some of the seeming benefits of scale.
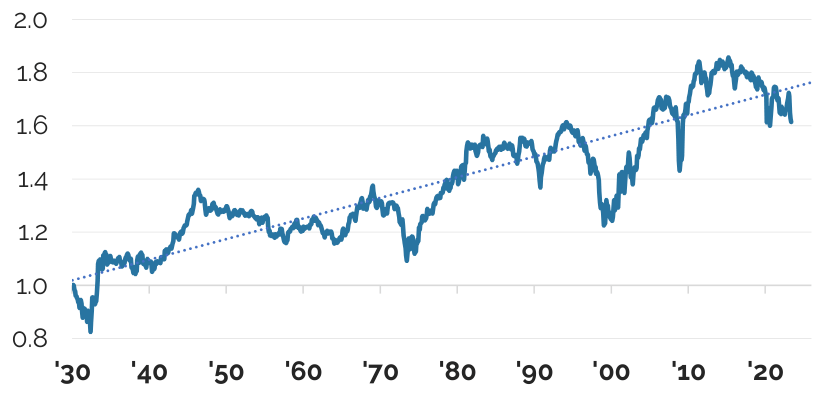
As we discussed in our recent white paper on concentration, the top 10 stocks tend to turn over with time and an equally-weighted index of the largest U.S. stocks has historically outperformed the capitalization-weighted version going back to 1930 when robust individual stock data begins (See Figure 7).
An equal weighted index of the largest ~500 U.S. Stocks has outperformed a capitalization-weighted version over time.
Figure 7: Equal-Weighted vs. Capitalization-Weighted Index of Large (~500) U.S. Stocks Over Time
| * Top 30% of all U.S. stocks which currently corresponds to ~550 stocks. Source: Ken French Data Library, data through May '23 |
Supportive of this, [[IBM]] and AT&T ( T ) seemed invincible in the Nifty Fifty era when they alternately peaked at weights of over 9% of the S&P 500 Index. Since then, each has steadily seen its weight shrink to current levels of just 0.3%. Investors would have done much better to own the S&P 500 Index ex those two stocks. As incumbents have ceded their top spots over time, it is typically younger companies that take their place. Consistent with this, among the current top largest stocks, Tesla ( TSLA ) and Meta ( META ) did not exist as public stocks 15 years ago, Alphabet, Nvidia ( NVDA ), and Amazon ( AMZN ) were not in the S&P 500 Index 20 years ago, and the largest seven stocks on average have only been part of the S&P 500 for around 18 years. While it is always difficult to imagine the largest companies being unseated by newer companies, the history of American entrepreneurialism and ingenuity is remarkable.
The third issue with current concentration in the large-cap U.S. equity market is one of valuation and what level of optimism for the future is discounted into current prices. The strong returns of the largest stocks to date have not been matched with a commensurate upward revision to projected free cash flows. Other than Alphabet, which remains more attractively valued than the market overall, the mega-cap six (AAPL, MSFT, AMZN, NVDA, TSLA, META) have seen their collective weighted-average free cash yield on next-twelvemonth estimates fall sharply to just 2.5%, which is well below the overall S&P 500’s 4.5%. Putting the figures in multiple-space, the mega-six is now trading at 40x expected free cash flow. This is in sharp contrast to a legacy of being cheaper than the S&P 500 at the start of 2017, when we owned AAPL and MSFT (See Figure 8 on the following page). As these stocks have grown in weight, the drag on the overall S&P 500 valuation has become significant. Among the remaining 494 stocks, however, the free cash flow yield is roughly unchanged over the time Distillate has existed.
The free cash yield of the largest stocks has fallen sharply as valuations have gotten richer, but the free cash valuation of remainder of the market has stayed fairly steady.
Figure 8: Free Cash Yield (NTM) of the Expensive Megacap 6 vs. the Remaining S&P 494
| Jan '17 FCF Yield |
| Jun '23 FCF Yield |
| Jan '17 Weight |
| Jun '23 Weight |
| S&P 494 * |
| 5.3% |
| 5.1% |
| 90.6% |
| 75.7% |
| Expensive Megacap 6 |
| 5.8% |
| 2.5% |
| 9.4% |
| 24.3% |
| S&P 500 |
| 5.3% |
| 4.5% |
Precisely attributing the current pricing of these largest stocks by investors is difficult. We believe there is an element of it that can be attributed to safety-seeking in that the group has the commonality of strong balance sheets and some have annuity-like characteristics and a deeply embedded client base. The market’s past focus on low-Beta backfired in 2020, and there is some logic in seeking safety in companies like the mega-six, but what you pay matters. More on that later, but certainly another element of the strong rally has been driven by an enthusiasm for the potential benefit from Artificial Intelligence ((AI)). Like with the internet in the late 1990’s, the market senses a big change is afoot. While we do not doubt the potential for AI to have enormous impacts on our economy and equity markets over time, we think it is difficult to foretell the consequences of an innovation in its early stages. Technological disruption historically has tended to be more of a headwind than a tailwind to incumbent firms as the earlier examples of AT&T and IBM would suggest. Warren Buffett also described this phenomenon when he pointed out that with the advent of the automobile, it would have been much easier to “short the horse” than to figure out which auto companies would succeed among the roughly 2,000 that failed. While some of the largest companies today look likely to benefit from AI, we think it is far from clear exactly how this will play out over the longer term. Crucially, when this uncertainty is matched with very rich valuations that are pricing in significant optimism, the risk/ reward becomes problematic.
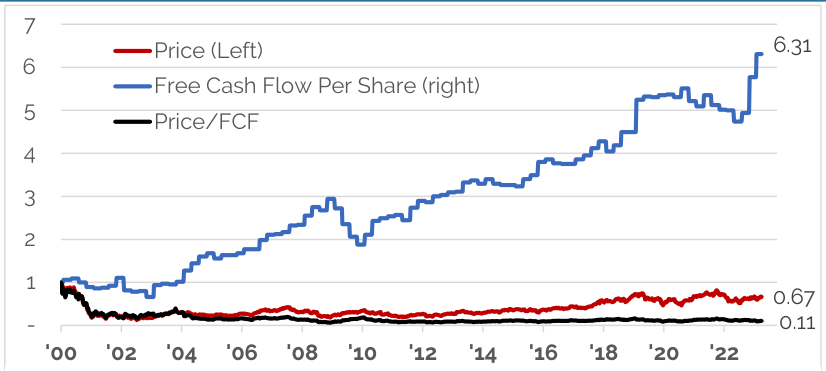
It is important to note that rich valuations can create trouble even when the growth that an investor is paying for is realized. The case of Cisco ( CSCO ) in 2000 provides a useful example. Investors in March of 2000 were so optimistic about Cisco’s prospects for growth that they were willing to pay 119x free cash flows and accept a sub 1% free cash flow yield for the shares. Since then, in one sense, investors’ enthusiasm was correct as free cash flows have grown more than 6x. Cisco has been tremendously successful, riding the wave of all the internet has brought us. However, the share price remains about a third lower than it was at the time as the valuation multiple compressed by nearly 90%, more than offsetting the growth in the business (See Figure 9). The market was right in thinking a bright future was in store, but when the price you are asked to pay is ignored, it rarely ends well. To put it simply, valuation matters.
Cisco investors have lost money since investing in March of 2000 despite free cash flows growing over 6x from then to now.
Figure 9: Cisco Share Price, Free Cash Flow, and Free Cash Multiple Indexed to 1 in March 2000
| Mar '00 |
| Jun '23 |
| Change |
| FCF Per Share (LTM) |
| $0.65 |
| $4.10 |
| 531% |
| Price |
| $77.31 |
| $51.74 |
| -33% |
| Free Cash Multiple |
| 118.9 |
| 12.6 |
| -89% |
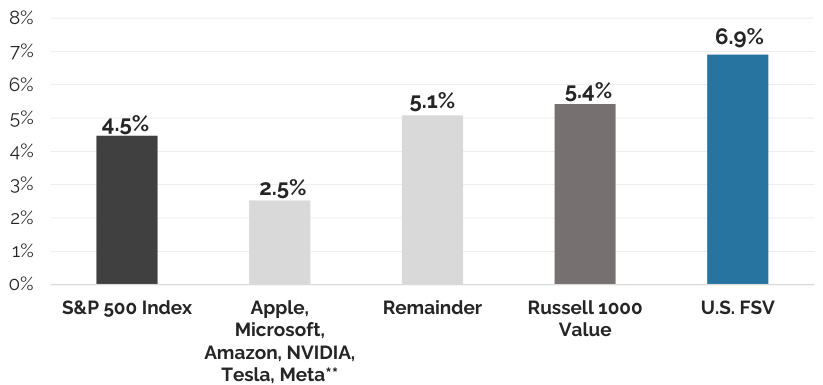
Figure 10 builds on Figure 8 to highlight how the 4.5% free cash yield for the S&P rises to 5.1% if those the six mega-cap expensive stocks are excluded. By being selective amongst this remainder and merging in our focus on low leverage and cash flow stability, we are able to compile a group of stocks with a much more attractive 6.9% yield. Thus, despite the low 4.5% free cash yield for the S&P 500, there is still opportunity to invest in high quality stocks at attractive valuations. Moreover, we are able to do this without sacrificing growth as the weighted-average sales growth for our portfolio on consensus estimates from 2022 to 2024 is 12%, versus a comparable 6% for the S&P 500 based on figures from FactSet.
The free cash yield on the S&P is being pulled lower by just six stocks..
Figure 10: Free Cash Yield for the S&P 500, Expensive Megacap 6, and Distillate’s U.S. FSV Strategy
Stocks without estimates are excluded and the index re-weighted (Source: FactSet, 6/30/2023)
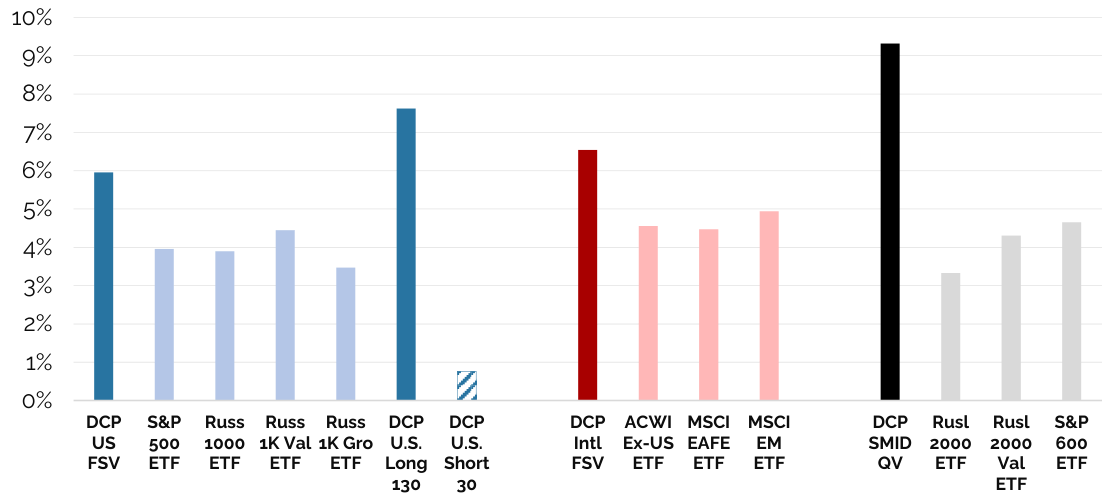
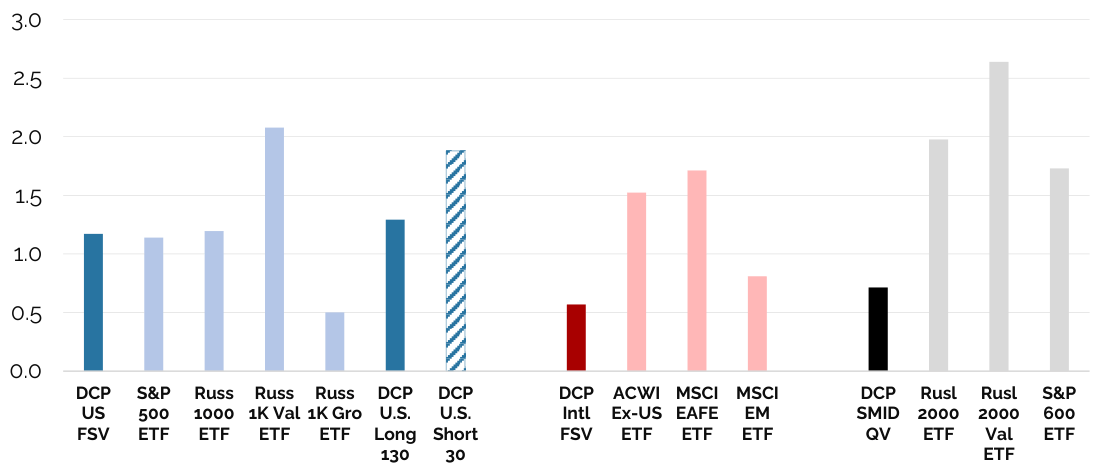
Valuation & Quality Statistics: Figure 11 shows the current valuations for Distillate’s U.S. and International Fundamental Stability & Value ((FSV)) and U.S. Small/Mid Cap Quality & Value strategies versus their benchmarks, as well as the long and short components of our U.S. Large Cap Value 130/30 strategy. Figure 12 compares the same Distillate strategies and corresponding benchmarks on our cash flow stability scores, and Figure 13 examines the degree of financial leverage across the same strategies and benchmarks.
Figure 11: Next 12-Month Free Cash Flow to Enterprise Value
Source: FactSet, See end-notes for methodology. As of 7/6/2023
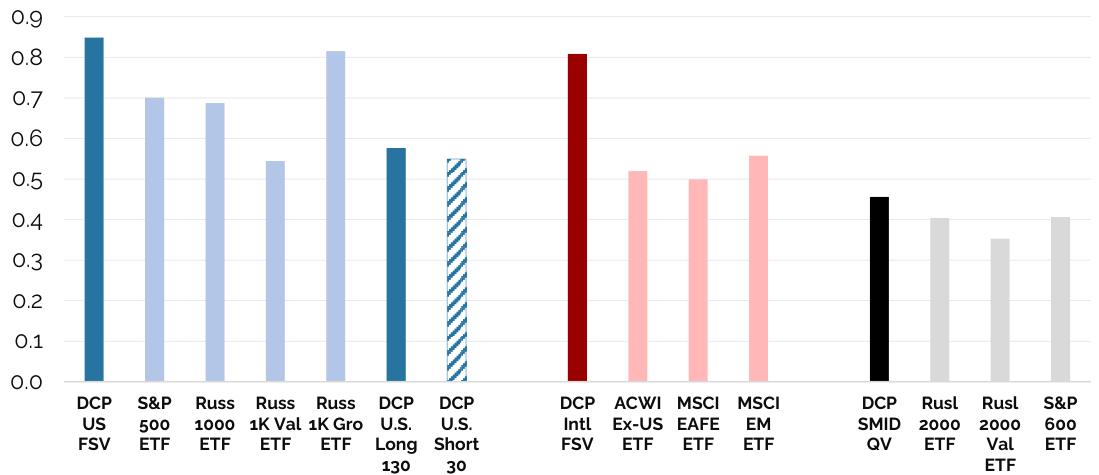
Figure 12 (Quality): Distillate’s Cash Flow Stability Score
Source: FactSet, See end-notes for methodology. As of 7/6/2023
Figure 13 (Quality): Net Debt to Adjusted EBITDA
Source: FactSet, See end-notes for methodology. As of 7/6/2023
Valuation & Quality vs. Indexes
Starting with valuations, Figure 11 compares next-twelve-month estimated free cash flow to enterprise value, and highlights substantial valuation advantages for each of Distillate’s strategies versus their relevant benchmarks. The yield premium of the U.S. FSV strategy over the S&P 500 is at its widest point since inception, and reflects the opportunity available by being selective and avoiding the largest most expensive stocks that are depressing the overall market’s free cash yield. Our international strategy is also highly differentiated on this measure versus its main benchmark which itself is more attractively valued than its U.S. counterpart after years of underperformance. The small/mid cap strategy also enjoys a significantly more attractive valuation than its benchmarks, where high leverage and a significant number of unprofitable firms are dampening free cash to enterprise values—two key issues that we believe make this a much better valuation metric in the small cap space than price-to-earnings, which does not incorporate leverage and typically excludes unprofitable stocks in index level calculations.
Figure 12 looks at fundamental stability by examining the through-cycle variability of cash flows, with a higher score equating to greater stability. We believe the greater stability of our strategies is particularly important to our goal of preserving capital in adverse economic scenarios, including recessions. The small/mid cap strategy does not employ a stability overlay in the stock selection process since we have found this metric to be less useful in the smaller cap space where companies tend to have shorter histories and much less stability in general. Nonetheless, the figure is calculated and the portfolio does show modestly better stability than the comparable benchmarks.
Figure 13 measures leverage in the form of total debt relative to normalized lease-adjusted consensus estimates for earnings before interest, taxation, depreciation, and amortization (EBITDA). Amid rising interest rates and bond yields, we believe this is a critical risk to avoid and a key differentiator for our strategies. We have clearly seen the dangers of leverage playing out with regard to smaller U.S. banks this year. In the small cap space, leverage is an even bigger issue as it is high among smaller cap companies despite the fact that the fundamentals for these companies are more volatile and they are thus on average less able to support higher debt burdens.
Performance
U.S. Fundamental Stability & Value (U.S. FSV)
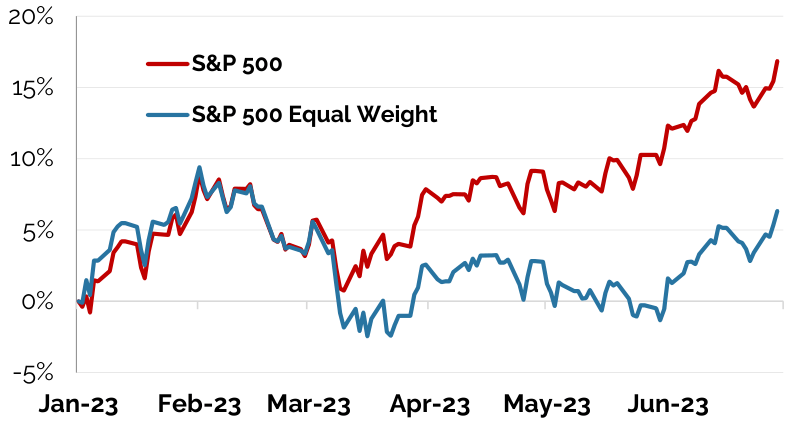
Distillate’s U.S. FSV strategy returned 11.6% in H1 2023 on a total return basis net of fees, compared to 16.9% for the S&P 500 benchmark. Performance suffered from a 7.2% headwind from not owning just six stocks (NVIDIA, Microsoft, Tesla, Meta, Amazon, and Apple which was only owned in Q1). The impact of large gains among just a few of the biggest stocks is evident in the wide gap in performance between the market cap-weighted S&P 500 Index and the equal-weighted S&P 500 ETF (See Figure 14). Among owned stocks, Broadcom ( AVGO ), Jabil Inc. ( JBL ), and Fortinet ( FTNT ) were the largest contributors to relative performance at around 50, 30, and 30 basis points of contribution to excess return, respectively. Advanced Auto Parts, [[CVS]], and AbbVie ( ABBV ) were the biggest detractors among owned names at -60, -50, and -40 basis points of drag to relative performance.
The significant outperformance of a small number of the biggest stocks has led to a big gap between the S&P 500 and the equal-weighted ETF.
Figure 14: S&P 500 Index Performance vs. "S&P 490"
U.S. Small/Mid Quality & Value (SMID QV)
Distillate’s SMID QV strategy returned 12.6% on a total return net-of-fee basis in H1 2023, 4.6% ahead of the 8.1% return for the Russell 2000 ETF and 10.1% above the 2.5% return for the Russell 2000 Value ETF. After strong relative performance in prior years, the strategy’s annualized performance is now 9.1% and 9.4% ahead of the same benchmarks since inception in 2019. Top contributors in H1 include Builders FirstSource ( BLDR ), AutoNation ( AN ), Toll Brothers ( TOL ), and Owens Corning ( OC ), contributing around 70, 60, 50, and 40 basis points of relative performance against the Russell 2000 ETF benchmark, respectively. The largest detractors from relative performance were Victoria’s Secret Company ( VSCO ), Super Micro Computer ( SMCI , unowned), Hibbett ( HIBB ), and APA Corporation ( APA ), which respectively subtracted around 50, 35, 30, and 25 basis points of relative performance. Annualized performance net of fees is 9.1% ahead of the Russell 2000 ETF and 9.4% above the Russell 2000 Value ETF since inception.
International Fundamental Stability & Value (Intl. FSV)
Distillate’s Intl. FSV strategy returned 13.6% net of fees in H1 of 2023 and eclipsed the 9.9% return MSCI ACWI Ex-US benchmark by 3.6%. Among owned stocks, Advantest, Industria de Diseno Textil, LVMH Moet Hennessy Louis Vuitton, and Li Auto added 60, 50, 45, and 40 basis points to relative performance against the MSCI ACWI Ex-US benchmark. Relative performance was positive across almost all sectors and in all regions. As a reminder, region weights are kept at 150% of the benchmark weight to limit the potential for any one region to have an outsized impact on performance, but weights are otherwise determined by bottom-up stock selection. The largest detractors from relative performance were NCsoft Corporation, Zhongsheng Group Holdings ( ZSHGY ), Taiwan Semiconductor Manufacturing Co. ( TSM , unowned), and Roche ( RHHBY ), where each subtracted 30 basis points from relative performance. Stronger performance this year is helping to offset underperformance in each of the last two years when an underweight to bank stocks due to their high leverage and issues with free cash flow analysis created a meaningful headwind for our strategy. Aided also by strong relative gains in 2019 and 2020, annualized performance net of fees is 0.8% above the MSCI ACWI Ex-US benchmark since inception.
U.S. Large Cap Long 130/Short 30 (U.S. 130/30)
Our U.S. 130/30 strategy supplements our U.S. FSV strategy as more of a pure value strategy that is designed to benefit not only from buying the 100 cheapest names among the largest 500 U.S. stocks, but also from being able to short the most expensive 100 in that group. Performance for the strategy has been and will likely be much more varied than its U.S. FSV counterpart that emphasizes fundamental stability in addition to valuation. U.S. FSV also operates without leverage, while 130/30 is, by definition, a levered portfolio. In the first half of 2023, the strategy returned 2.3% net of fees which trailed well behind the 16.9% gain of the S&P 500 ETF. Similar to the headwind faced by the U.S. FSV strategy but without the benefit of owning Apple in the first quarter or Alphabet in both quarters, the strategy faced a significant headwind from not owning Apple, NVIDIA, Microsoft, Meta, Tesla, Amazon, or Alphabet. Given these headwinds from the largest stocks, the short side of the strategy also lagged the market, but not by enough to offset the underperformance of the long side. This underperformance in H1 of 2023 comes on the heels of significant outperformance in each of the prior two years such that annualized net of fee performance since inception in 2020 is 6.1% ahead of the S&P 500 Index and 11.0% above that of the Russell 1000 Value ETF.
Changes & Valuation
U.S. Fundamental Stability & Value (U.S. FSV)
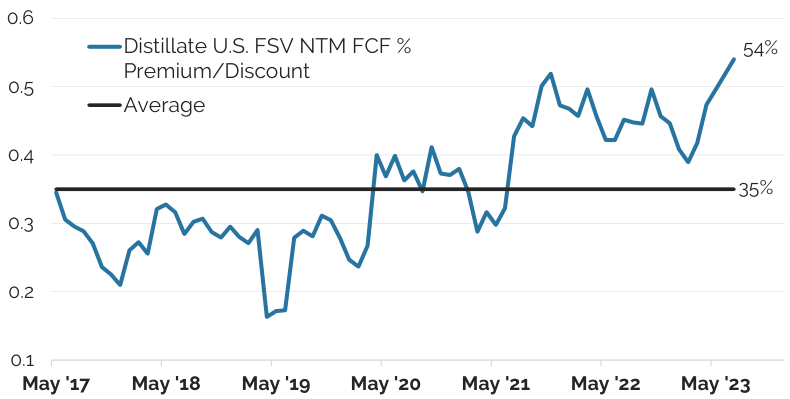
After rebalancing, Distillate’s U.S. FSV strategy’s free cash flow to market cap yield valuation of 6.9% compares very favorably to 4.5% for the same measure for the S&P 500 (See Table 1). As we highlighted earlier, there remains a wide dispersion in valuations in the market. By avoiding the most expensive stocks where we believe the risk/reward is less favorable and instead focusing on the stocks with low leverage, stable cash flow generation profiles, and very attractive valuations, we are able to assemble a high quality portfolio that still offers a meaningfully better free cash flow yield, as the quality and valuation statistics in Table 1 highlight. Due to some of the valuation distortions in the market currently, the strategy's valuation advantage to the market is the highest since inception in terms of NTM FCF yield premium, as is highlighted in Figure 15.
Distillate Capital’s U.S. FSV Strategy is less expensive, more fundamentally stable, and less levered to the S&P 500.
| Table 1: U.S. FSV Portfolio Characteristics* |
| U.S. FSV |
| S&P 500 |
| Free Cash Yield to Mkt Cap1 |
| 6.9% |
| 4.5% |
| Free Cash Yield to EV1 |
| 5.9% |
| 3.9% |
| P/E2 |
| 14.8 |
| 19.1 |
| Leverage3 |
| 1.17 |
| 1.14 |
| Fundamental Stability4 |
| 0.85 |
| 0.70 |
| *as of 7/6/2023, see methodology endnotes. |
Distillate’s U.S. FSV strategy is avoiding several large richly valued stocks that are driving the overall S&P 500 free cash flow yield lower.
Figure 15: US FSV NTM Free Cash Yield, Percentage Premium/Discount to S&P 500
Sector Changes
As a reminder, there is no top-down sector constraint as portfolio changes are driven by bottom-up stock selection. Within that framework, the largest sector change in the rebalance was a 5-percentage point increase in health care after the sector significantly underperformed. The consumer staples sector increased by 2.5 percentage points after likewise underperforming. These additions were offset by a roughly 4 percentage point decrease in the tech sector, which solidly outperformed, and a 3 percentage point reduction in industrials. Broadly, sector shifts tend to mirror recent relative sector performance and this quarter’s changes are consistent with that observation. Current sector weights relative to the S&P 500 are shown in Table 2 which also breaks out the distortive impact of several mega-cap stocks in certain sectors for better comparison.
Sector weights are driven by bottom-up stock selection.
| Table 2: U.S. FSV Sector Exposure* |
| U.S. FSV |
| S&P 500 |
| Communication Services |
| 9.8% |
| 8.5% |
| Consumer Discretionary |
| 10.6% |
| 10.7% |
| Ex AMZN & TSLA |
| 10.6% |
| 5.6% |
| Consumer Staples |
| 6.9% |
| 6.7% |
| Energy |
| 2.3% |
| 4.0% |
| Financials |
| 9.0% 9.0% |
| 12.4% 8.6% |
| Ex Banks |
| Health Care |
| 23.0% |
| 13.3% |
| Industrials |
| 17.9% |
| 8.5% |
| Information Technology |
| 17.5% |
| 28.2% |
| Ex Apple & Microsoft |
| 17.5% |
| 13.6% |
| Materials |
| 2.3% |
| 2.5% |
| Real Estate |
| 0.8% |
| 2.5% |
| Utilities |
| 0.0% |
| 2.6% |
| *as of 7/6/2023 |
Sells: The largest exited positions in the quarter were Eaton ( ETN ), [[CSX]], and Hubbell ( HUBB ). Each stock outperformed the broader market in the last quarter and the positions were exited as valuations became stretched beyond the threshold for inclusion.
Buys: The largest new purchases were Bristol-Myers Squibb ( BMY ), Danaher ( DHR ), and General Mills ( GIS ), which were added at 1.9%, 1.2%, and 0.9% weights. Each stock underperformed the S&P 500 Index last quarter by more than 10 percentage points. Bristol, in particular, offers a free cash yield on next-twelve-month consensus estimates of over13% to market cap and 10% to enterprise value.
Adds/Trims: The largest adds were AbbVie and UnitedHealth Group ( UNH ), which both rose in weight after underperforming and seeing their valuations become more attractive. Alphabet was the largest trim after outperforming considerably in the quarter.
U.S. Small/Mid Cap Quality & Value (SMID QV)
There is enormous range of valuations in the small and mid-cap space and those valuations can look wildly different based on whether leverage is included or unprofitable stocks are captured. Unprofitable stocks make up a large share of the most popular small cap benchmarks but are often excluded in standard P/E calculations. This dispersion in valuations in individual stocks creates opportunity to construct very attractive portfolios that stand out from common benchmarks in a number of ways. On valuation, Distillate’s small/ mid cap strategy of 150 stocks is able to achieve a very attractive 9.4% free cash flow to enterprise value yield that is substantially higher than that of either the Russell 2000 ETF or Russell 2000 Value ETF benchmarks (See Table 3).
Our Small/Mid Cap strategy is also highly distinct from the Russell 2000 and 2000 Value ETF benchmarks in terms of indebtedness. Leverage is very elevated among small cap stocks broadly and could prove to be a significant risk as maturing debt must be rolled into a market where interest rates and thus borrowing costs have moved meaningfully higher. Distillate’s strategy looks to avoid the risks inherent in highly levered situations by limiting debt, and after rebalancing, the portfolio has a leverage ratio of 0.7x, significantly lower than the 2.0x and 2.6x figures of the Russell 2000 and Russell 2000 Value benchmarks (See Table 3).
Lastly and also related to quality, Distillate’s SMID QV has no position in stocks that have negative next-twelve-month free cash flow estimates. For the Russell 2000 and Russell 2000 Value benchmarks, after reweighting for stocks without estimates, 17% of each benchmark consists of equities that are not expected to earn positive free cash flow in the next twelve months. For the S&P 500, by way of comparison, this figure is 3%. Along with leverage, this looks to be another critical risk to avoid in the small cap segment.
The largest new purchases, CF Industries ( CF ) and Marathon Petroleum ( MPC ), are consistent with the criteria outlined above and both offer 15% free cash flow yields. The biggest sale, Builders FirstSource, has risen over 100% year-to-date and its market capitalization now leaves it out of the small/mid universe.
Distillate’s U.S. Small/Mid Cap Quality & Value strategy is more attractively valued and less indebted than its benchmarks.
| Table 3: U.S. Small/Mid Cap QV Characteristics* |
| SMID QV |
| Russell 2000 ETF |
| Russell 2000 Value ETF |
| Free Cash Yield to Mkt Cap1 |
| 11.4% |
| 5.0% |
| 6.7% |
| Free Cash Yield to EV1 |
| 9.4% |
| 3.4% |
| 4.5% |
| P/E2 |
| 8.8 |
| 12.6 |
| 10.2 |
| Leverage3 |
| 0.71 |
| 1.98 |
| 2.65 |
| Fundamental Stability4 |
| 0.46 |
| 0.40 |
| 0.35 |
| Negative FCF Weight5 |
| 0.0% |
| 17.0% |
| 17.2% |
| *as of 7/6/2023, see methodology endnotes. |
International Fundamental Stability & Value (Intl. FSV)
After rebalancing, Distillate’s International FSV strategy offers a higher free cash flow yield both to market cap and enterprise value, and has substantially more-stable fundamentals and less leverage than the index (See Table 5). The international FSV strategy is thus significantly differentiated from its benchmark not just on valuation, but critically on quality as well.
Distillate Capital’s International FSV Strategy is less expensive, more fundamentally stable, and less levered than its benchmark.
| Table 4: International FSV Portfolio Characteristics* |
| Intl. FSV |
| ACWI Ex-US |
| Free Cash Yield to Mkt Cap1 |
| 7.4% |
| 5.5% |
| Free Cash Yield to EV1 |
| 6.5% |
| 4.5% |
| P/E2 |
| 12.5 |
| 12.4 |
| Leverage3 |
| 0.56 |
| 1.52 |
| Fundamental Stability4 |
| 0.81 |
| 0.52 |
| *as of 7/6/2023, see methodology endnotes. |
Changes & Regional Weights: The largest purchase in the quarter was Alibaba, which lagged the MSCI ACWI Ex-US Index by approximate 20% last quarter and now offers a 12% free cash to enterprise value yield on next-twelve-month consensus estimates. The largest sold position was Disco Corporation, which outperformed the benchmark by around 40% and no longer meets the threshold for inclusion on valuation. The biggest increased existing position was Teleperformance, which lagged ~ 30% in the last quarter and now offers a nearly 8% free cash flow to market cap yield on next twelve-month consensus estimates. The biggest trim was Samsung Electronics which has seen its valuation deteriorate amid large and increasing capital spending plans.
Regional weights after the quarterly rebalance remain fairly well matched with the ACWI Ex-U.S. benchmark. Japan is the largest overweight at 20% vs. 15% for the benchmark. Other regions are largely in-line with the benchmark. (See Table 6). Mentioned prior, region and country weights are determined by bottom-up stock selection, but region weights are limited to 150% of the benchmark to avoid any outsized influence from region-specific or currency risk.
Regional weights reflect bottom-up stock selection but are limited to 150% of the region benchmark weight to limit geographic concentration risk.
| Table 6: International FSV Portfolio Characteristics* |
| Intl. FSV |
| ACWI Ex-US |
| Europe |
| 43.8% |
| 42.4% |
| Japan |
| 19.8% |
| 14.7% |
| Asia Ex China & Japan |
| 14.5% |
| 19.5% |
| China & Hong Kong |
| 10.5% |
| 9.6% |
| Americas |
| 11.9% |
| 10.2% |
| Middle East & Africa |
| 0.0% |
| 3.5% |
| *as of 7/6/2023 based on FactSet headquarters definition. |
U.S. Large Cap Long 130/Short 30 (U.S. 130/30)
The overall goals of the 130/30 strategy were outlined in the performance section, but are also evident in the portfolio characteristics which show a wide divergence between the valuation of the long and short portfolios (See Table 5). The same table also shows a wide gap in leverage, which is not directly screened for, but picked up somewhat indirectly in the FCF/EV filter. Stability is not utilized in stock selection as the goal of the strategy is less around stability and more about capturing upside from valuation divergences in the marketplace.
Distillate’s 130/30 strategy seeks to capitalize on valuation divergences in the market which remain wide as evidenced by the large gap between the valuations available on the long and short portfolios.
| Table 5: U.S. Large Cap Value 130/30 Characteristics* |
| Long |
| Short |
| S&P 500 |
| Free Cash Yield to Mkt Cap1 |
| 9.7% |
| 0.5% |
| 4.5% |
| Free Cash Yield to EV1 |
| 7.7% |
| 0.8% |
| 3.9% |
| P/E2 |
| 10.9 |
| 26.1 |
| 19.1 |
| Leverage3 |
| 1.29 |
| 1.89 |
| 1.14 |
| Fundamental Stability4 |
| 0.58 |
| 0.55 |
| 0.70 |
| Negative FCF Weight* |
| 0.0% |
| 28.9% |
| 2.6% |
| *as of 7/6/2023, see methodology endnotes. |
Final Word
Since we launched Distillate Capital, we have often made the point that our strategies are not designed to swing for the fences. By putting a very high priority on capital preservation and thinking holistically about risk, and picking up opportunities in good companies along the way, our goal is to outperform over a long period and allow the power of compounding to work for investors.
When clients have asked when we would expect performance to lag, we have generally described a market seemingly like today’s – one where enthusiasm for, or perhaps the fear of missing out on a large theme propels stock prices to levels that seem imprudent from a risk/reward perspective. Such exciting narratives are not new. And often, while those narratives have proven fundamentally correct, and numerous new technologies have indeed become economically significant and societally ubiquitous, the stocks that rose meteorically in anticipation have failed to maintain their gains.
This was just as true with British Railway mania of the 1840s as it was with the tech bubble of the late 1990s and the numerous episodes in between. Railroads did become a vitally important and dominant technology in the 1800s just as the internet and related industries have over the past 25 years. The stocks that surged in anticipation of each of those innovations, however, are more notable for their declines than for accurately predicting each technology’s ultimate success. As Warren Buffett noted about the advent of the automobile—it was extremely difficult to predict the winners in the early days of cars, and instead you might have had more success looking for the horse to short.
While today’s leaders may continue to move higher – we have certainly witnessed more extreme valuations in the past, we believe the current environment calls for discipline and adherence to a process aimed at securing the long-term opportunities that markets such as today's can create.
As for a firm update, we are now managing more than $1.1 billion across our three strategies. We sincerely appreciate your continued interest and confidence in us. As always, we welcome your input and are always available should you have questions.
| Distillate Capital Partners LLC (“Distillate”), is a registered investment adviser with United States Securities and Exchange Commission in accordance with the Investment Advisers Act of 1940. The firm’s list of composite descriptions is available upon request. Distillate claims compliance with the Global Investment Performance Standards (GIPS®). GIPS® is a registered trademark of CFA Institute. CFA Institute does not endorse or promote this organization, nor does it warrant the accuracy or quality of the content contained herein. To receive a GIPS Report and/or our firm’s list of composite and broad distribution pooled funds descriptions please email your request to info@distillatecapital.com. The U.S. Dollar is the currency used to express performance. Returns are presented net of management fees and include the reinvestment of all income. For non-fee-paying accounts, net of fee performance was calculated using a modeled management fee equal to the highest investment management fee that may be charged for the applicable composite (see fee schedule below). For accounts calculated with a per share, net-of fee NAV, gross performance was calculated by adding back the unitary fee associated with that fund. Policies for valuing investments, calculating performance, and preparing GIPS Reports are available upon request. The investment management fee schedule for the strategies discussed are as follows: 0.39% for U.S. Fundamental Stability & Value; 0.55% for U.S. Small/ Mid Quality & Value; 0.79% for U.S. Large Cap Value 130/30; and 0.55% for International Fundamental Stability & Value. Management fees may vary and are negotiable. Data for the Firm’s investment strategies are based on a representative account for each composite. Actual holdings and performance may differ between accounts or vehicles offered by the Firm due to the size of an account, client guidelines, or other constraints and restrictions related to that account or vehicle. This material is provided for informational purposes only and is not intended as an offer or solicitation for the sale of any financial product or service or as a recommendation or determination by Distillate that any investment strategy is suitable for a specific investor. Investors should seek financial advice regarding the suitability of any investment strategy based on their objectives, financial situations, and particular needs. The investment strategies discussed herein may not be suitable for every investor. This material is not designed or intended to provide legal, investment, or other professional advice since such advice always requires consideration of individual circumstances. If legal, investment, or other professional assistance is needed, the services of an attorney or other professional should be sought. The opinions, estimates, and projections presented herein constitute the informed judgments of Distillate and are subject to change without notice. Any forecasts are subject to a number of assumptions and actual events or results may differ from underlying estimates or assumptions, which are subject to various risks and uncertainties. All investments in securities, options and derivatives involve a risk of loss of capital and no guarantee or representation can be made that an investment will generate profits or that an investment will not incur a total loss of invested capital. Past performance does not guarantee future results and there can be no assurance that the future performance of any specific investment, investment strategy, or product will be profitable, equal any corresponding indicated historical performance level(s), or prove successful. Investment returns and value will fluctuate in response to issuer, political, market, and economic developments, which can affect a single issuer, issuers within an industry, economic sector or geographic region, or the market as a whole. Furthermore, nothing herein is intended to imply that Distillate’s investment strategies may be considered “conservative”, “safe”, “risk free” or “risk averse.” Portfolio holdings and sector allocations are subject to change at any time and should not be considered recommendations to buy or sell any security. The information in this presentation has been obtained or derived from sources believed to be reliable, but no representation is made as to its accuracy or completeness. This presentation contains forward looking statements, which can be identified by the use of forward-looking terminology such as “may”, “will”, “should”, “expect”, “anticipate”, “target”, “project”,” estimate”, “intend”, or “believe”, or the negatives thereof or any other variations thereon or other comparable terminology. Because such forward looking statements involve risk and uncertainties, actual results may differ materially from such expectations or projections. Any such forward-looking statements should not be construed to be indicative of the actual events that will occur nor should they be considered guarantees of future events in any form. The U.S. Fundamental Stability & Value composite seeks to distill a starting universe of large cap U.S. equities into only the stocks where quality and value overlap using Distillate’s proprietary definitions. Its goal is to achieve superior compounded long-term returns by limiting downside in periods of market stress, while still providing strong performance in up markets. This composite was created in May 2017. The U.S. Small/Mid Cap Quality & Value composite seeks to distill a starting universe of small- and mid-cap U.S. equities into only the stocks where quality and value overlap using Distillate’s proprietary definitions. Its goal is to achieve superior compounded long-term returns by limiting downside in periods of market stress, while still providing strong performance in up markets. This composite was created in March 2019. The International Fundamental Stability & Value composite seeks to distill a starting universe of large- and mid-cap non-U.S. equities into only the stocks where quality and value overlap using Distillate’s proprietary definitions. Its goal is to achieve superior compounded long-term returns by limiting downside in periods of market stress, while still providing strong performance in up markets. This composite was created in January 2019. The U.S. Large Cap Value 130/30 composite seeks long-term capital appreciation by holding approximately 130% of an account's value in the most attractively valued large cap U.S. stocks measured using Distillate’s proprietary free cash flow valuation method. The market exposure in this composite is brought back to approximately 100% by selling short 30% of an account's value of the least attractively valued stocks among the same starting set. This composite was created in December 2019. Free Cash Flow refers to a company’s operating cash flow, less its capital expenditures. Enterprise Value refers to a company’s market capitalization plus its net debt balance. Free Cash Flow to Enterprise Value Yield refers to a company’s or group of companies’ free cash flow divided by the company’s (or companies’) Enterprise Value, with a higher resulting ratio indicating a more attractive valuation. This metric is a valuation measure and not a form of investor yield. Normalized Free Cash Yield (or Distilled Cash Yield) refers to the firm’s proprietary valuation measure that looks at estimated, adjusted free cash flow relative to a company’s adjusted enterprise value. References to historical stocks that ranked well using this methodology refer only to these stocks’ historical valuation and not their inclusion in any actual or hypothetical strategies/accounts managed by Distillate Capital Partners LLC. This metric is a valuation measure and not a form of investor yield. Long-term Fundamental Stability is Distillate Capital’s proprietary measure of through-cycle cash flow stability with a higher value indicating greater stability. Methodology note for Figure 11: free cash flow ((FCF)) figures reflect consensus estimates of next-twelve-months (NTM) FCF in comparison to enterprise value (EV) for the relevant portfolio/strategy or benchmark. Stocks without data are excluded and portfolios are reweighted accordingly. Stocks with FCF/EV values of greater than 50% or less than -20% have been eliminated to avoid distorting overall averages. Methodology Notes for Portfolio Characteristics Tables: 1Free Cash Yield to Market Cap and Enterprise Value (EV) are based on the next-twelve-month free cash flow estimates relative to market capitalization and EV, which adds Distillate’s proprietary measure of indebtedness. Stocks without estimates in the are excluded and the remaining names are reweighted based on those exclusions. 2P/E is based on consensus estimates for next-twelve-months and excludes P/Es over 250 and under 0 to avoid the distortion from outliers. 3Leverage is based on Distillate Capital’s proprietary measure of indebtedness which looks at the ratio of adjusted net debt to an adjusted measure of forecast Earnings Before Interest, Taxation, Depreciation, and Amortization (EBITDA.) 4Fundamental stability is Distillate Capital’s proprietary measure of through-cycle cash flow stability with a higher value indicating greater stability. 5Negative FCF weight is measured as the weight of stocks with negative free cash estimate as a share of those with any estimate. The S&P 500 Index is an index of roughly the largest 500 U.S. listed stocks maintained by Standard & Poor’s. The iShares Russell 1000 Value ETF is an investable benchmark used as a proxy for its underlying index, the Russell 1000 Value Index, an index of U.S. listed stocks that possess attractive valuation as measured by FTSE Russell. The iShares MSCI ACWI Ex-US ETF is an investable benchmark used as a proxy for its underlying index, the MSCI ACWI ex USA Index, an index managed by MSCI representing large and mid cap stocks outside of the U.S. The iShares Russell 2000 ETF and iShares Russell 2000 Value ETF are investable benchmarks used as a proxies for the underlying indexes of the Russell 2000 Index (an index of U.S. listed small cap stocks) and the Russell 2000 Value Index (an index of U.S. listed small cap stocks that possess attractive valuation as measured FTSE Russell). Indices are not available for direct investment. Investment in a security or strategy designed to replicate the performance of an index will incur expenses, such as management fees and transaction costs, which would reduce returns. © Copyright 2023 Distillate Capital Partners LLC; published July 12, 2023 |
Editor's Note: The summary bullets for this article were chosen by Seeking Alpha editors.
For further details see:
Distillate Capital Q2 2023 Letter To Investors