JEPI - Dividend Harvesting Portfolio Week 106: $10600 Allocated $825 In Projected Dividends
2023-03-16 09:00:00 ET
Summary
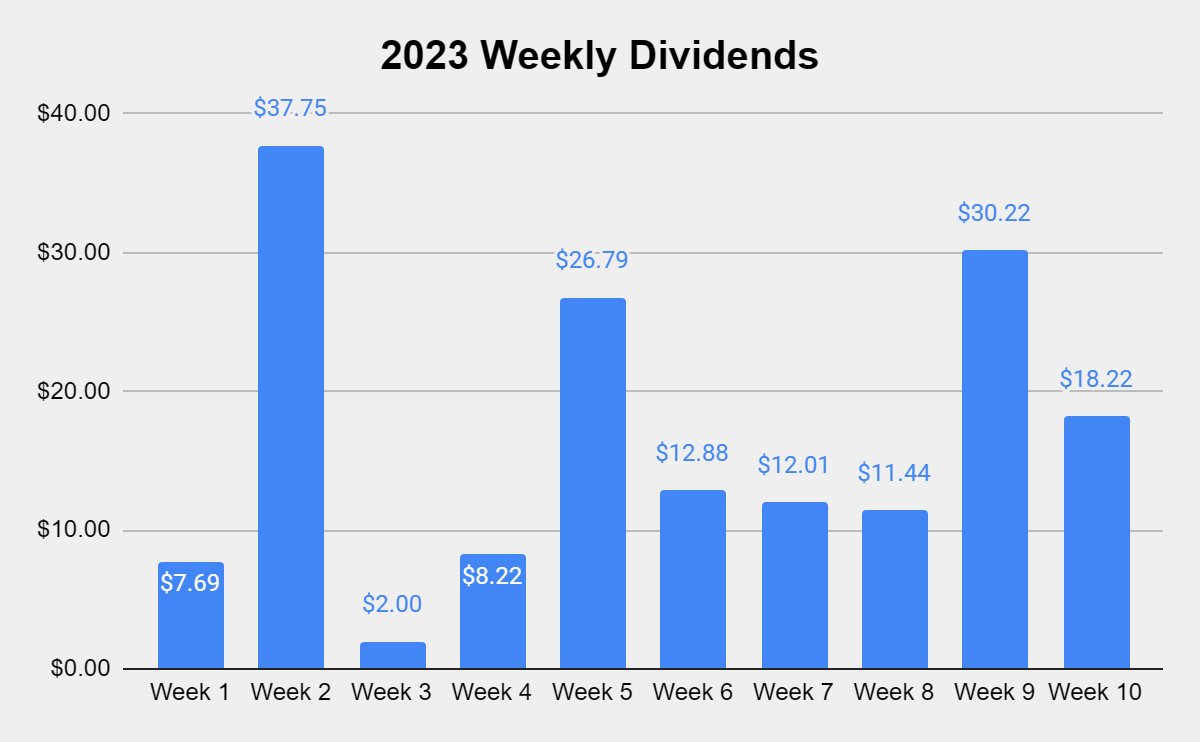
- The Dividend Harvesting Portfolio is now generating $825 in annual dividends, yielding 8.09%.
- The Dividend Harvesting portfolio has a 70.75% record of finishing the week in the black since its inception, 75/106 weeks.
- In week 106, I added to VZ, MPW, UTG, PDI, and NYCB.
Lately, investing feels like a seesaw, and the Dividend Harvesting Portfolio is up one week and down another. This was a difficult week in the markets as the S&P 500 closed down -4.85% and the Nasdaq declined -5.14%. The 2023 rally is almost depleted as the S&P 500 is now up 0.98% YTD, falling 318.17 points or -7.61% since 2/2/23. On Friday, SVB Financial Group ( SIVB ) took over headlines and sent the markets spiraling downward as a run on the bank occurred, leaving much speculation about the impacts on the financial sector, regional banks, and what it means for the markets going forward. Hopefully, this is an isolated situation, and the businesses and individuals impacted are made whole, but we'll have to wait and see how this plays out. I wouldn't be shocked if the market declines substantially in the coming week or if the government steps in to ensure this is an isolated event. Either way, I will keep buying each week as nothing I am purchasing is intended for the short term.
After week 106 and $10,600 of capital allocated, the balance of the Dividend Harvesting Portfolio has once again dipped below my baseline to $10,192.93. The account is down -$407.07 or -3.84% based on invested capital. In week 106, I collected $18.22 of dividend income from 12 positions. In 2023 the Dividend Harvesting Portfolio generated $167.22 of dividend income which is 34.07% of the total dividend income generated in 2022. In week 106, I couldn't help myself, and I purchased another share of Verizon ( VZ ) even though I was trying to hold off. As VZ crossed the 7% yield, I couldn't pass up the opportunity. I also purchased an additional share of Medical Properties Trust ( MPW ), New York Community Bank, the Reaves Utility Income Fund ( UTG ), and another share of the PIMCO Dynamic Income Fund ( PDI ). In week 106, my projected annual dividend income increased by 1.36% to $825.
I allocate capital toward big tech, funds, dividends, and growth outside of my retirement accounts. These are not my only investments, but I did open a separate account, so I could easily track and document this series. I intentionally created broad diversification throughout the Dividend Harvesting portfolio so I could benefit from sector rotations and mitigate my downside risk. Investors who are too exposed to growth companies or large-cap tech have gotten crushed as the investment landscape changes. On the growth and tech side of my investments, I'm feeling the pain as some of my favorite companies, including Alphabet ( GOOGL , GOOG ), Amazon ( AMZN ), and Meta Platforms ( META ), have been taken to the woodshed.
I'm going to address a question that continues to surface. I'm not trying to beat the market with this portfolio. I love index funds and am invested in several index funds. I love dividend investing due to the stream of cash flow it generates. I don't want 100% of my assets outside of real estate tied to an S&P index fund. I have created a personal investment strategy that works to achieve my investment goals, and having a stream of income generated from dividends is part of my investment strategy. Low-cost index funds are one of the best investments anyone can make in my opinion, and the Dividend Harvesting portfolio is not meant to be a substitute for an index fund. I have read many questions about dividend investing and wanted to start a portfolio from the ground up and document its progress to disprove many misconceptions, including that you need a large amount of seed capital to make dividend investing work for you.
This series has never been about hitting a target yield, generating a certain amount of profit, or beating the market. I had two specific goals with this series. The first was to create a blueprint for constructing a dividend portfolio by documenting the journey starting from the beginning. The second goal was to illustrate how allocating capital each week toward investing, regardless of the amount, would be beneficial in the long run.
Too many people are under the illusion that you need tens of thousands or even hundreds of thousands to benefit from investing. Instead of using my real dividend portfolio as an example, I decided to start a new account, fund it with $100, and add $100 weekly, providing a step-by-step guide to dividend investing. This methodology doesn't have to be used for dividend investing, and it could be as simple as an S&P index fund or a Total Market fund. Hopefully, this series is inspiring people to invest in their future to attain financial freedom.
A historical recap of the Dividend Harvesting Portfolios investment principles and historical performance.
Investment Objectives
- Income generation
- Downside mitigation through diversification
- Capital appreciation
Below are the fundamental rules I have put in place for this Portfolio:
- Allocate $100 weekly to this Portfolio
- Only invest in dividend-producing investments
- No position can exceed 5% of the Portfolio
- No sector can exceed 20% of the Portfolio
- All dividends and distributions are to be reinvested
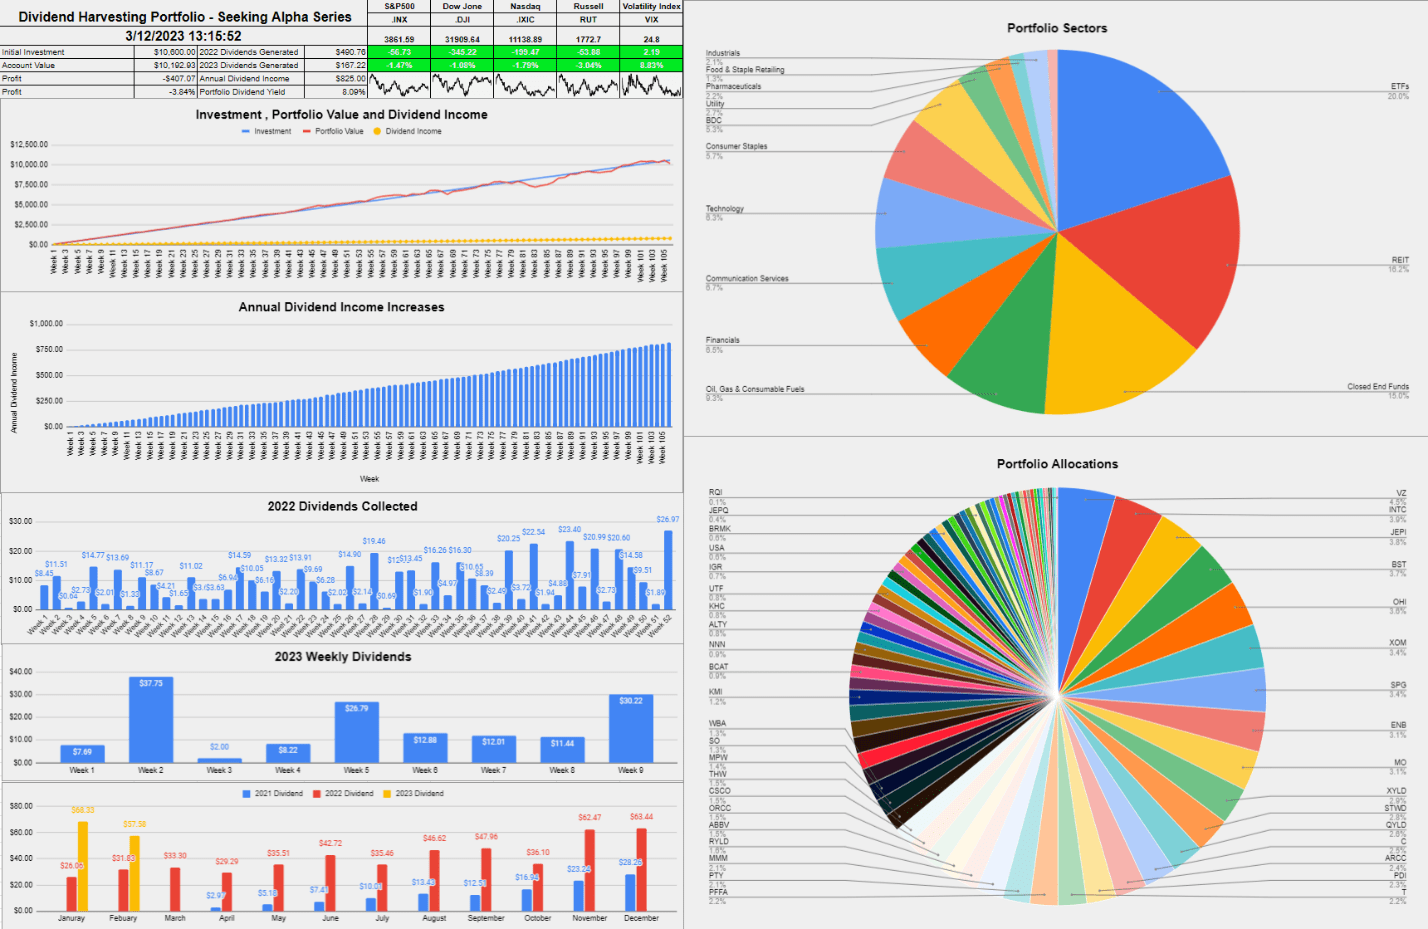
Below is a chart that extends from week 1 through the current week to illustrate the Dividend Harvesting Portfolio's Progression
- Blue line is my initial investment $100 in week 1, $1,000 in week 10, etc.
- Red line is the account value at the end of each week
- Yellow line is the annual dividend income the Dividend Harvesting Portfolio was projected to generate after that week's investments and dividends reinvested
The Dividend Harvesting Portfolio dividend section
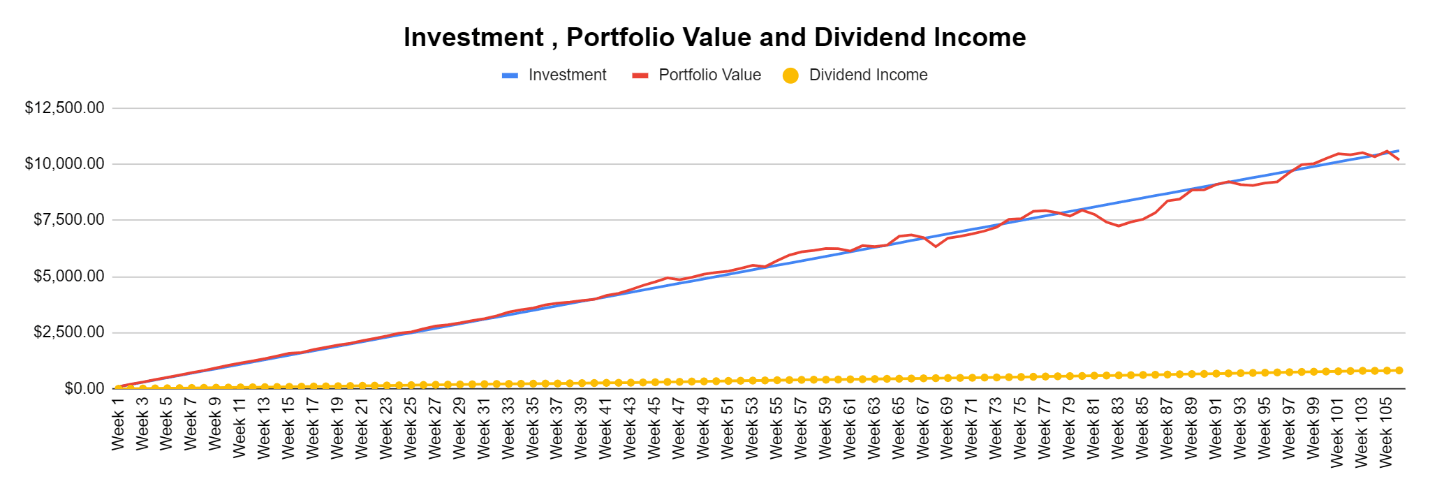
Here's how much dividend income is generated per investment basket:
- Equities $242.90 (29.44%)
- ETFs $213.15 (25.84%)
- CEFs $162.28 (19.67%)
- REITs $148.21 (17.93%)
- BDCs $58.47 (7.09%)
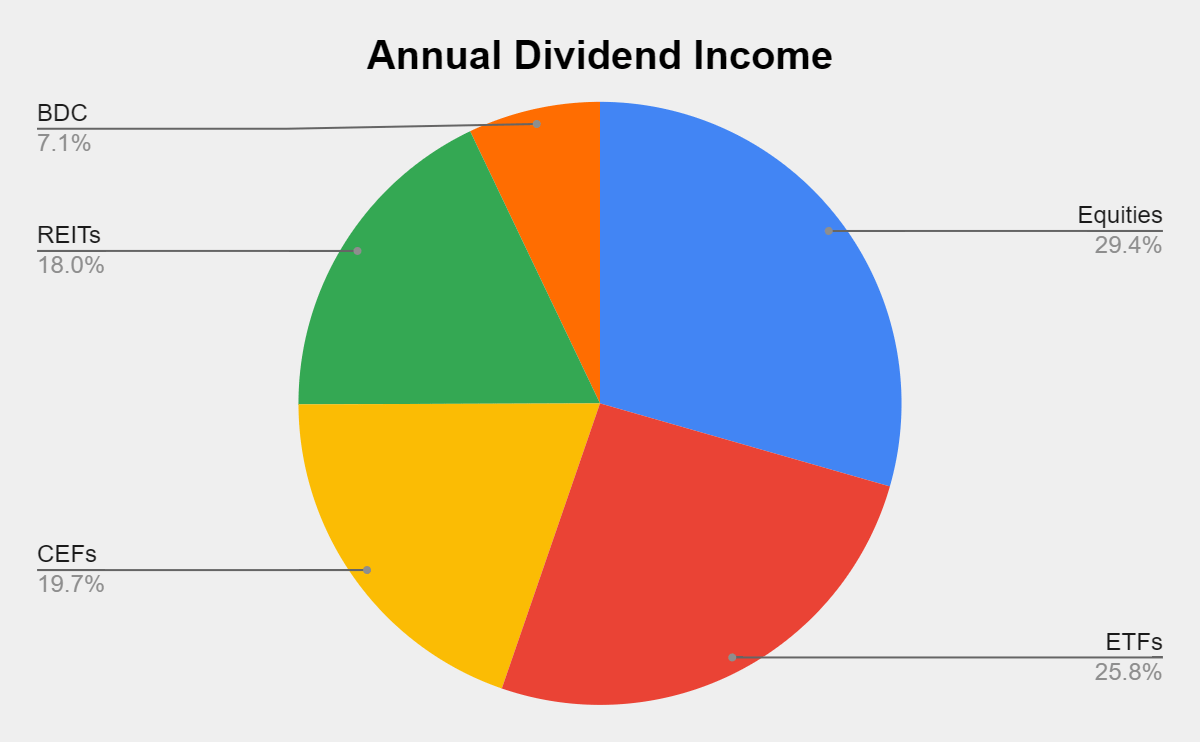
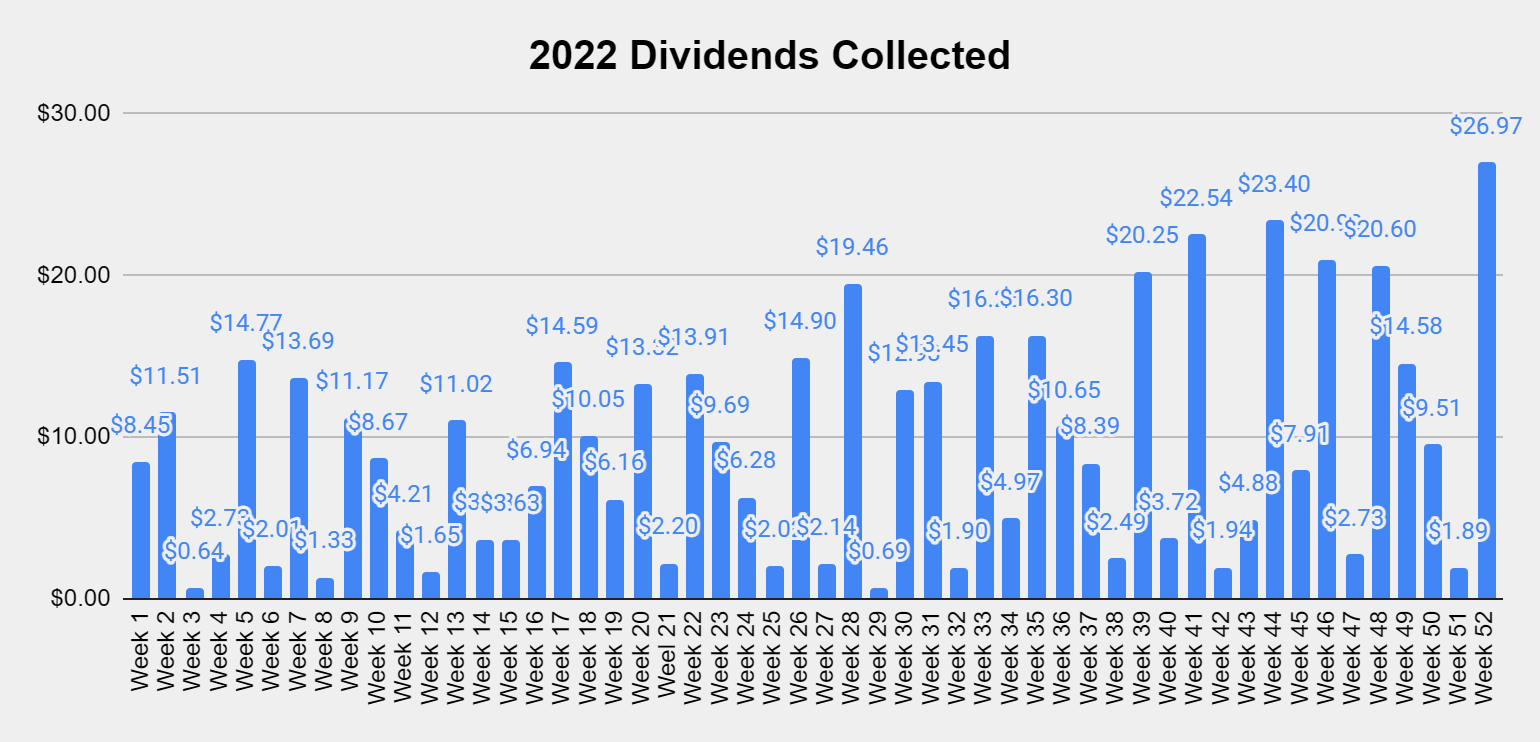
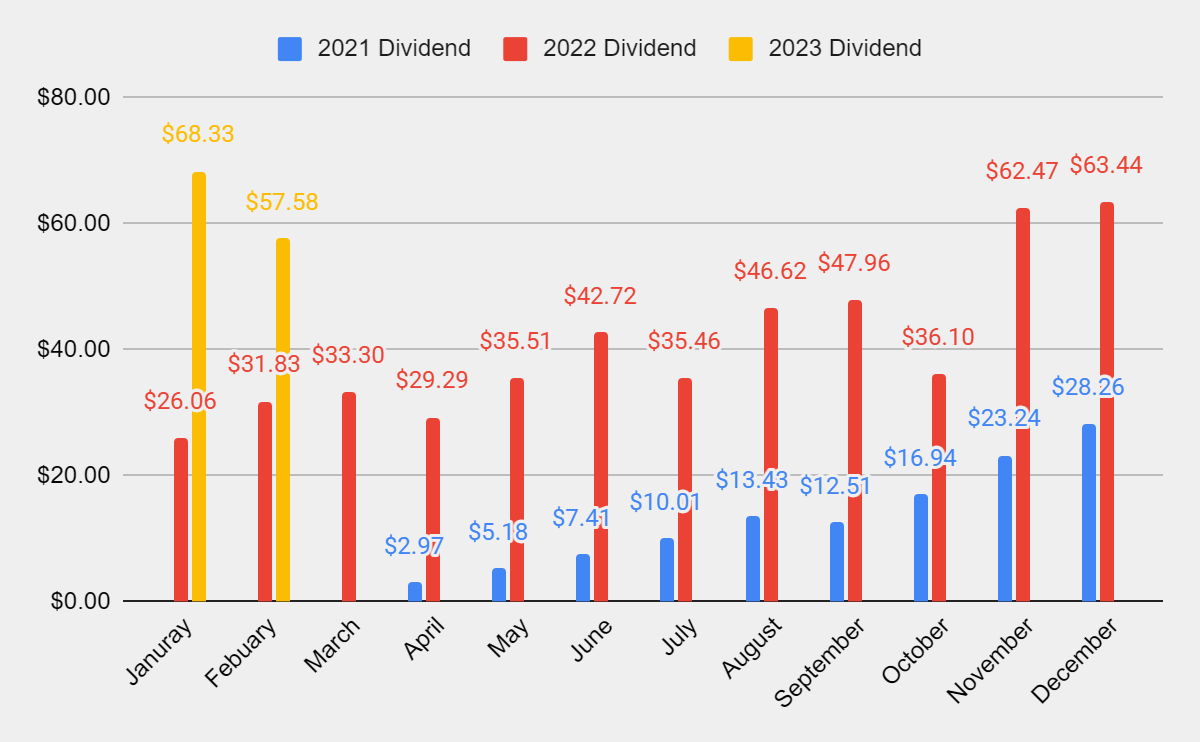
Collecting dividends can serve many functions in a portfolio. Some investors utilize dividends to supplement their income and live off. I'm building a dividend portfolio for myself 30 years into the future. In 2022, I collected $490.76 in dividend income from 533 dividends. This has allowed the Dividend Harvesting portfolio to stay in the black while growing the snowball effect. In week 10 of 2023, I collected $18.22 in dividends, and in 2023 I generated $167.22 in dividend income. YTD I have generated 34.07% of my 2022 dividend income from 122 dividends which is 22.89% of the dividends generated throughout 2022.
These dividends allow me to gain additional equity in my investments while increasing my future cash flow in down markets. This style of investing isn't for everyone, but if you're looking to generate consistent cash flow while mitigating downside risk, this method has worked for me. I'm hoping to collect around $1,000 in dividends in 2023, which will be reinvested.
February finished with $57.58 of dividend income, and in a few weeks, the March numbers will be in. Should I add the current numbers for March or wait until the month closes on the chart?
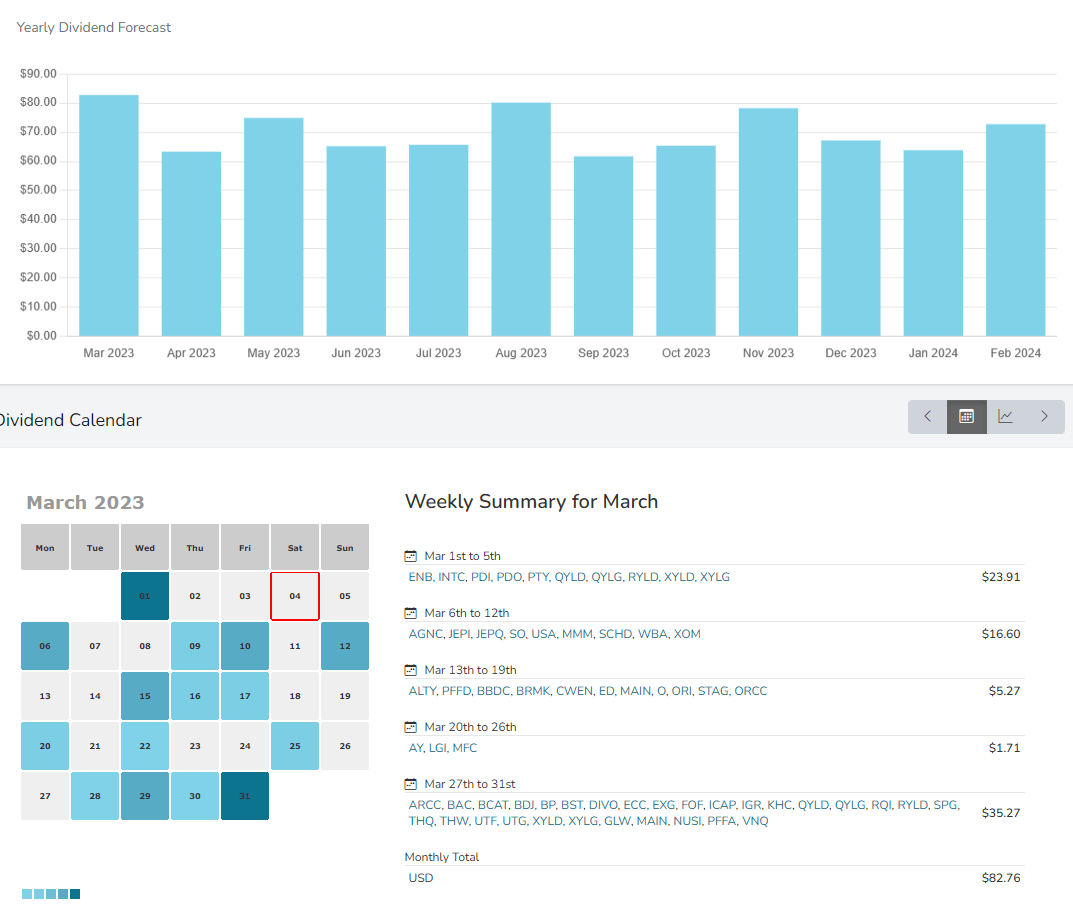
I found a tool that can track and visualize my monthly and weekly dividend income. I plan on showing this graph rather than the full year as it's a better visualization than what I had created. In week 105, my total annual dividend count remained 632, and there was dividend income being generated each week. There are dividends coming in around the clock, as March has 15 days of dividend income being generated.
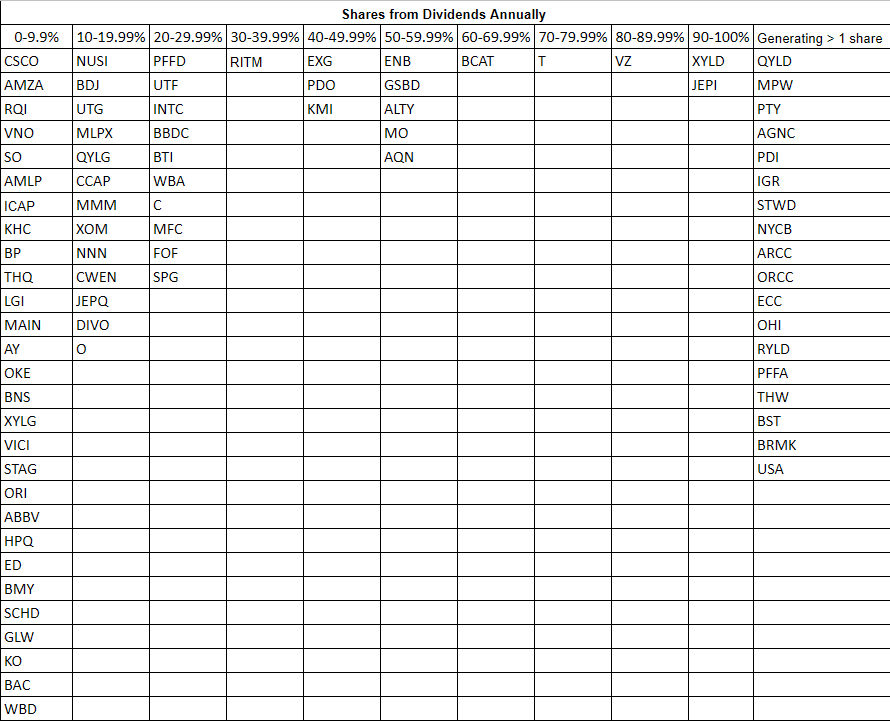
The goal of generating enough income from the dividends to purchase an additional share per year has been the never-ending project of this portfolio. I will be working on moving several of these positions to the last column over the next several months.
The Dividend Harvesting Portfolio composition
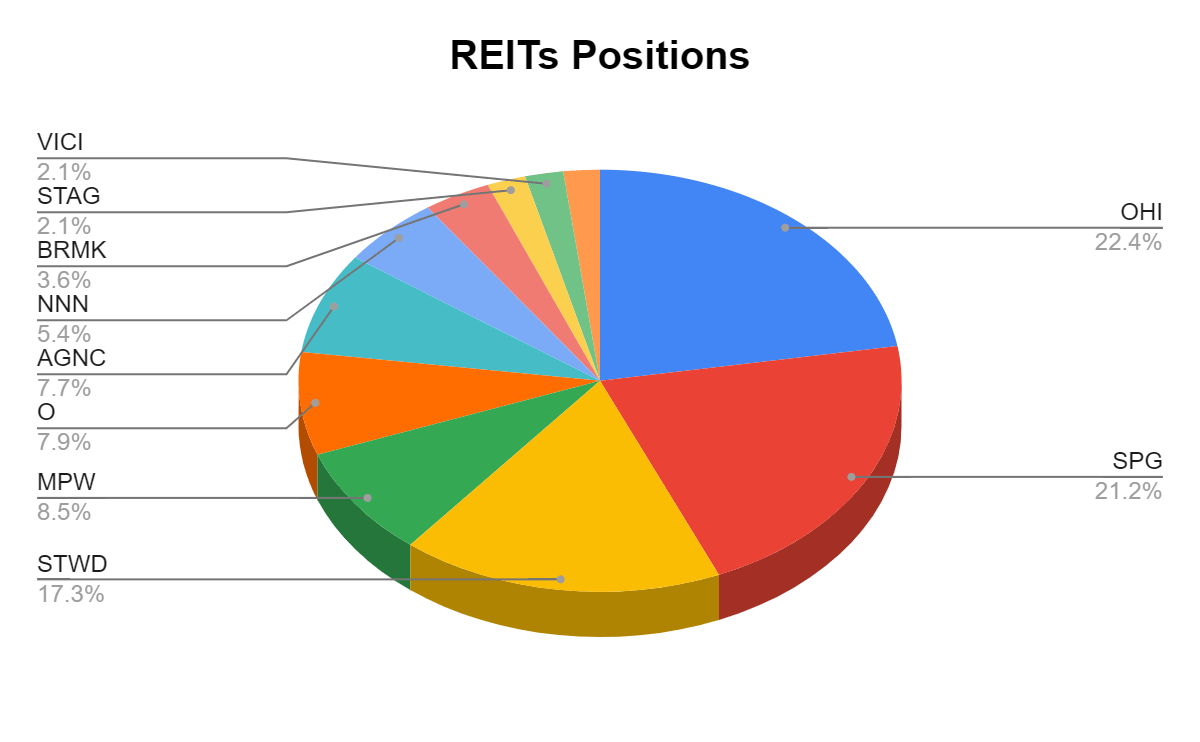
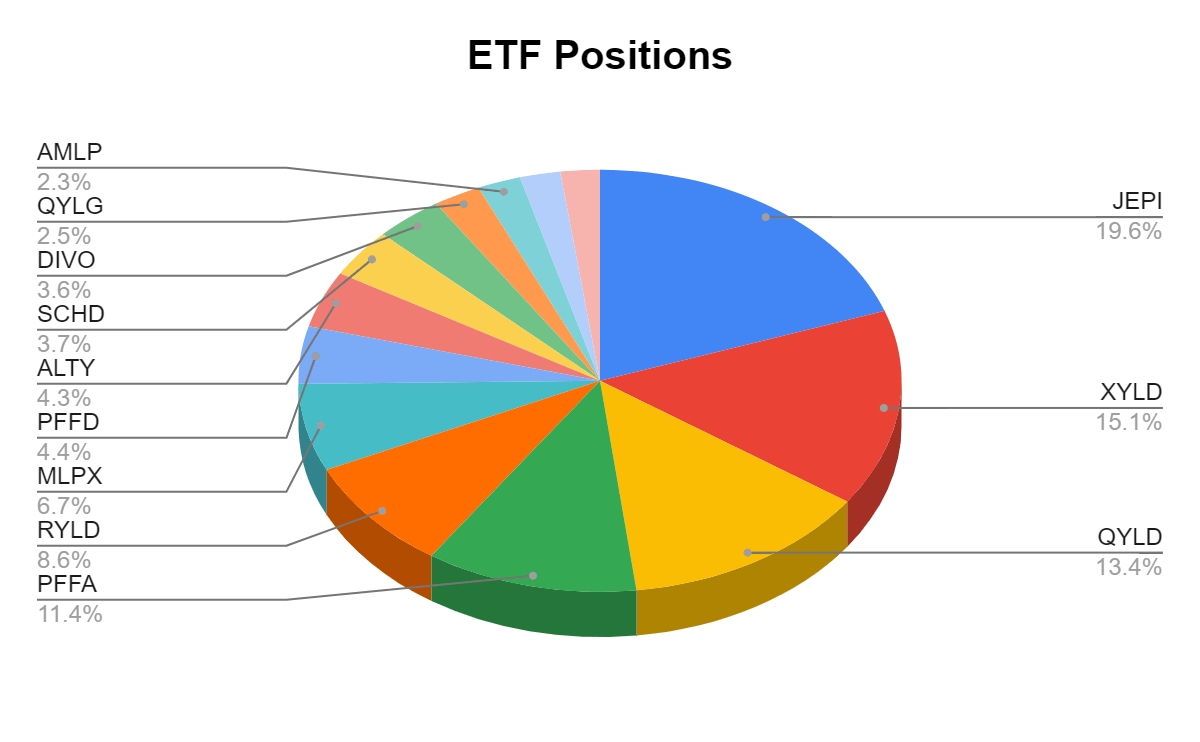
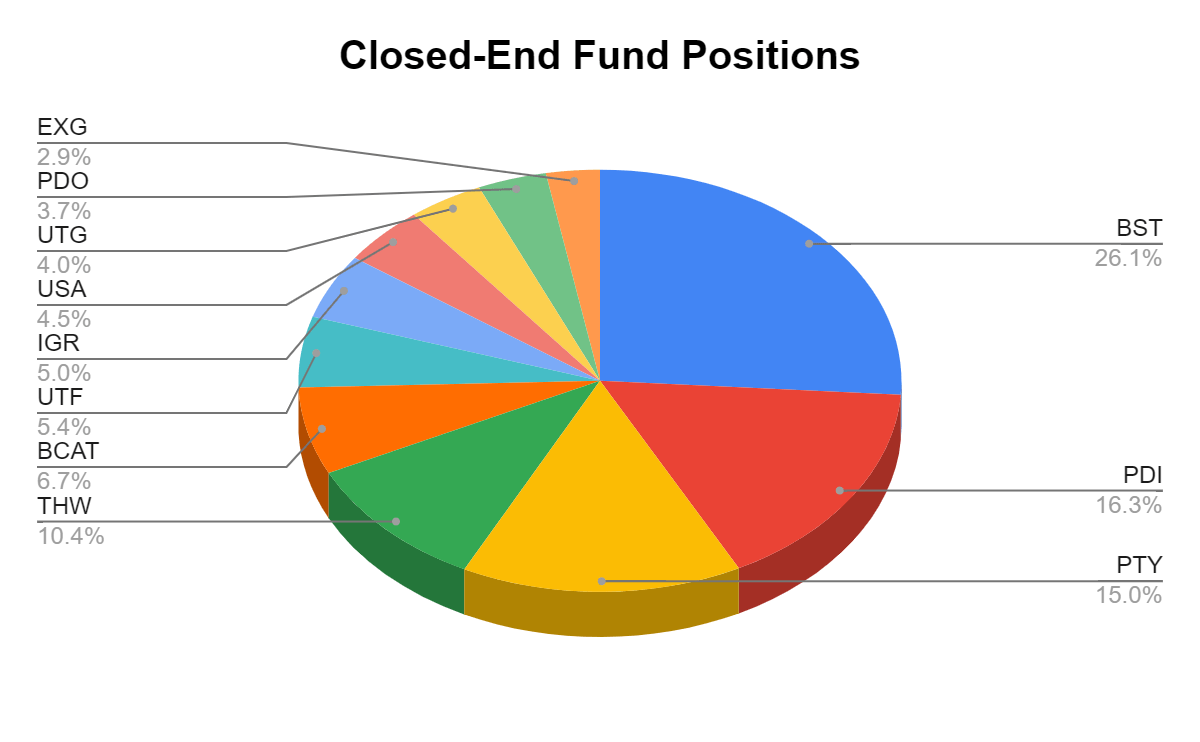
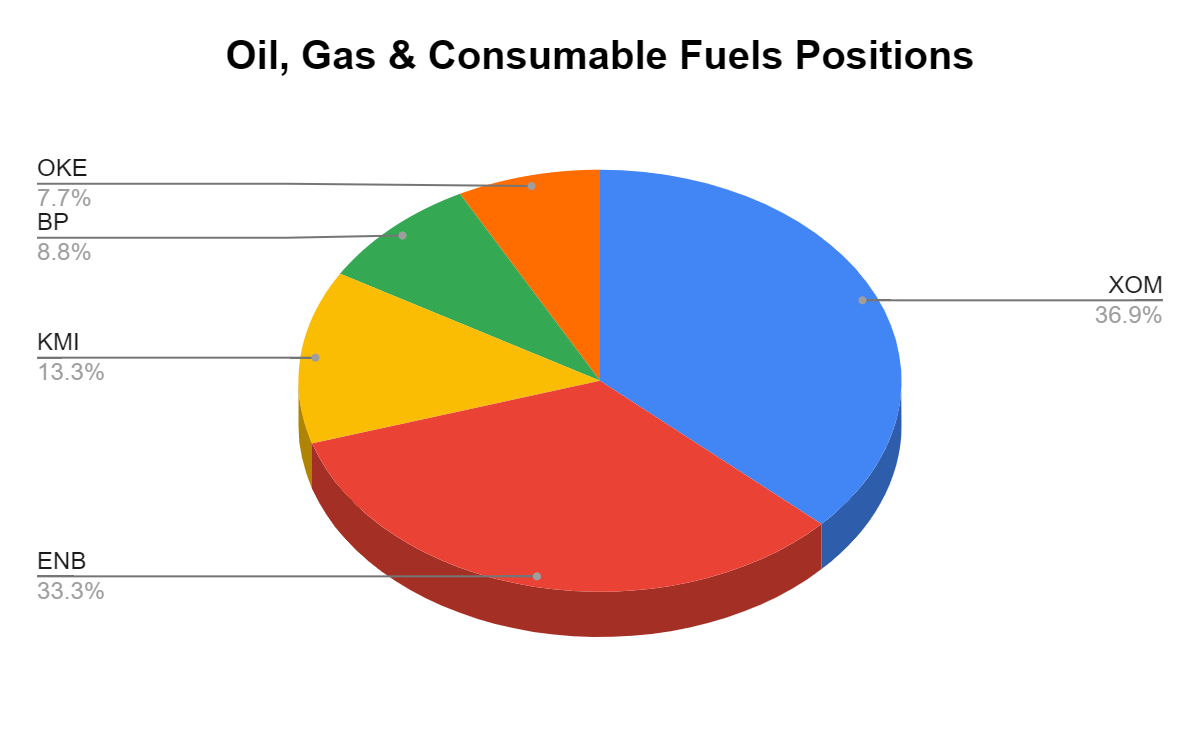
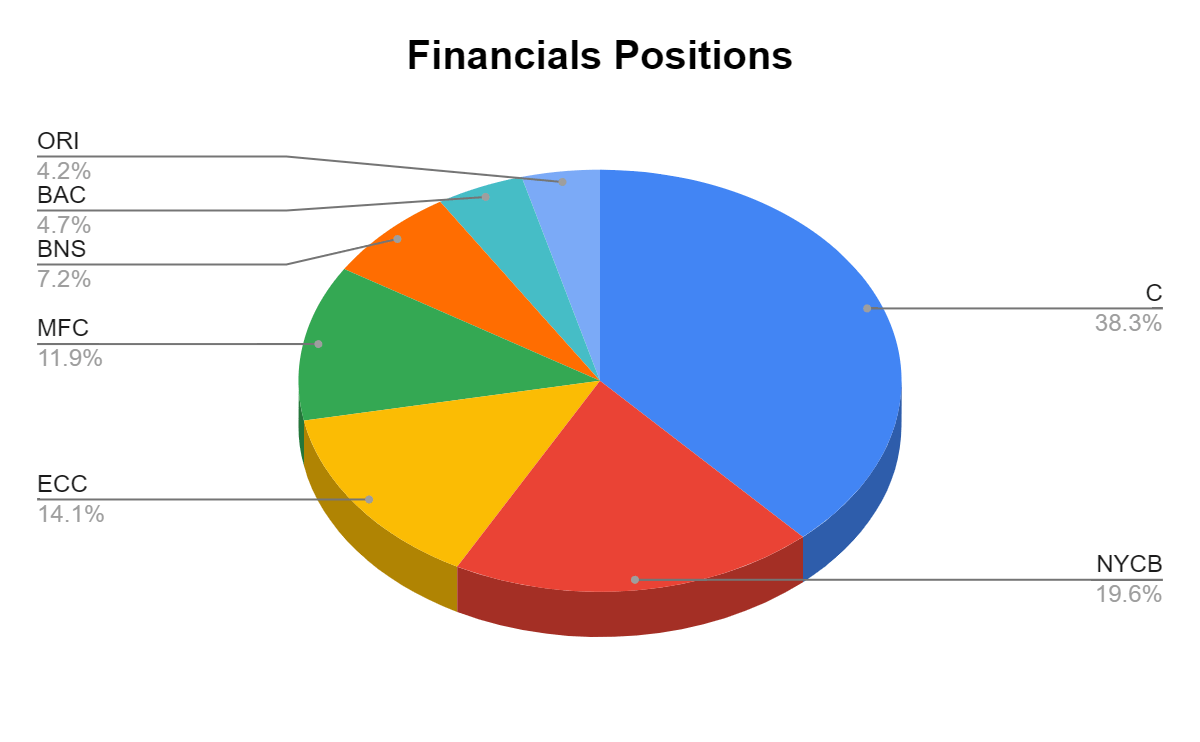
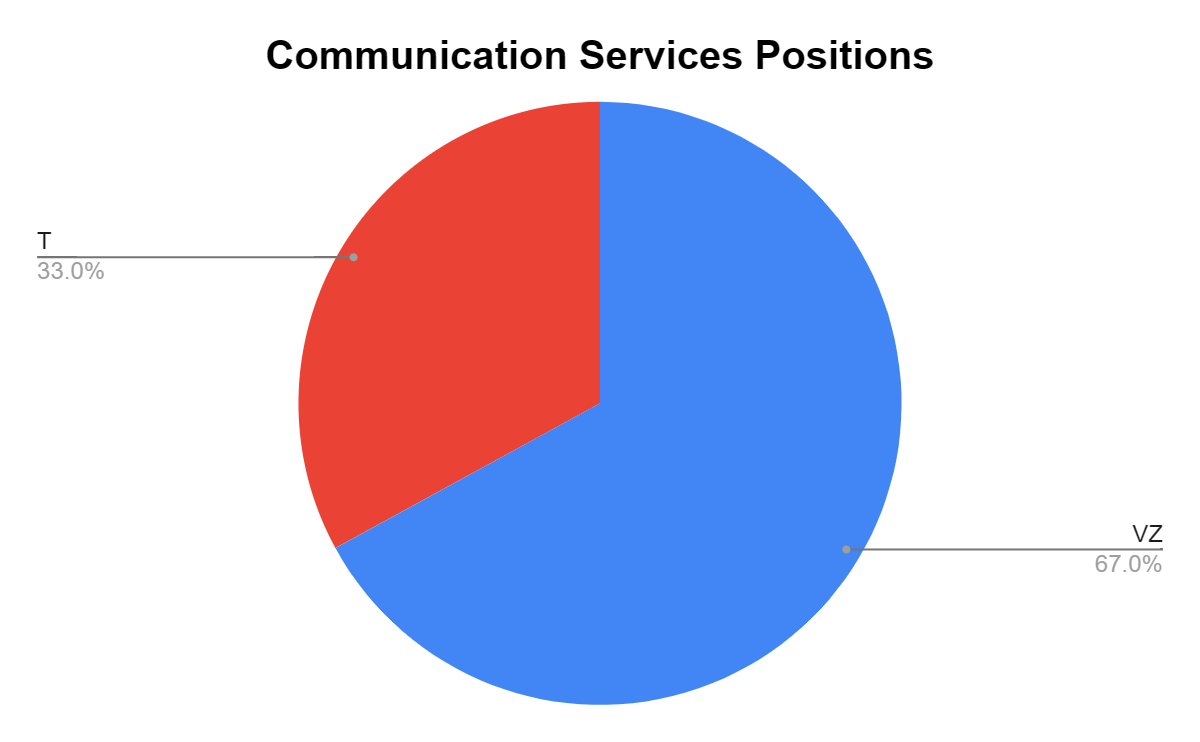
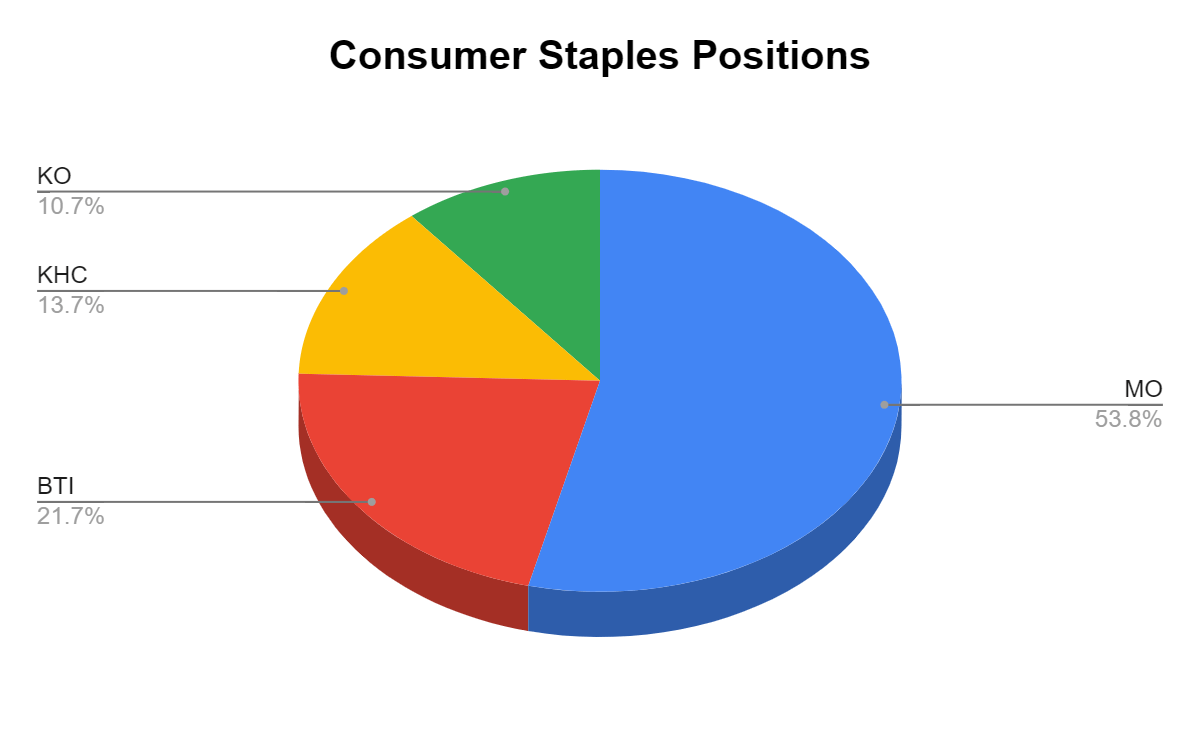
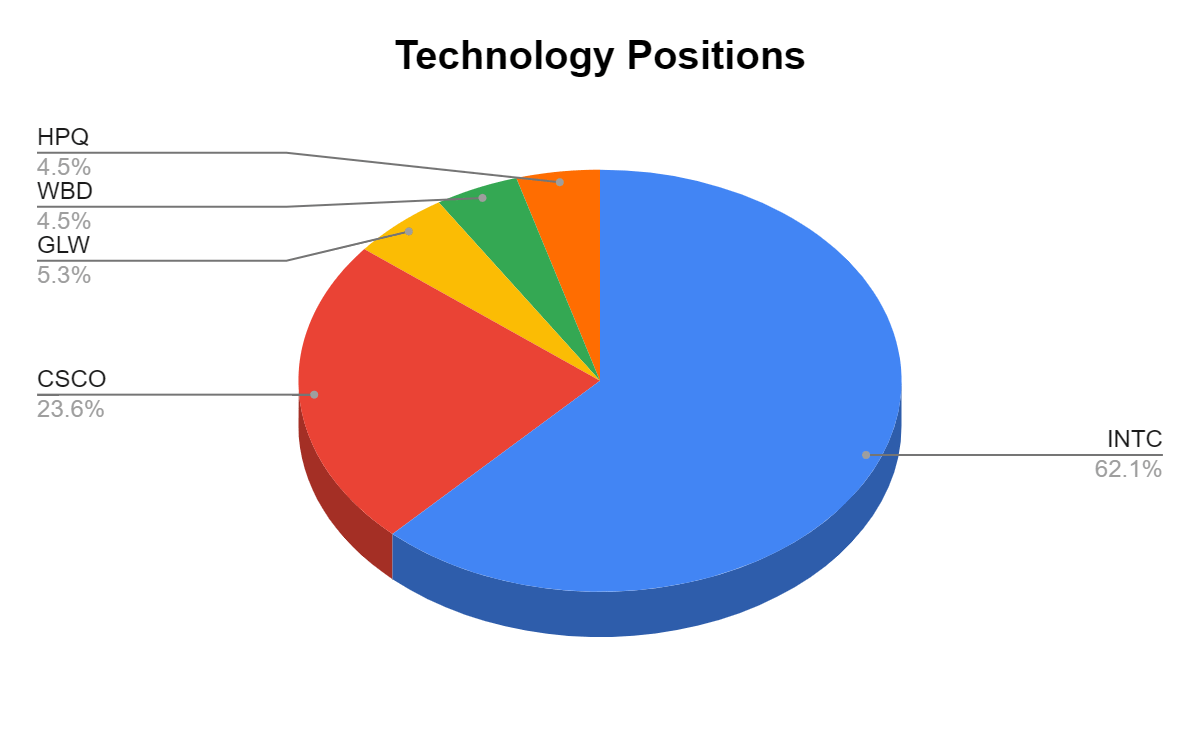
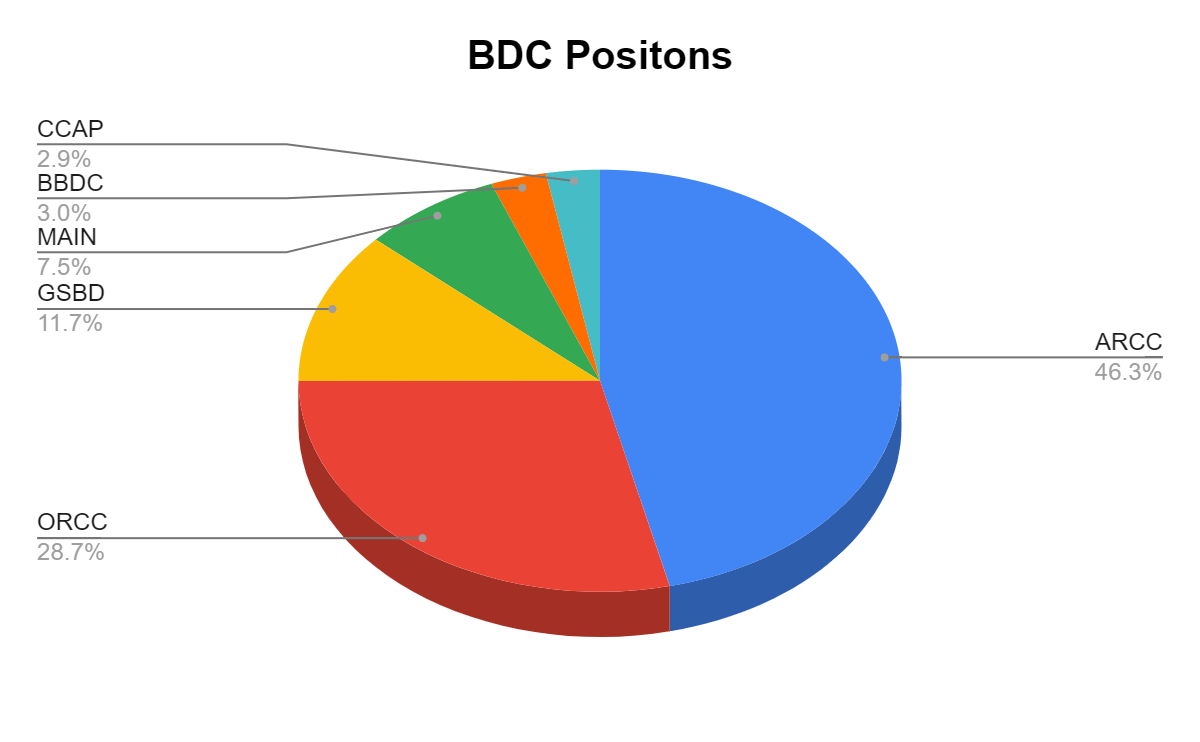
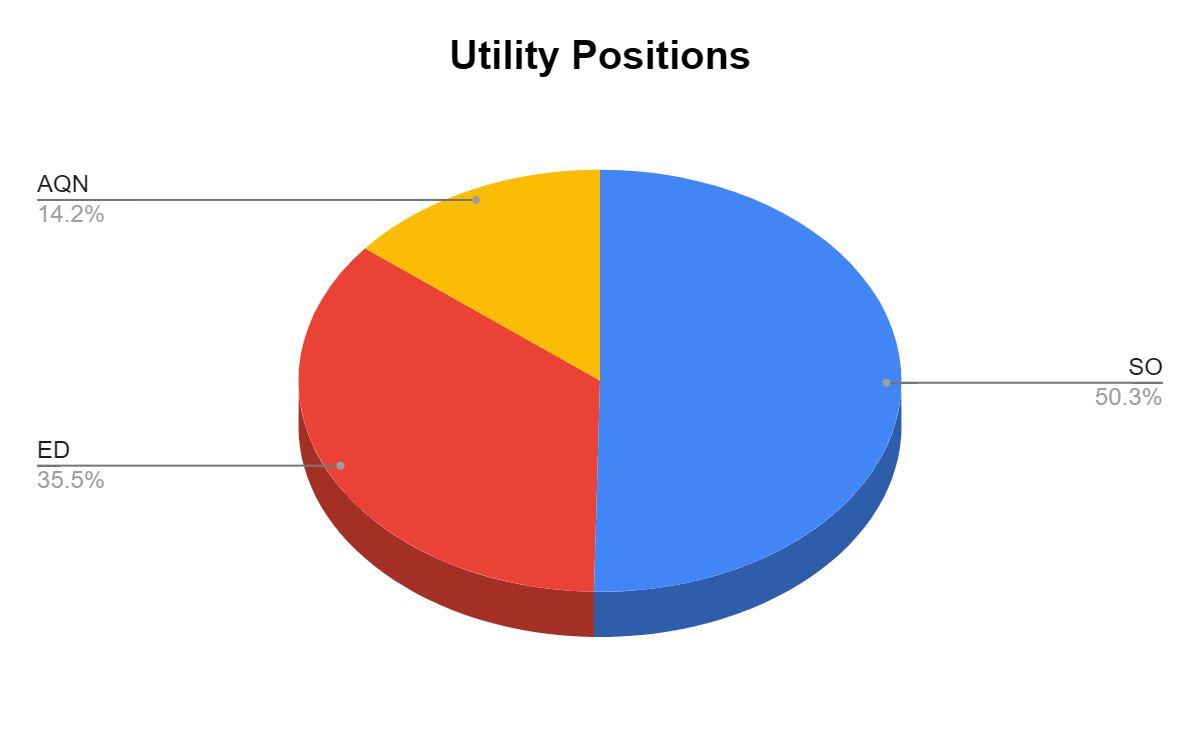
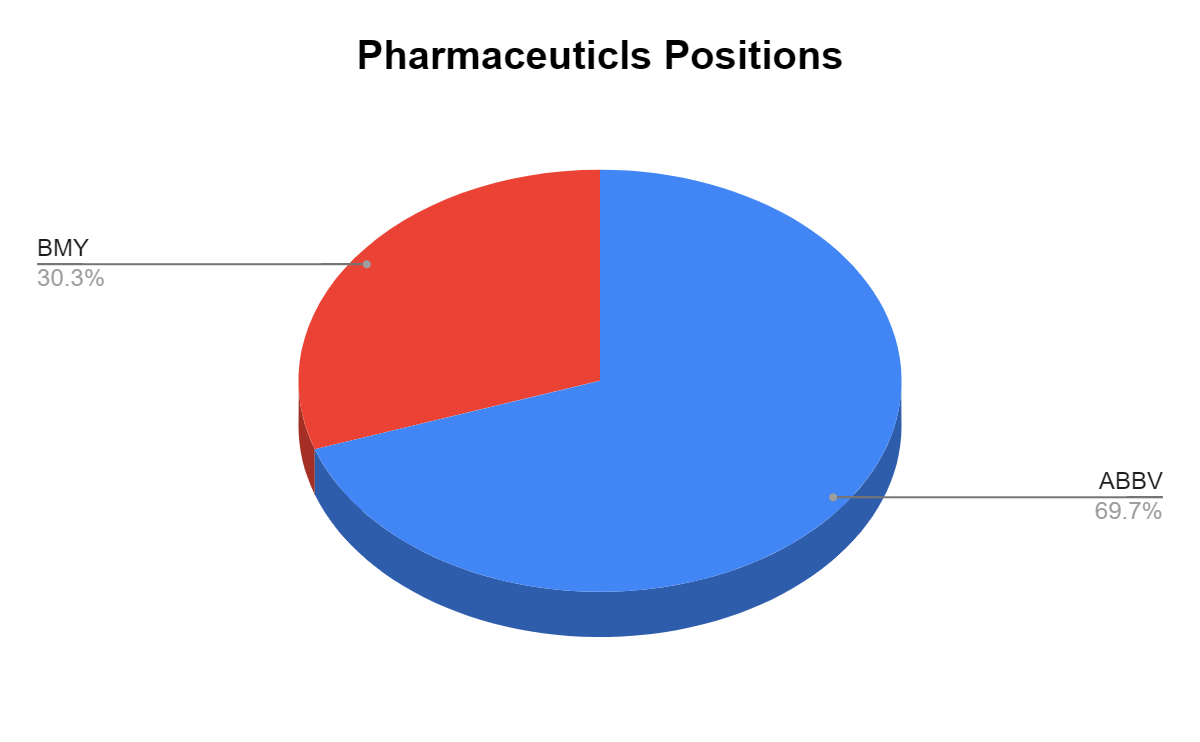
Many of the readers have asked if I could break down the individual positions within these sectors. I created pie charts for each individual sector and have illustrated how much each position represents of that sector of the Dividend Harvesting portfolio. Since I only have one position in Food & Staple Retailing and Industrials, I did not make a chart for those. 3M ( MMM ) and Walgreens Boots Alliance ( WBA ) represent 100% of those sectors. The charts will follow the normal portfolio total I have constructed. Please keep the ideas coming, as I am happy to add as much detail to this series as I can.
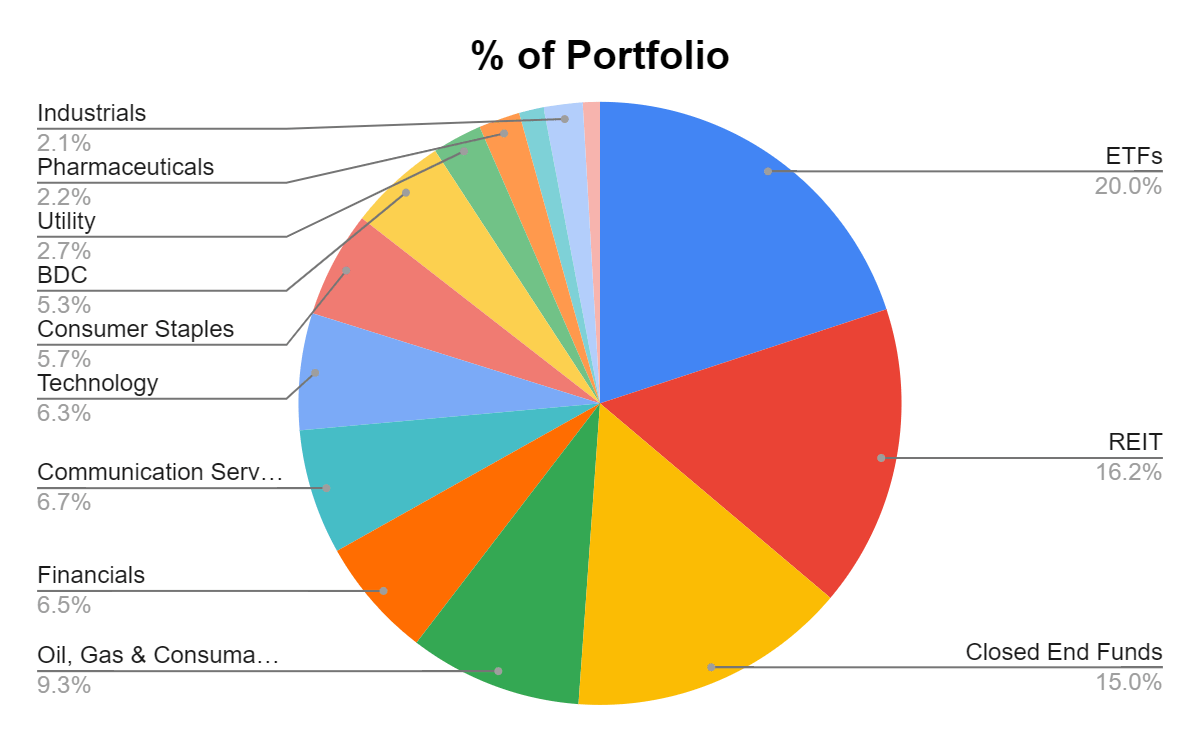
In week 106, ETFs remained the largest section of the Dividend Harvesting Portfolio's composition. Individual equities make up 43.57% of the portfolio and generate 29.44% of the dividend income, while exchange-traded funds ("ETFs"), closed-end funds ("CEFs"), real estate investment trusts ("REITs"), business development companies ("BDCs"), and exchange-traded notes ("ETNs") represent 56.43% of the portfolio and generate 71.56% of the dividend income.
I have a 20% maximum sector weight, so when a singular sector gets close to that level, I make sure capital is allocated away from that area to balance things out. In 2022, I will make an effort to even out these portfolio percentages. As more capital is deployed, the bottom half of the portfolio weighting will increase.
| Industry |
| Investment |
| Portfolio Total |
| % of Portfolio |
| ETFs |
| $2,032.75 |
| $10,192.93 |
| 19.94% |
| REIT |
| $1,651.51 |
| $10,192.93 |
| 16.20% |
| Closed End Funds |
| $1,526.27 |
| $10,192.93 |
| 14.97% |
| Oil, Gas & Consumable Fuels |
| $945.02 |
| $10,192.93 |
| 9.27% |
| Financials |
| $657.23 |
| $10,192.93 |
| 6.45% |
| Communication Services |
| $683.49 |
| $10,192.93 |
| 6.71% |
| Technology |
| $637.87 |
| $10,192.93 |
| 6.26% |
| Consumer Staples |
| $579.56 |
| $10,192.93 |
| 5.69% |
| BDC |
| $537.32 |
| $10,192.93 |
| 5.27% |
| Utility |
| $271.95 |
| $10,192.93 |
| 2.67% |
| Pharmaceuticals |
| $225.19 |
| $10,192.93 |
| 2.21% |
| Food & Staple Retailing |
| $134.67 |
| $10,192.93 |
| 1.32% |
| Industrials |
| $212.80 |
| $10,192.93 |
| 2.09% |
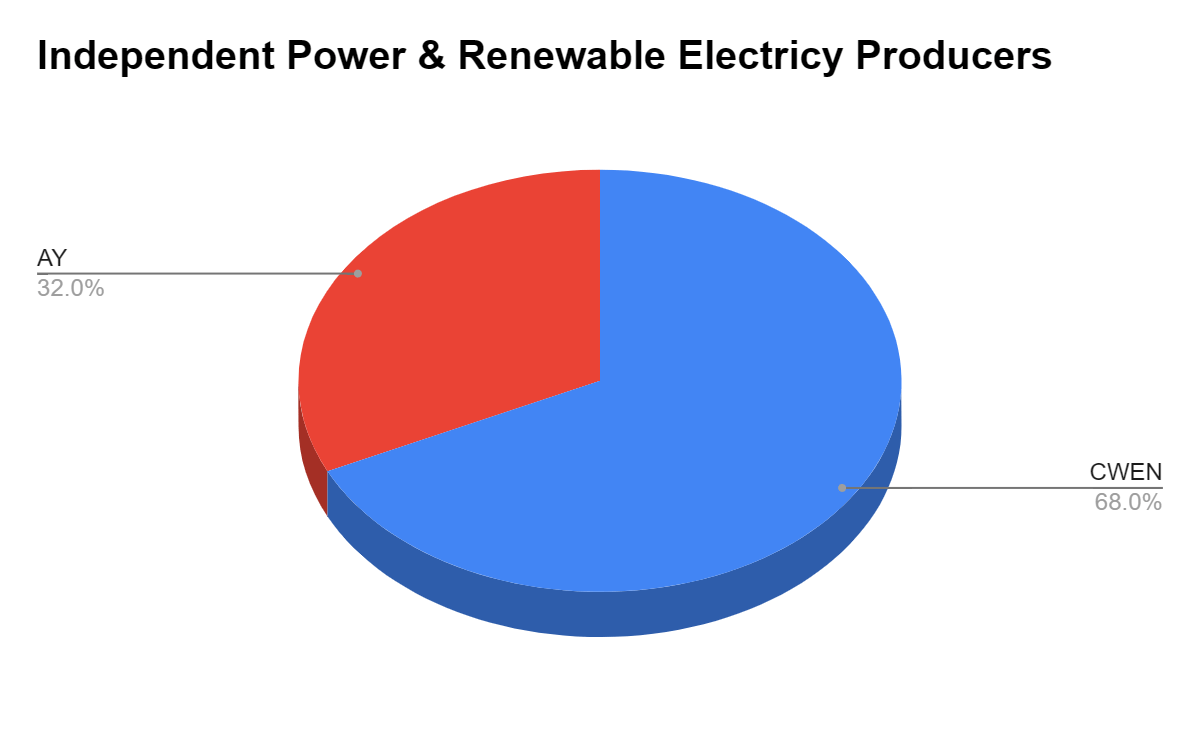
| Independent Power & Renewable Electricity Producers |
| $93.50 |
| $10,192.93 |
| 0.92% |
| Cash |
| $1.87 |
| $10,192.93 |
| 0.02% |
Well, in week 106, I added another share of VZ even though I said I wasn't going to. VZ is back to representing 4.5% of the portfolio.
Week 106 Additions
In week 106, I added 1 share to each of the following positions:
- Verizon ( VZ )
- Medical Properties Trust ( MPW )
- New York Community Bank ( NYCB )
- Reaves Utility Income Fund ( UTG )
- PIMCO Dynamic Income Fund ( PDI )
Verizon
- VZ crossed over the 7% yield mark, and I couldn't resist. I also wrote a dedicated article on why I feel VZ is undervalued which can be read here .
Medical Properties Trust
- MPW continues to fall as the shorts pile in. There have been no releases about a dividend cut, so I will keep buying as my analysis is that it's very undervalued, especially with a tangible book value of $14.38
New York Community Bank
- NYCB had a tough week, and I added again to this regional. With the recent headlines about the Silicon Valley Bank, a run on regionals could occur so, there could be significant volatility with NYCB in the coming weeks.
Reaves Utility Income Fund
- I also wrote an article on UTG which can be read here . I think UTG is interesting, and I dollar cost averaged into this position as the yield crossed over the 8% mark.
PIMCO Dynamic Income Fund
For further details see:
Dividend Harvesting Portfolio Week 106: $10,600 Allocated, $825 In Projected Dividends