MO - Dividend Harvesting Portfolio Week 111: $11100 Allocated $917.46 In Projected Dividends
2023-04-20 09:00:00 ET
Summary
- The Dividend Harvesting Portfolio is now generating $917.46 in annual dividends, yielding 8.25%.
- The Dividend Harvesting portfolio has a 68.47% record of finishing the week in the black since its inception, 75/110 weeks.
- In week 111 I added to STWD, MO, PDI, and SLG.
It was an interesting week as the S&P 500 appreciated by 1.51%, and the Nasdaq increased by 1.48%. The CPI data was released, and inflation slowed for the 9 th consecutive month to 5%. The Dividend Harvesting Portfolio took a $75.51 swing to the upside, putting it in positive territory on invested capital once again. It's also the start of earnings season, so I am excited to see where the market heads. Everything considered, I am happy with the progress, and no matter the direction, I will continue allocating capital toward this portfolio and collecting weekly dividends along the way.
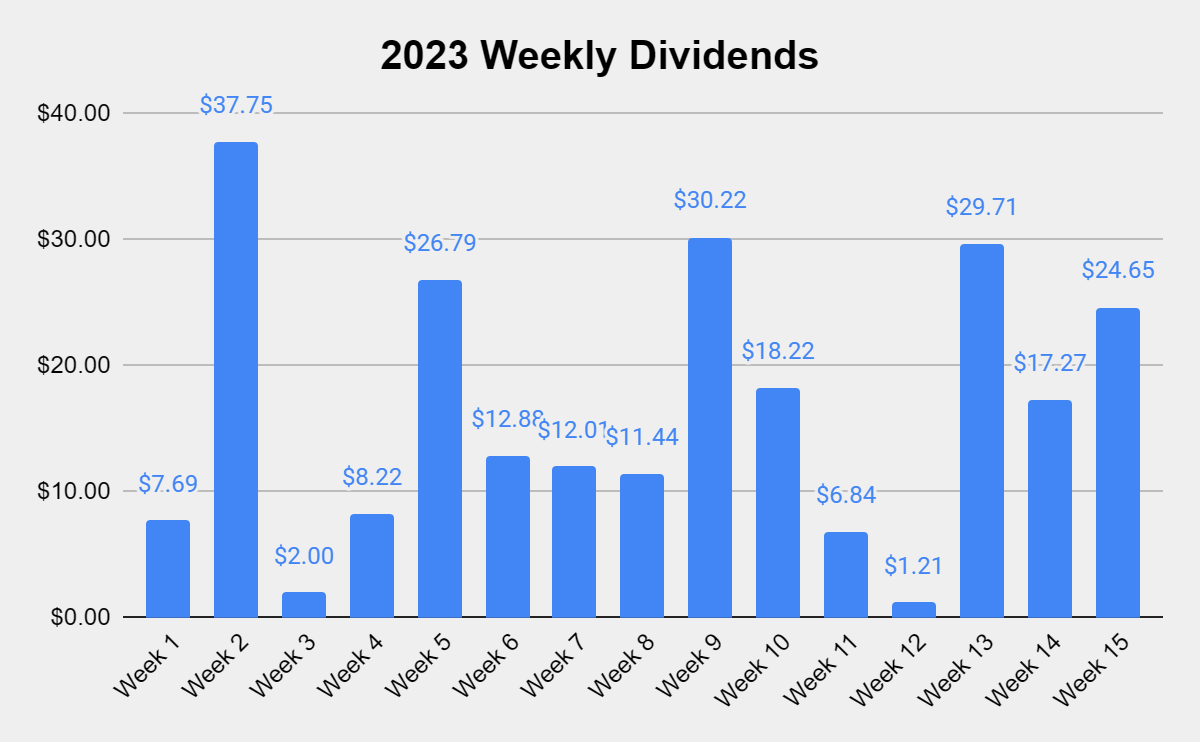
After 111 weeks and $11,100 allocated, the balance of the Dividend Harvesting Portfolio is $11,122.43. The account is up $22.43 or 0.20% on invested capital. In the 2nd week of April, I collected $24.65 in dividend income bringing 2023's total dividend income generated to $246.90. In week 111, I added 1 share to each of the following positions, Altria Group (MO), Starwood Property Trust (STWD), SL Green Realty (SLG), and the PIMCO Dynamic Income Fund (PDI). In week 111, my projected annual dividend income increased by $14.23 or 1.58% to $917.46, which is a forward yield of 8.25%.
I allocate capital toward big tech, funds, dividends, and growth outside of my retirement accounts. These are not my only investments, but I did open a separate account, so I could easily track and document this series. I intentionally created broad diversification throughout the Dividend Harvesting portfolio so I could benefit from sector rotations and mitigate my downside risk. Investors who are too exposed to growth companies or large-cap tech have gotten crushed as the investment landscape changes. On the growth and tech side of my investments, I'm feeling the pain as some of my favorite companies, including Alphabet ( GOOG , GOOGL ), Amazon ( AMZN ), and Meta Platforms ( META ), have been taken to the woodshed.
I'm going to address a question that continues to surface. I'm not trying to beat the market with this portfolio. I love index funds and am invested in several index funds. I love dividend investing due to the stream of cash flow it generates. I don't want 100% of my assets outside of real estate tied to an S&P index fund. I have created a personal investment strategy that works to achieve my investment goals, and having a stream of income generated from dividends is part of my investment strategy. Low-cost index funds are one of the best investments anyone can make in my opinion, and the Dividend Harvesting portfolio is not meant to be a substitute for an index fund. I have read many questions about dividend investing and wanted to start a portfolio from the ground up and document its progress to disprove many misconceptions, including that you need a large amount of seed capital to make dividend investing work for you.
This series has never been about hitting a target yield, generating a certain amount of profit, or beating the market. I had two specific goals with this series. The first was to create a blueprint for constructing a dividend portfolio by documenting the journey starting from the beginning. The second goal was to illustrate how allocating capital each week toward investing, regardless of the amount, would be beneficial in the long run.
Too many people are under the illusion that you need tens of thousands or even hundreds of thousands to benefit from investing. Instead of using my real dividend portfolio as an example, I decided to start a new account, fund it with $100, and add $100 weekly, providing a step-by-step guide to dividend investing. This methodology doesn't have to be used for dividend investing, and it could be as simple as an S&P index fund or a Total Market fund. Hopefully, this series is inspiring people to invest in their future to attain financial freedom.
A historical recap of the Dividend Harvesting Portfolio's investment principles
Investment Objectives
- Income generation
- Downside mitigation through diversification
- Capital appreciation
Below are the fundamental rules I have put in place for this Portfolio:
- Allocate $100 weekly to this Portfolio
- Only invest in dividend-producing investments
- No position can exceed 5% of the Portfolio
- No sector can exceed 20% of the Portfolio
- All dividends and distributions are to be reinvested
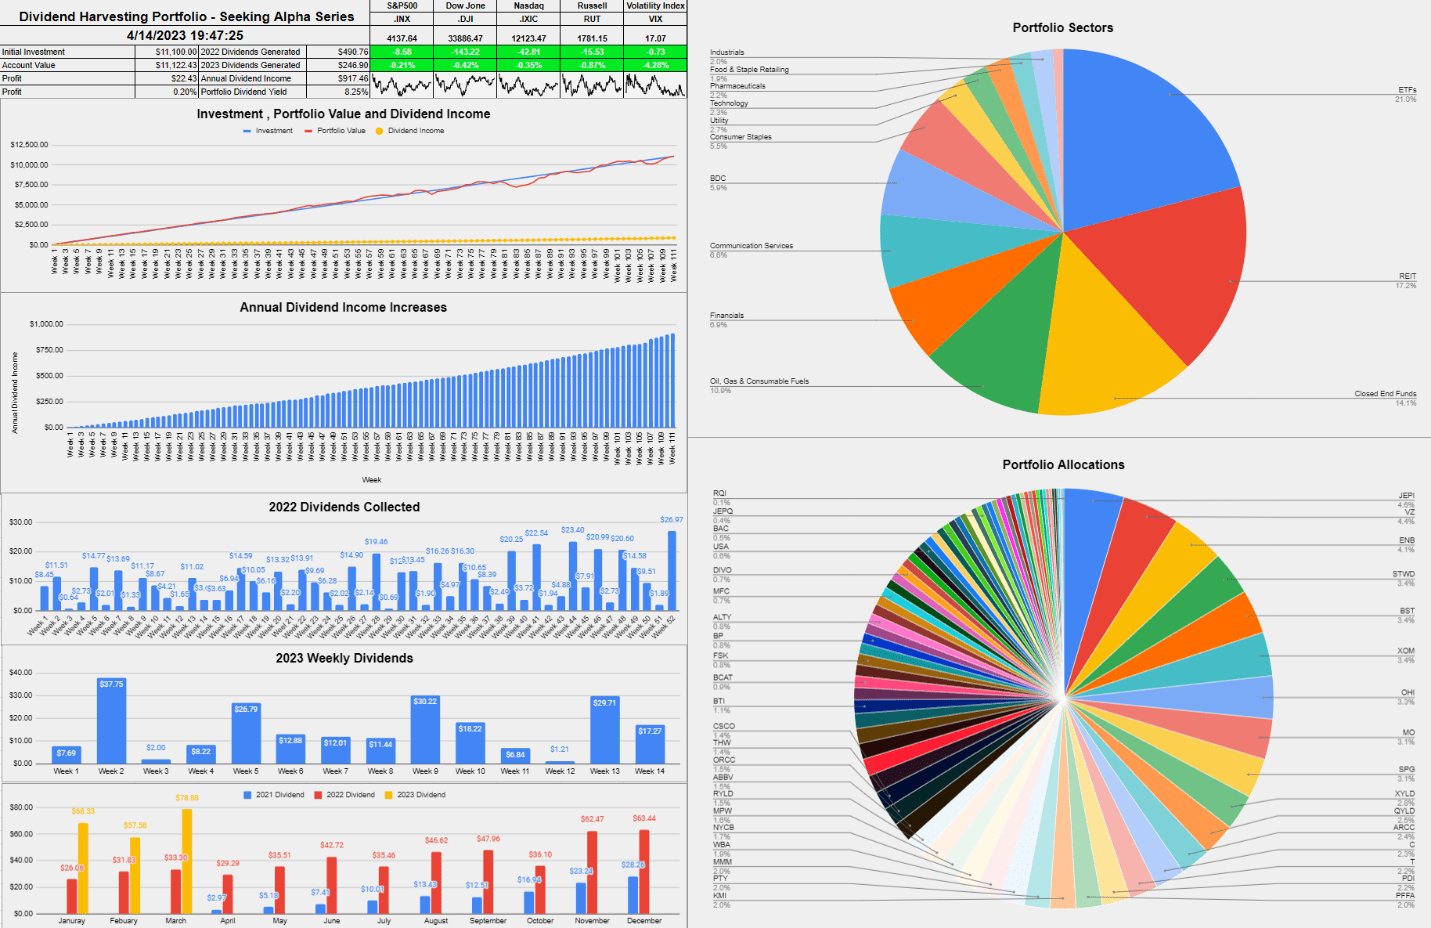
Below is a chart that extends from week 1 through the current week to illustrate the Dividend Harvesting Portfolio's Progression
- Blue line is my initial investment $100 in week 1, $1,000 in week 10, etc.
- Red line is the account value at the end of each week
- Yellow line is the annual dividend income the Dividend Harvesting Portfolio was projected to generate after that week's investments and dividends reinvested
The Dividend Harvesting Portfolio dividend section
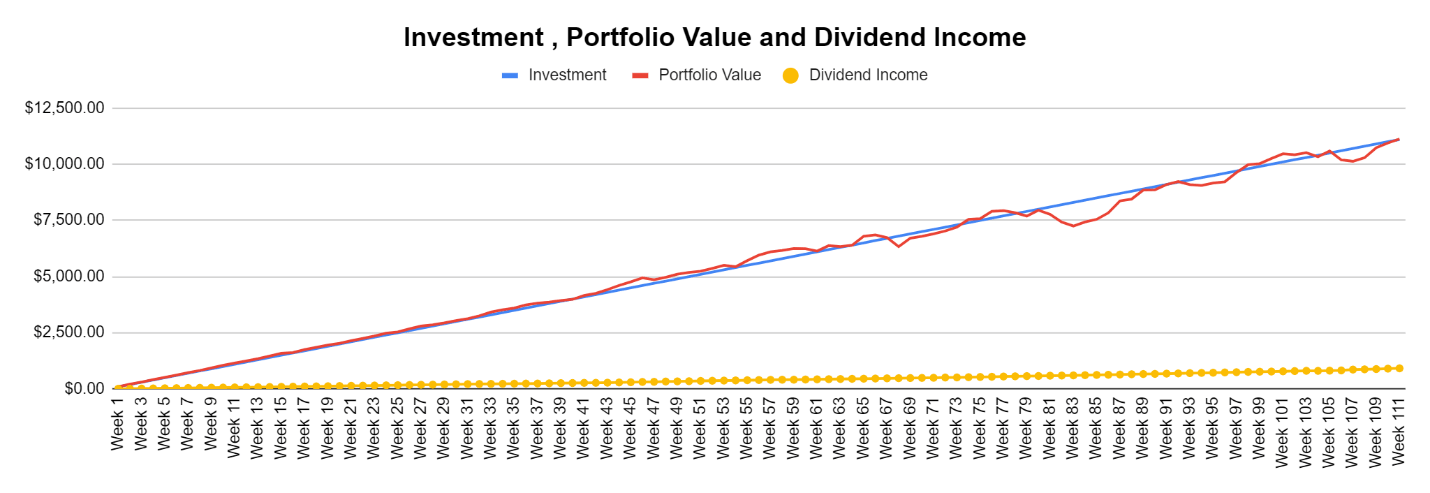
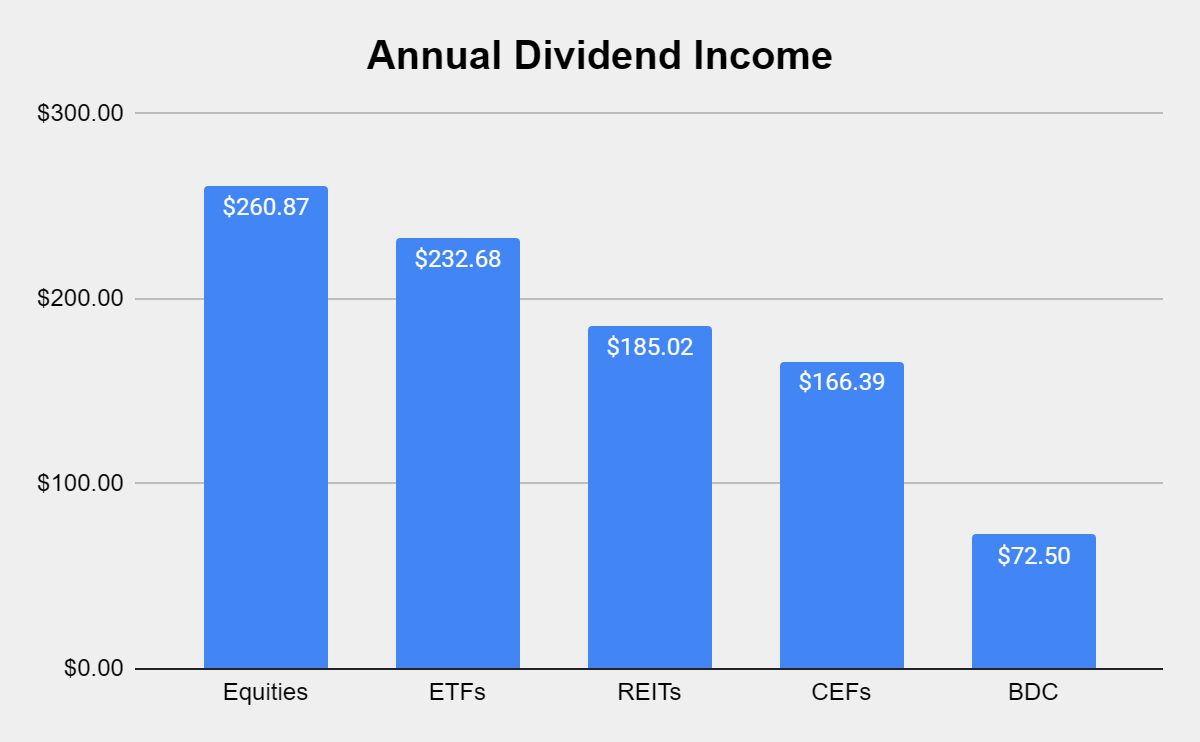
Here's how much dividend income is generated per investment basket:
- Equities $257.07 (28.46%)
- ETFs $232.61 (25.75%)
- REITs $177.77 (19.68%)
- CEFs $163.72 (18.13%)
- BDCs $72.06 (7.98%)
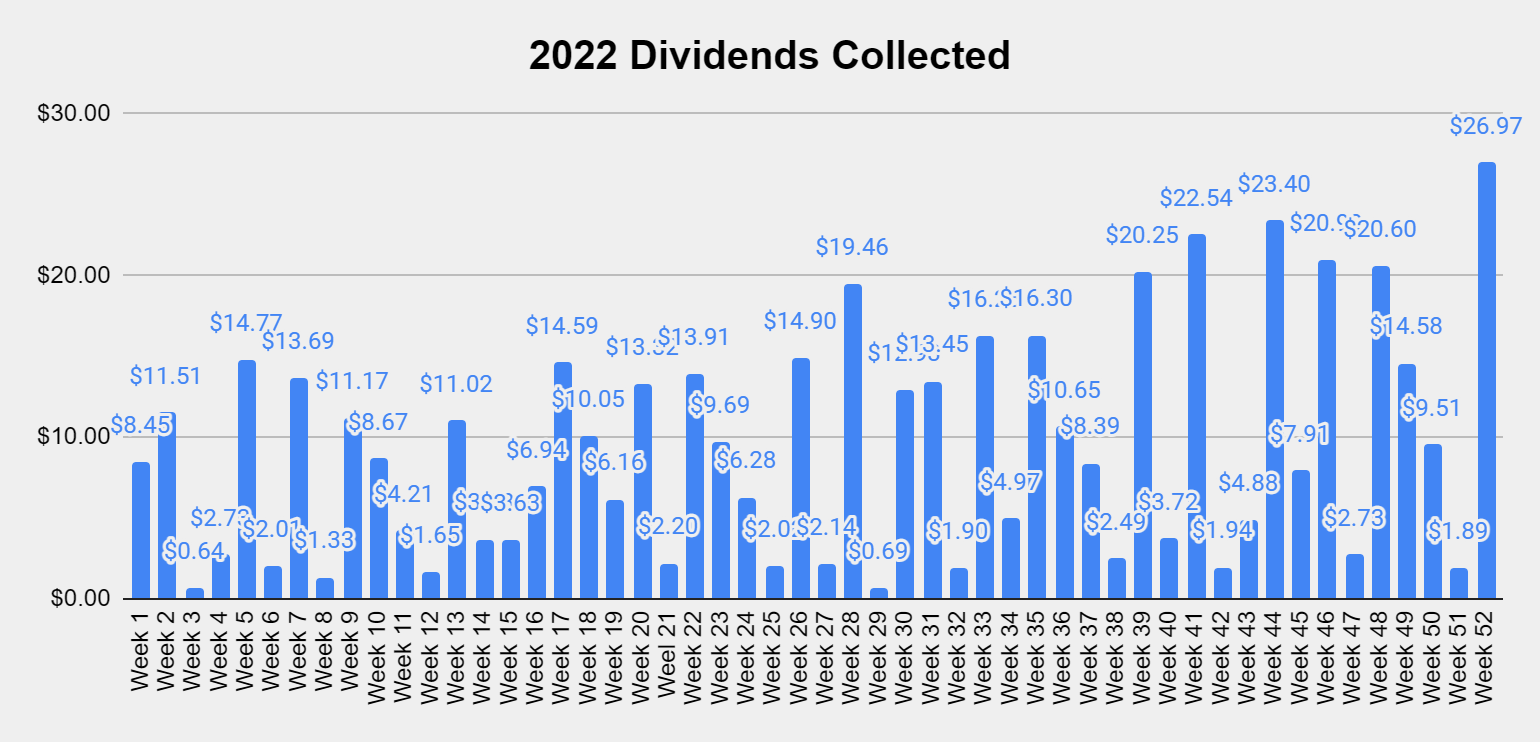
Collecting dividends can serve many functions in a portfolio. Some investors utilize dividends to supplement their income and live off. I'm building a dividend portfolio for myself 30 years into the future. In 2022, I collected $490.76 in dividend income from 533 dividends. In week 14 of 2023, I collected $24.65 in dividends, and in 2023 I generated $246.90 in dividend income. YTD I have generated 50.31% of my 2022 dividend income from 187 dividends which is 35.08% of the dividends generated throughout 2022.
These dividends allow me to gain additional equity in my investments while increasing my future cash flow in down markets. This style of investing isn't for everyone, but if you're looking to generate consistent cash flow while mitigating downside risk, this method has worked for me. I'm hoping to collect around $1,000 in dividends in 2023, which will be reinvested.
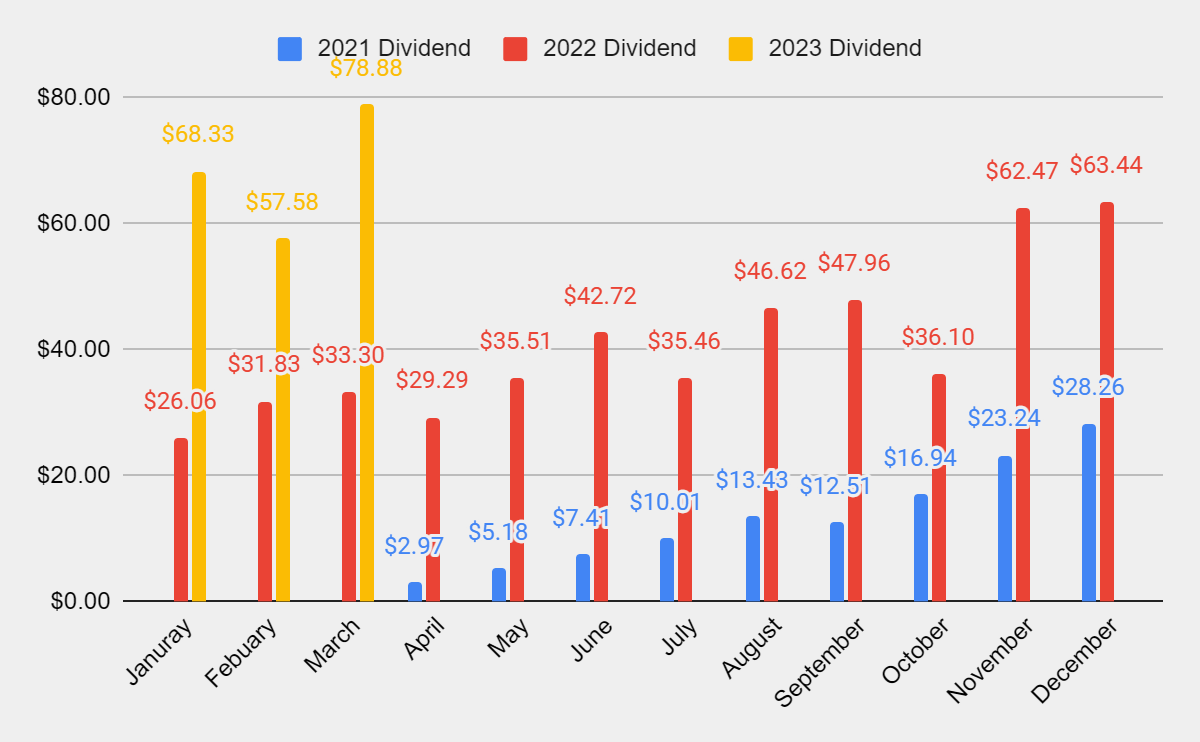
March is over, and it was a record month of dividend income, generating $78.88. YoY March's dividend income has increased by $45.58 or 136.88%. Looking at the graph below, the YoY increase in dividend income has been drastic. I am looking forward to seeing what April brings, as it will be the first month with 3 years of data.
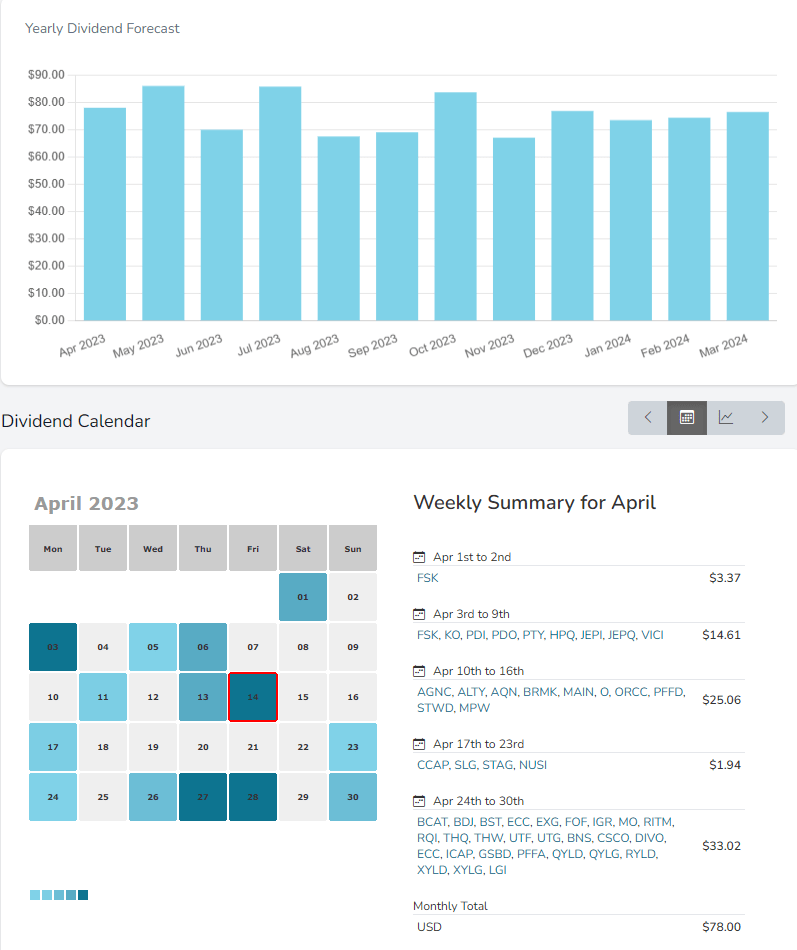
I found a tool that can track and visualize my monthly and weekly dividend income. I plan on showing this graph rather than the full year as it's a better visualization than what I had created. In week 111, I added to existing positions, so the number of dividends generated didn't increase. It's getting very interesting seeing the amount of monthly dividend income being generated and the number of days that dividends are produced. I am currently on track to produce dividends on 14 days during April.
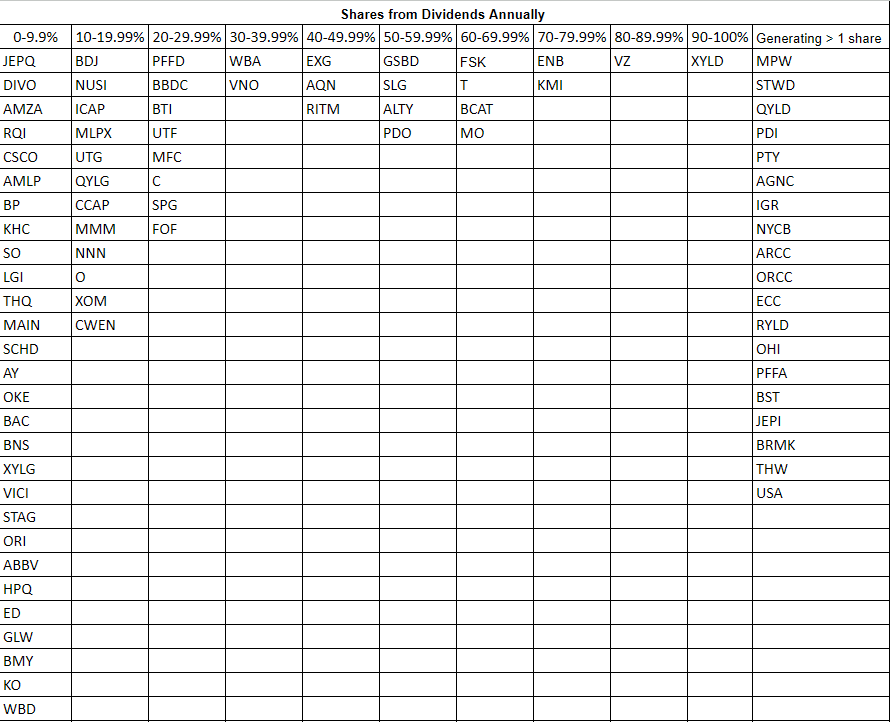
The goal of generating enough income from the dividends to purchase an additional share per year has been the never-ending project of this portfolio. There are now 19 positions generating an additional share per year. I am continuously working on getting more positions over the 100% threshold. I think I can finish 2023 with at least 25-30 positions generating a share per year from their dividends. I added to MO and SLG this week, increasing their position in the grid. I need to start getting some of the positions from the far left over as well. In due time this portfolio will be generating new shares around the clock.
The Dividend Harvesting Portfolio Composition
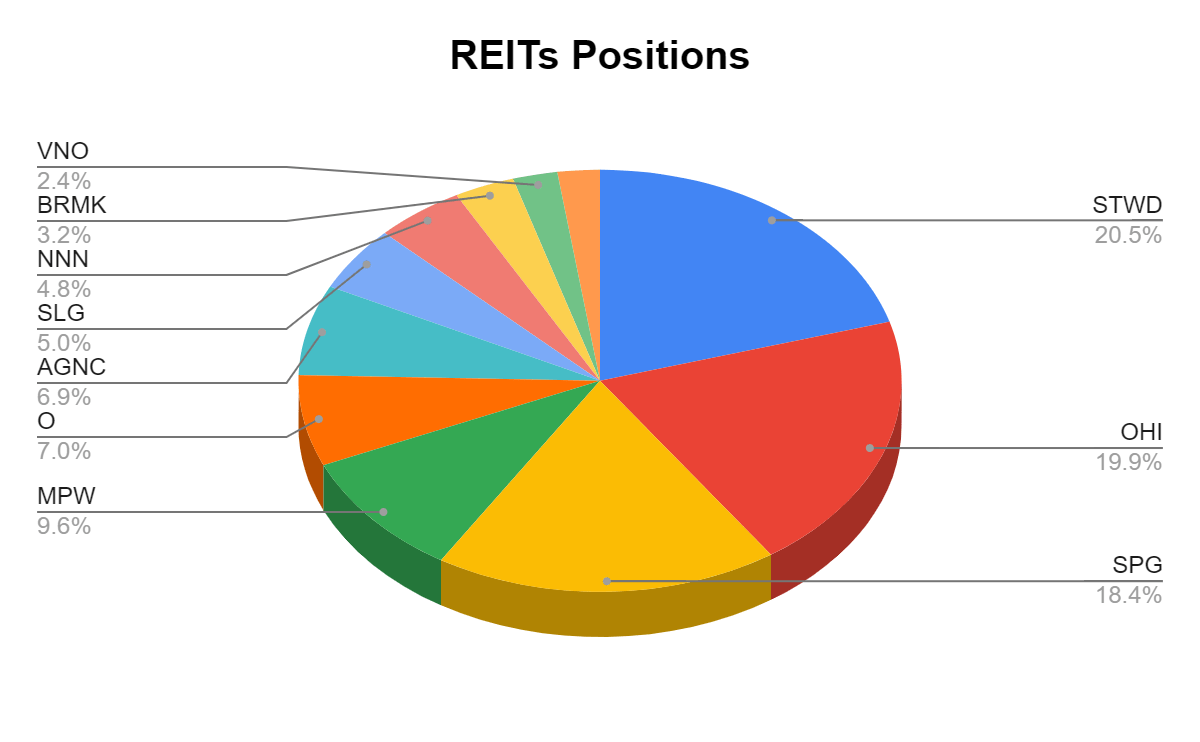
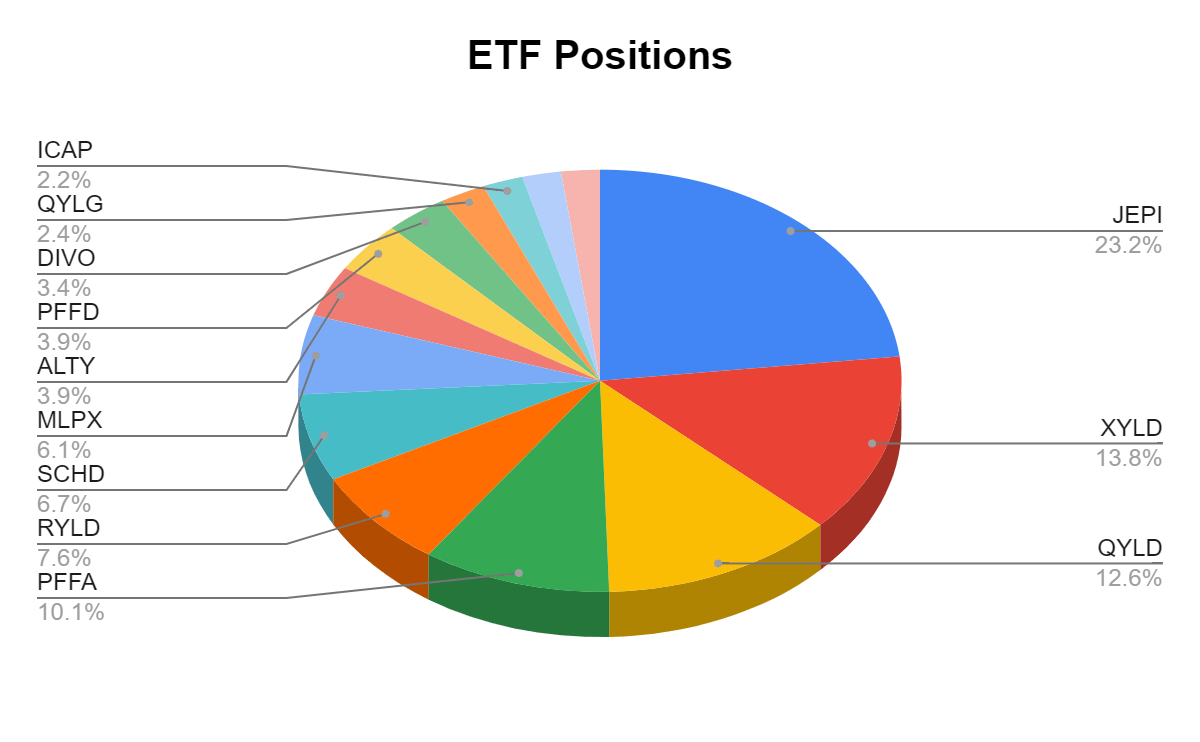
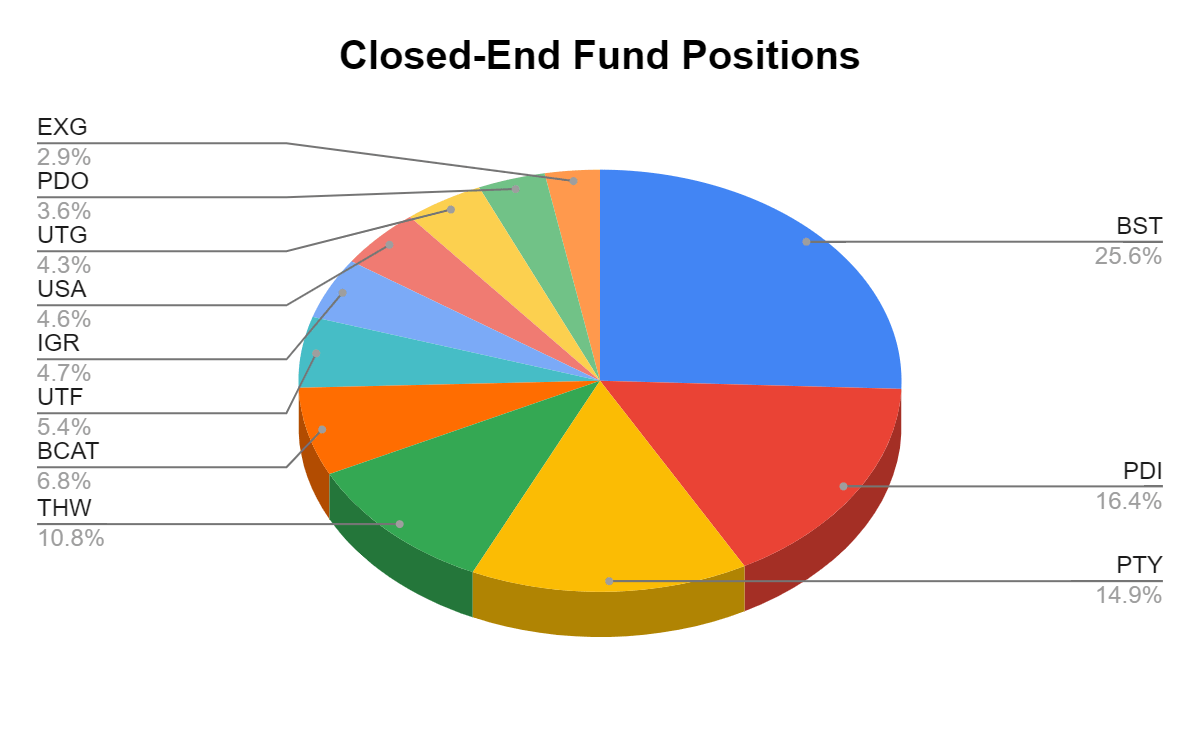
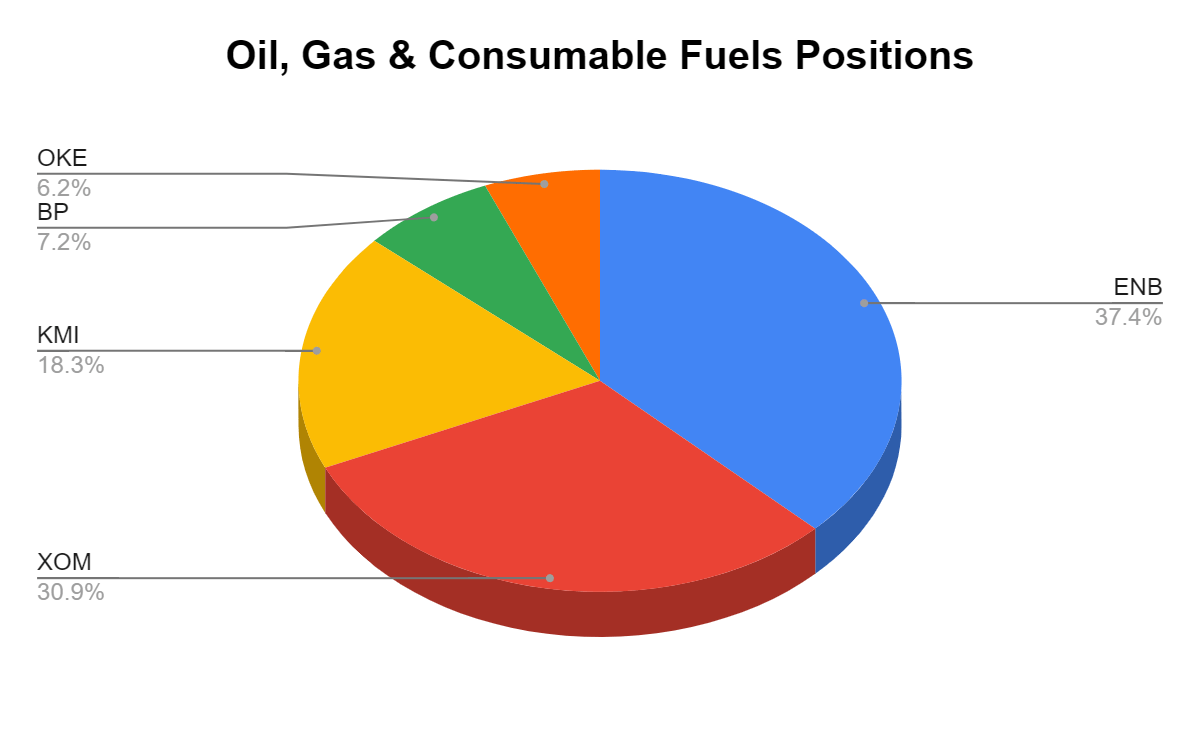
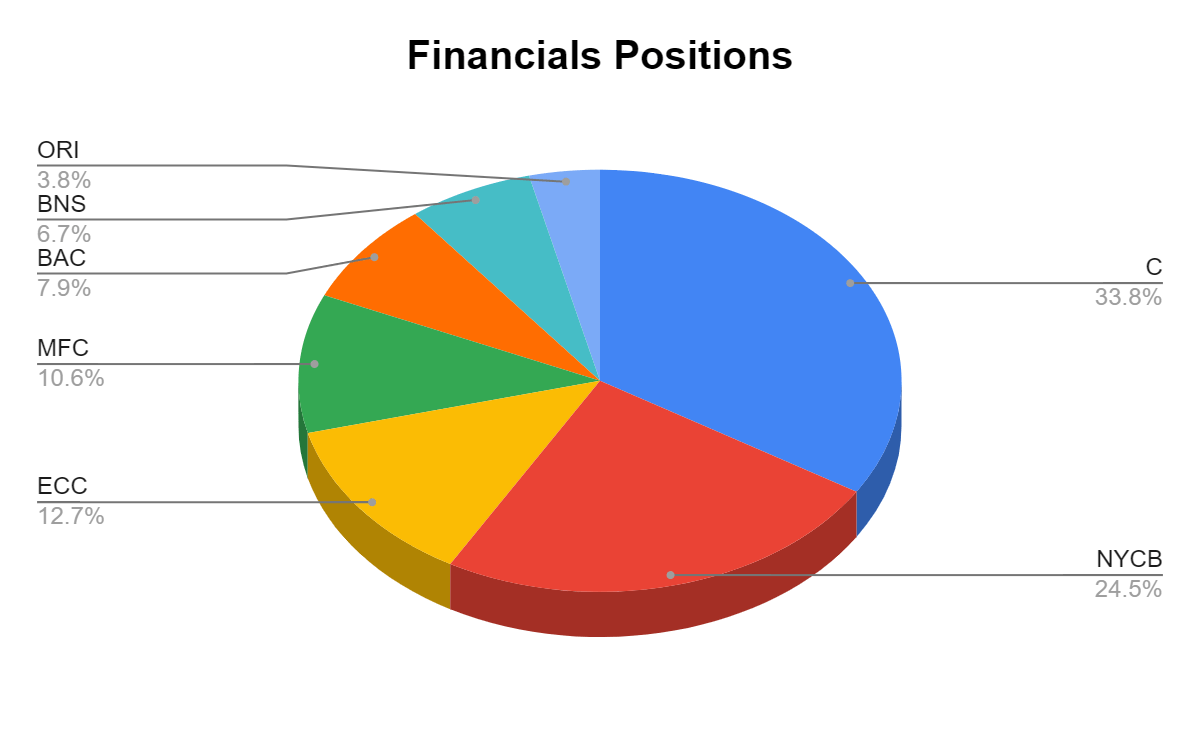
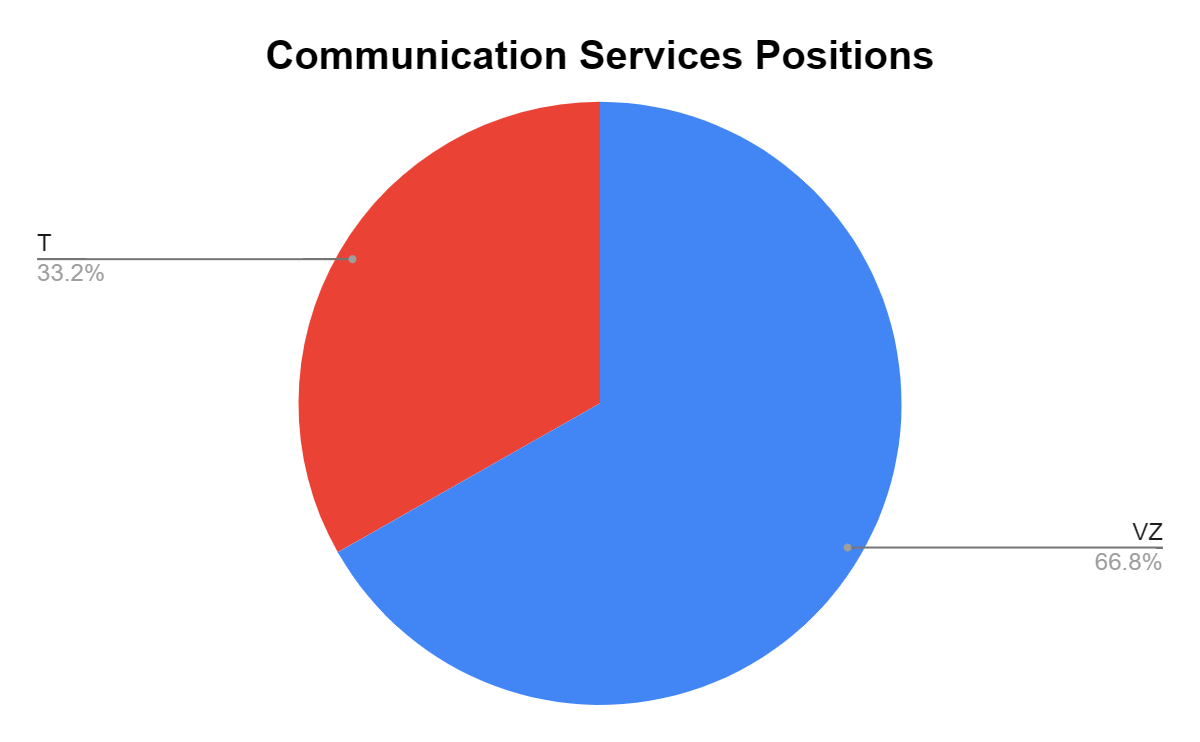
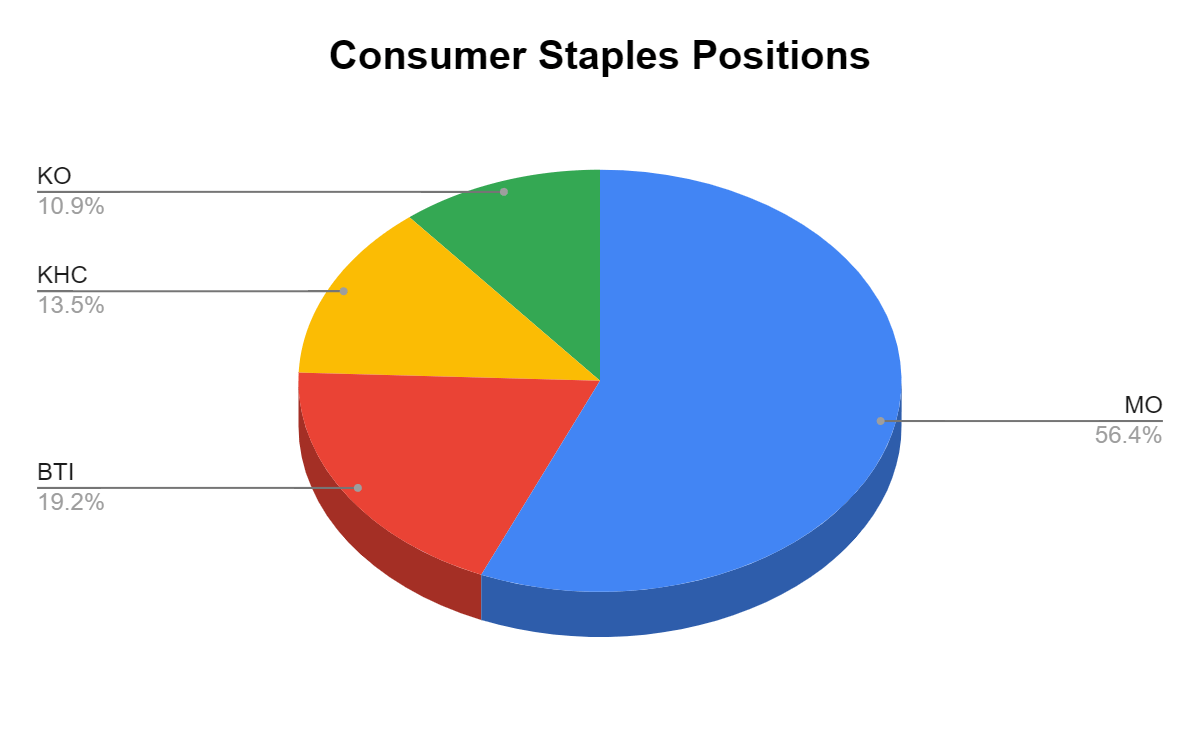
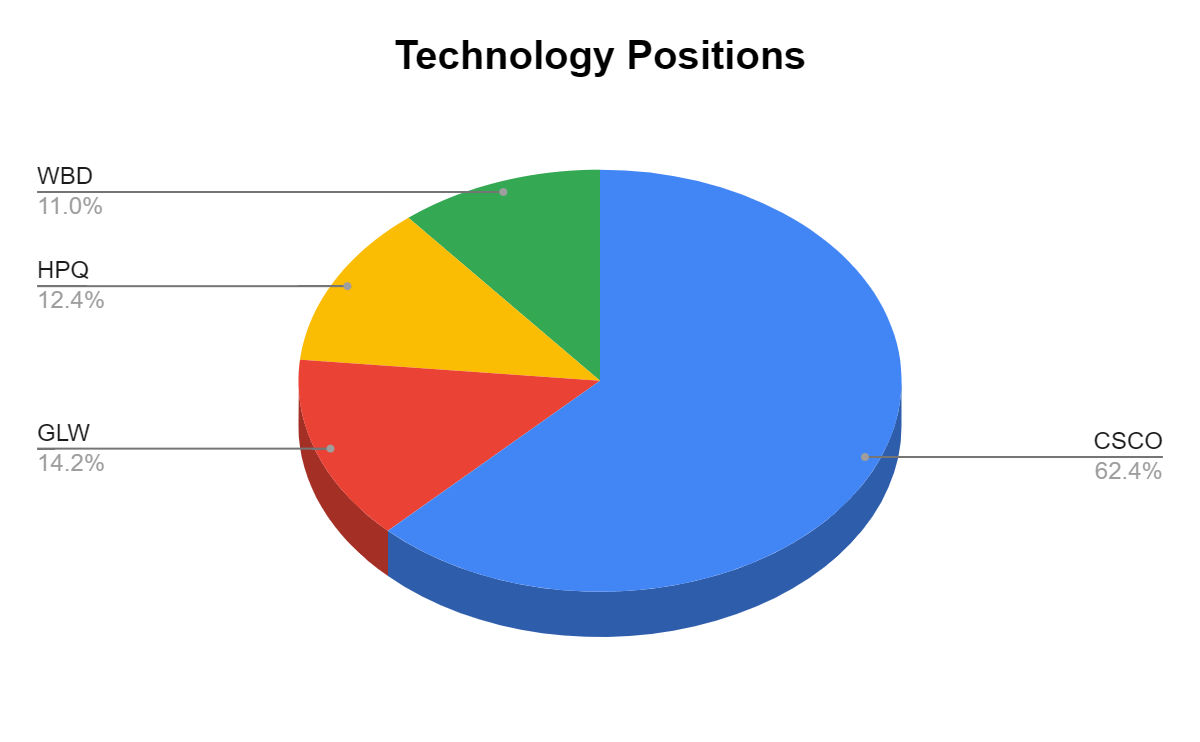
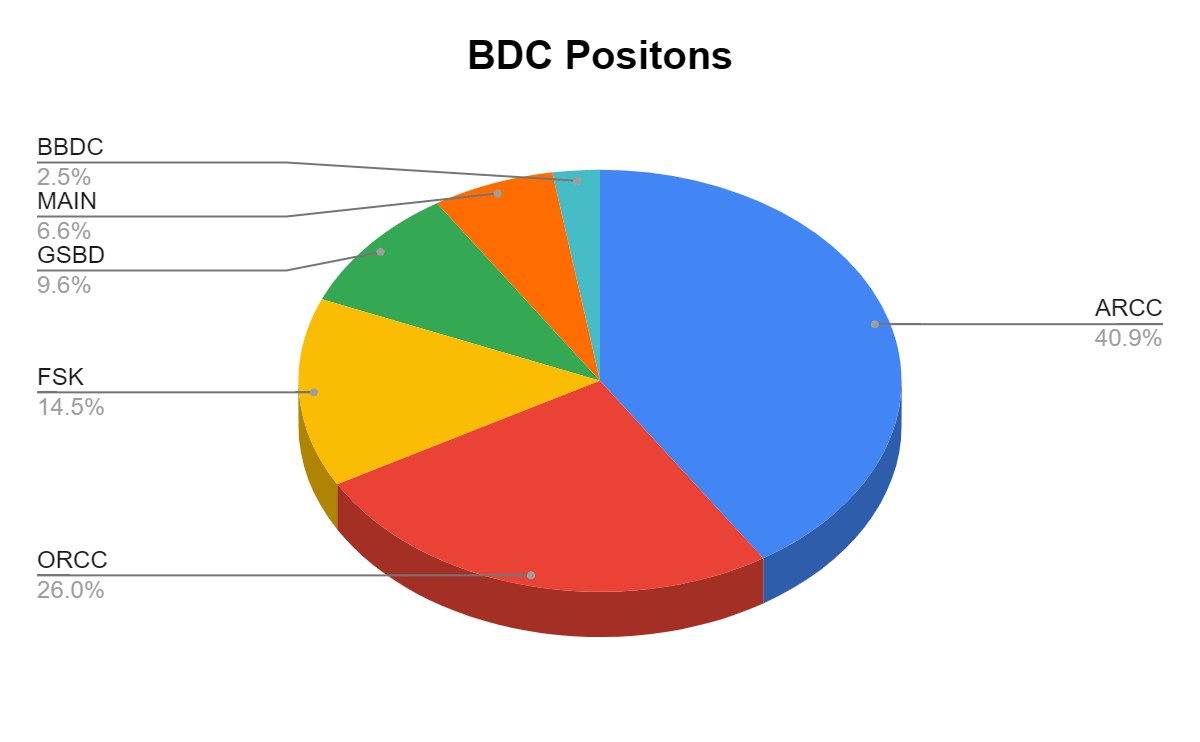
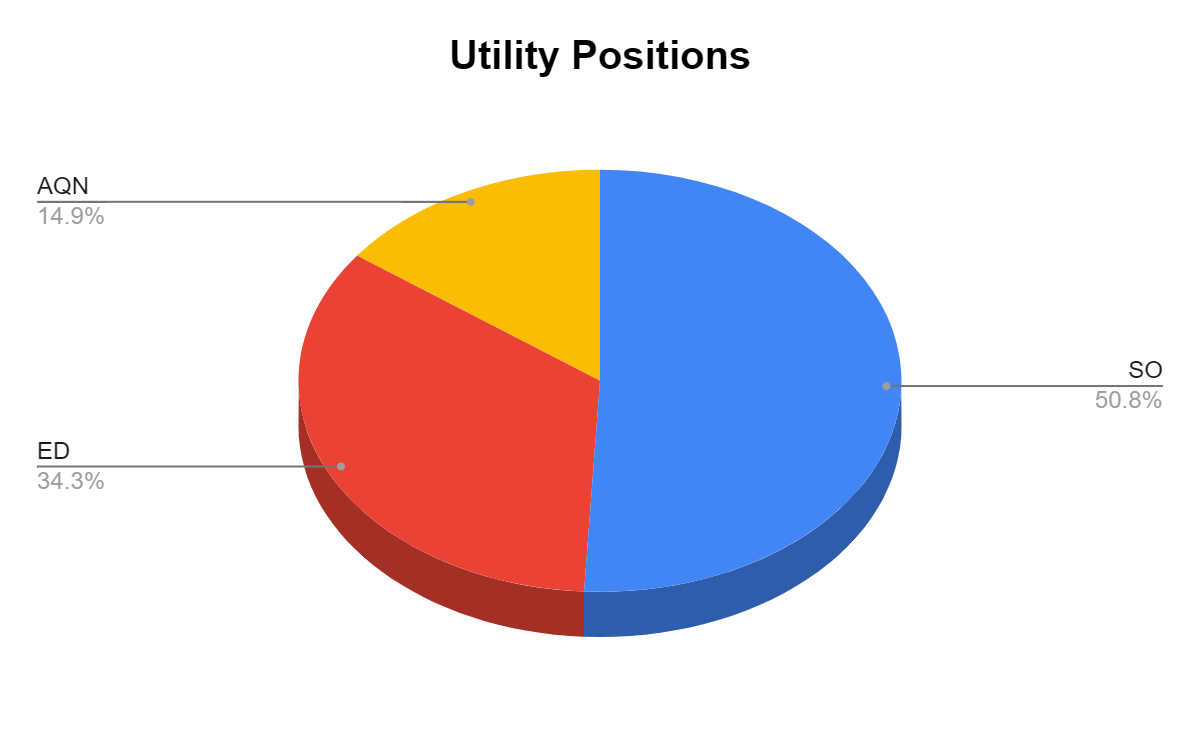
Many of the readers have asked if I could break down the individual positions within these sectors. I created pie charts for each individual sector and have illustrated how much each position represents of that sector of the Dividend Harvesting portfolio. Since I only have one position in Food & Staple Retailing and Industrials, I did not make a chart for those. 3M ( MMM ) and Walgreens Boots Alliance ( WBA ) represent 100% of those sectors. The charts will follow the normal portfolio total I have constructed. Please keep the ideas coming, as I am happy to add as much detail to this series as I can.
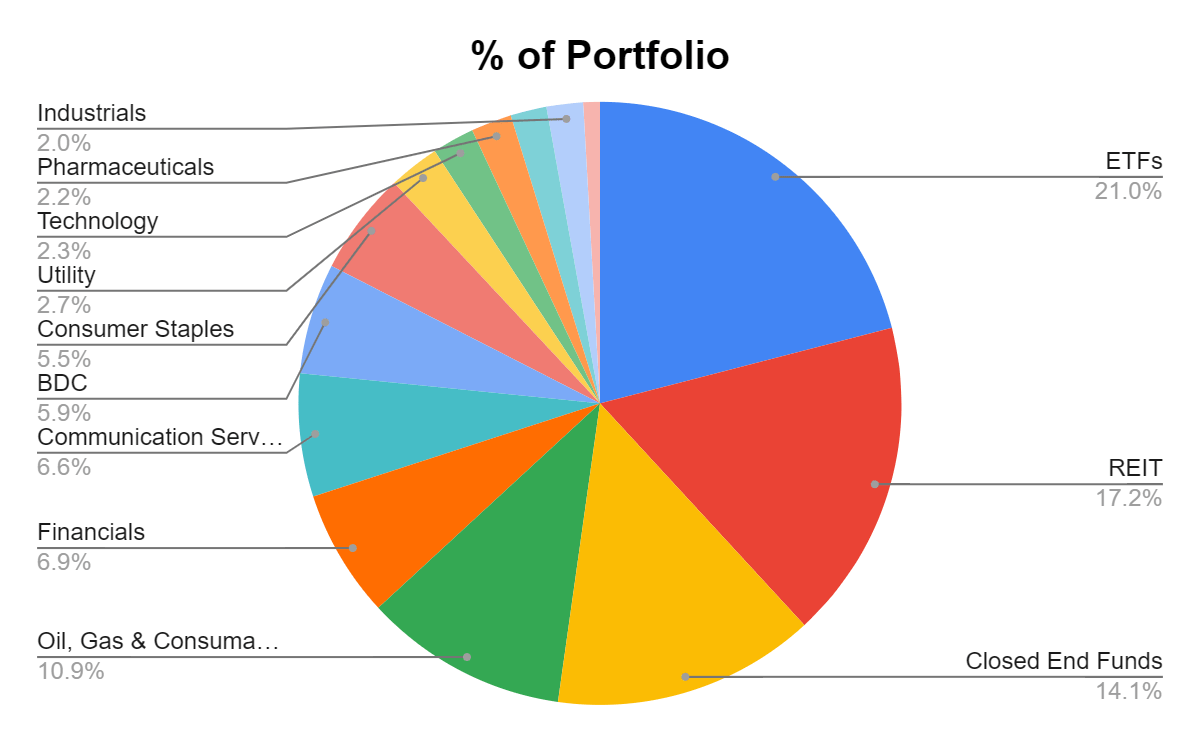
ETFs are starting to get closer to the 20% threshold, but in week 111, ETFs still remained the largest section of the Dividend Harvesting Portfolio's composition. Individual equities make up 41.84% of the portfolio and generate 28.43% of the dividend income, while exchange-traded funds ("ETFs"), closed-end funds ("CEFs"), real estate investment trusts ("REITs"), business development companies ("BDCs"), and exchange-traded notes ("ETNs") represent 58.16% of the portfolio and generate 71.57% of the dividend income.
I have a 20% maximum sector weight, so when a singular sector gets close to that level, I make sure capital is allocated away from that area to balance things out. This is the first time I have exceeded 20% in a single sector of the portfolio. I will be allocating capital away from ETFs for a while to get this sector under 20%.
| Industry |
| Investment |
| Portfolio Total |
| % of Portfolio |
| ETFs |
| $2,331.85 |
| $11,122.43 |
| 20.97% |
| REIT |
| $1,910.90 |
| $11,122.43 |
| 17.18% |
| Closed End Funds |
| $1,566.19 |
| $11,122.43 |
| 14.08% |
| Oil, Gas & Consumable Fuels |
| $1,214.19 |
| $11,122.43 |
| 10.92% |
| Financials |
| $762.33 |
| $11,122.43 |
| 6.85% |
| Communication Services |
| $733.56 |
| $11,122.43 |
| 6.60% |
| BDC |
| $659.96 |
| $11,122.43 |
| 5.93% |
| Consumer Staples |
| $613.69 |
| $11,122.43 |
| 5.52% |
| Utility |
| $302.82 |
| $11,122.43 |
| 2.72% |
| Technology |
| $251.50 |
| $11,122.43 |
| 2.26% |
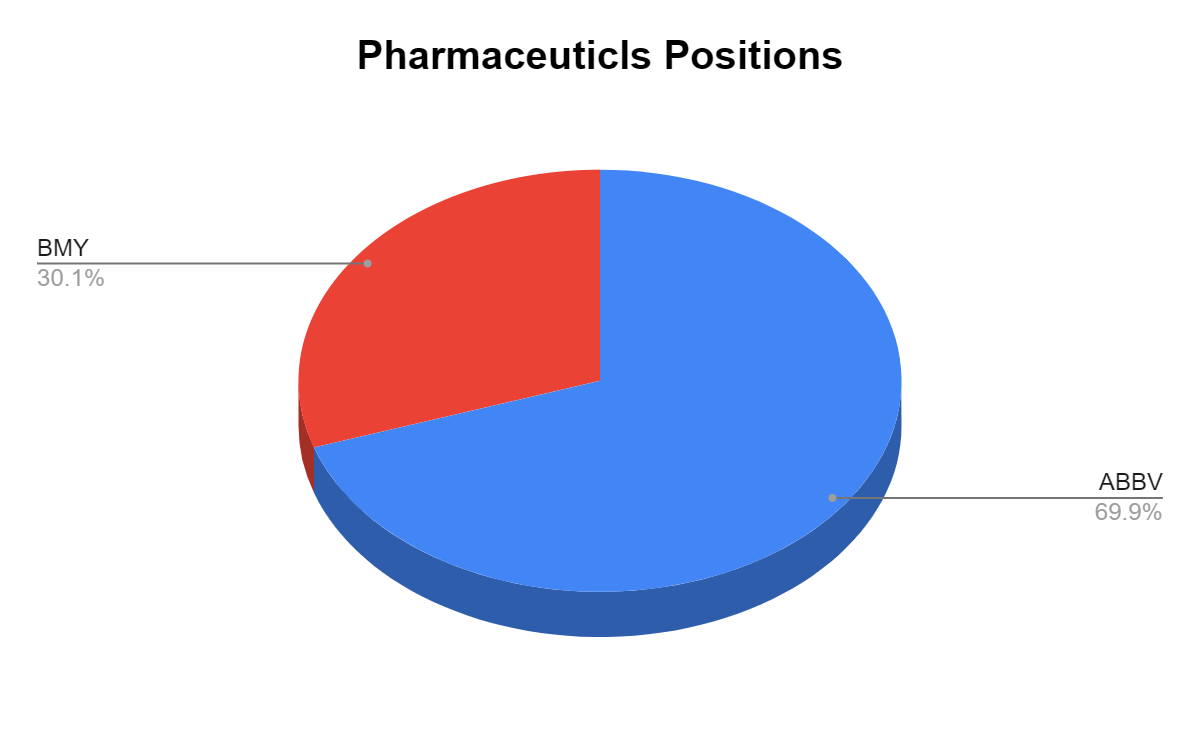
| Pharmaceuticals |
| $242.56 |
| $11,122.43 |
| 2.18% |
| Food & Staple Retailing |
| $215.70 |
| $11,122.43 |
| 1.94% |
| Industrials |
| $217.89 |
| $11,122.43 |
| 1.96% |
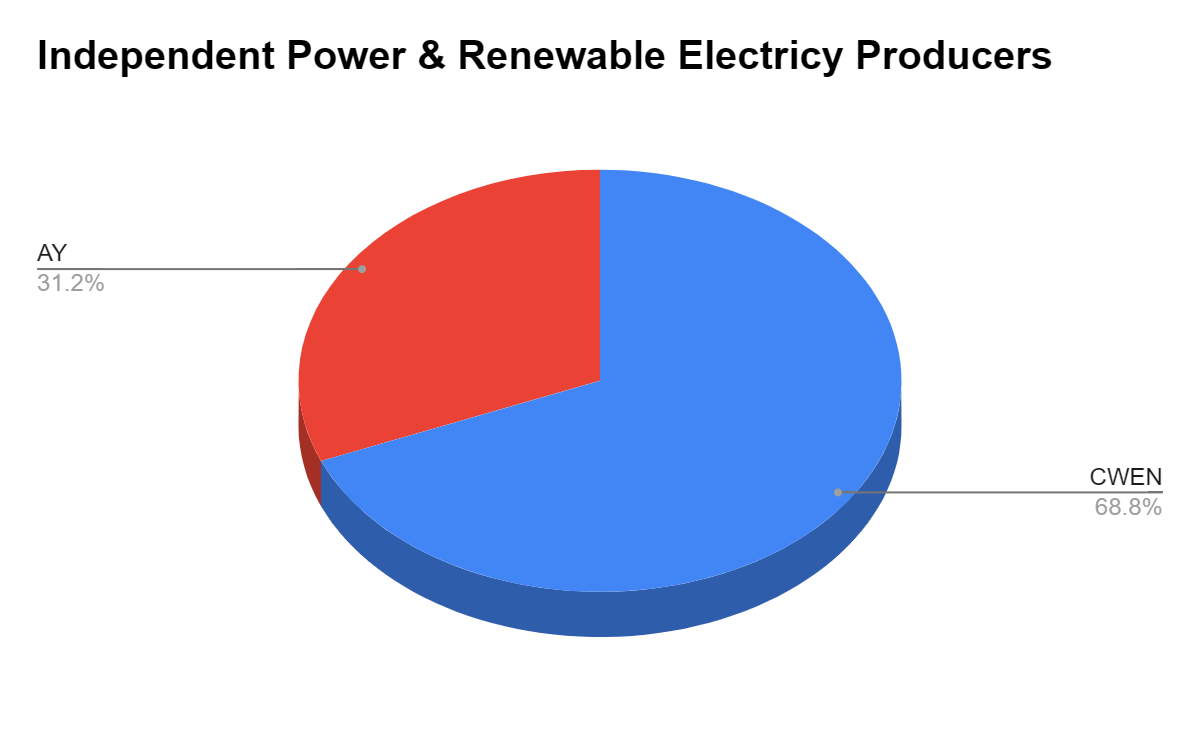
| Independent Power & Renewable Electricity Producers |
| $99.13 |
| $11,122.43 |
| 0.89% |
| Cash |
| $0.14 |
| $11,122.43 |
| 0.00% |
The JPMorgan Equity Premium Income ETF ( JEPI ) and VZ continue to decline, but I am still not adding to VZ even though I want to. I am going to try and refrain from adding to VZ for a few weeks, as I would really like to see it get back down to around 4% of the portfolio.
Week 111 Additions
In week 111, I added to the following positions:
- Altria Group ( MO )
- Starwood Property Trust ( STWD )
- SL Green Realty ( SLG )
- PIMCO Dynamic Income Fund ( PDI )
Altria Group
- MO currently has a monster dividend yielding 8.36%. I recently wrote a dedicated article which can be read here , about my investment thesis on MO. MO is committed to dividend growth and has indicated that they see the dividend continuing to grow at a mid-single-digit rate annually through 2028. I believe there is a clear path for both EPS and dividend growth here and that MO is undervalued. I will continue to add shares under the $50 mark.
Starwood Property Trust
- I also wrote an article on STWD recently, which can be read here . I think shares of STWD have fallen too much, and they represent an incredible value. I think their CEO is best in breed, and STWD has a strong track record of paying 36 consecutive quarterly dividends at $0.48 and with its distributable earnings being $2.28, placing the dividend payout ratio at 84.21%. STWD is also trading well under its book value of $20.80 and its tangible book value of 19.80.
SL Green Realty
- I think there is mass fear in the market around office REITs, and some of it is for a good reason. Ultimately I think SLG has been a victim by association, and if you read through their investor presentation, I don't feel they are positioned in doom and gloom. I think consideration to class A buildings will occur in NYC with a concentration near Grand Central and Penn Station, which is right in SLG's wheelhouse. SLG is also trading at pennies on the dollar compared to its $67.77 book value and $64.45 tangible book value.
PIMCO Dynamic Income Fund
- PDI hasn't been a great investment, and while the dividend is still large, it continues to fall. PIMCO isn't going anywhere, and I think there is an opportunity in fixed income looking out toward the future. I will continue to add shares of PDI and lower my cost basis.
Week 112 Gameplan
For further details see:
Dividend Harvesting Portfolio Week 111: $11,100 Allocated, $917.46 In Projected Dividends