PDO - Dividend Harvesting Portfolio Week 114 $11400 Allocated $953.75 In Projected Dividends
2023-05-11 09:00:00 ET
Summary
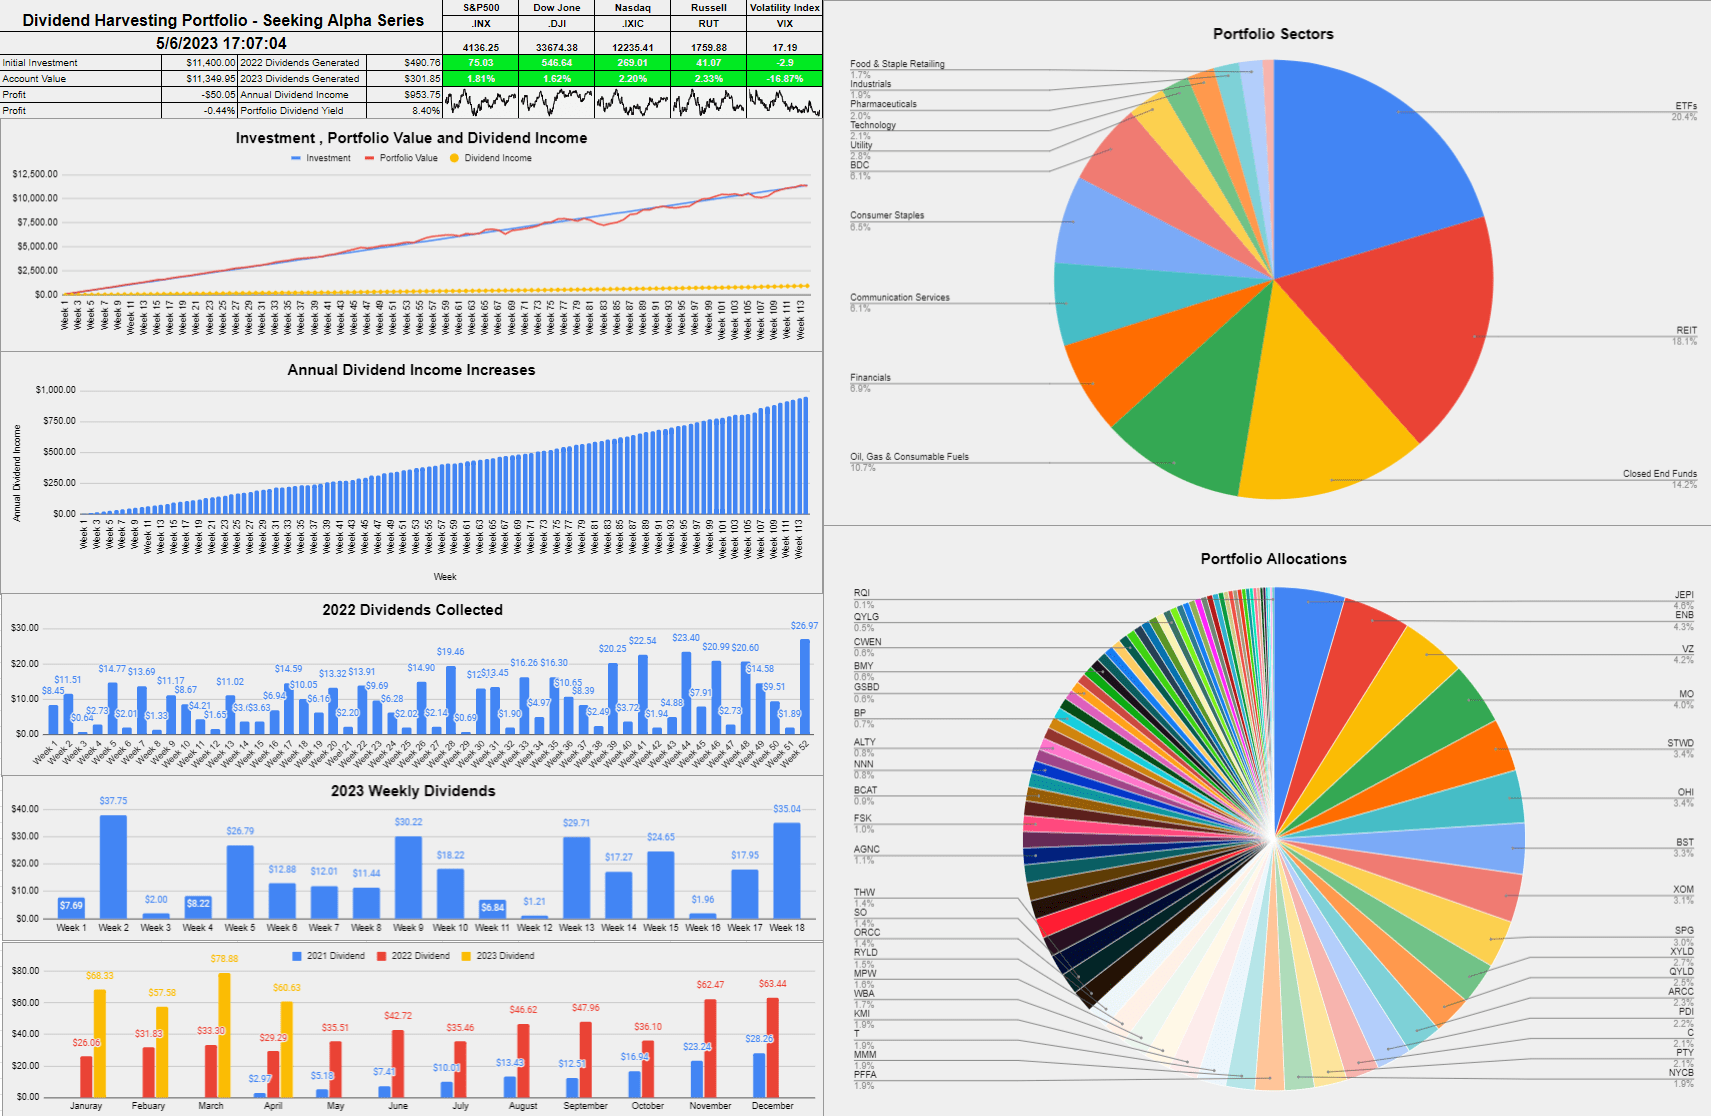
- The Dividend Harvesting Portfolio is now generating $953.75 in annual dividends, yielding 8.4%.
- The Dividend Harvesting portfolio has a 66.67% record of finishing the week in the black since its inception, 76/114 weeks.
- In week 114, I added to my positions in SLG, MO, PDO, and FSK.
Well, this was a fun week. Jerome Powell raised rates, causing a massive sell-off into the close on Wednesday 5/3 that carried over into 5/4. Apple ( AAPL ) came to the markets rescue after the bell on Thursday 5/4, in addition to the U.S. economy adding 253,000 jobs in April, coming in above market expectations. On Friday 5/5 the market rallied as the S&P 500 increased by 75.03, and the Nasdaq gained 269.01 on the final trading day of the week. Overall the S&P 500 was down -0.87% while the Nasdaq finished the week up 0.16%.
After 114 weeks and $11,400 allocated, the balance of the Dividend Harvesting Portfolio is $11,349.95. The account is down -$50.05 or -0.44% on invested capital as it swung into the red in week 114. In the first week of May, I collected $35.04 in dividend income, bringing 2023's total dividend income generated to $301.85. In week 114, I dollar cost averaged into SL Green Realty ( SLG ), Altria Group ( MO ), FS KKR Capital Corp ( FSK ), and the PIMCO Dynamic Income Opportunities Fund ( PDO ). At the end of week 114, my projected annual dividend income increased by $14.70 or 1.57% to $953.75, which is a forward yield of 8.4%.
I allocate capital toward big tech, funds, dividends, and growth outside of my retirement accounts. These are not my only investments, but I did open a separate account, so I could easily track and document this series. I intentionally created broad diversification throughout the Dividend Harvesting portfolio so I could benefit from sector rotations and mitigate my downside risk. Investors who are too exposed to growth companies or large-cap tech have gotten crushed as the investment landscape changes. On the growth and tech side of my investments, I'm feeling the pain as some of my favorite companies, including Alphabet ( GOOG , GOOGL ), Amazon ( AMZN ), and Meta Platforms ( META ), have been taken to the woodshed.
I'm going to address a question that continues to surface. I'm not trying to beat the market with this portfolio. I love index funds and am invested in several index funds. I love dividend investing due to the stream of cash flow it generates. I don't want 100% of my assets outside of real estate tied to an S&P index fund. I have created a personal investment strategy that works to achieve my investment goals, and having a stream of income generated from dividends is part of my investment strategy. Low-cost index funds are one of the best investments anyone can make in my opinion, and the Dividend Harvesting portfolio is not meant to be a substitute for an index fund. I have read many questions about dividend investing and wanted to start a portfolio from the ground up and document its progress to disprove many misconceptions, including that you need a large amount of seed capital to make dividend investing work for you.
This series has never been about hitting a target yield, generating a certain amount of profit, or beating the market. I had two specific goals with this series. The first was to create a blueprint for constructing a dividend portfolio by documenting the journey starting from the beginning. The second goal was to illustrate how allocating capital each week toward investing, regardless of the amount, would be beneficial in the long run.
Too many people are under the illusion that you need tens of thousands or even hundreds of thousands to benefit from investing. Instead of using my real dividend portfolio as an example, I decided to start a new account, fund it with $100, and add $100 weekly, providing a step-by-step guide to dividend investing. This methodology doesn't have to be used for dividend investing, and it could be as simple as an S&P index fund or a Total Market fund. Hopefully, this series is inspiring people to invest in their future to attain financial freedom.
A historical recap of the Dividend Harvesting Portfolio’s investment principles.
Investment Objectives
- Income generation
- Downside mitigation through diversification
- Capital appreciation
Below are the fundamental rules I have put in place for this Portfolio:
- Allocate $100 weekly to this Portfolio
- Only invest in dividend-producing investments
- No position can exceed 5% of the Portfolio
- No sector can exceed 20% of the Portfolio
- All dividends and distributions are to be reinvested
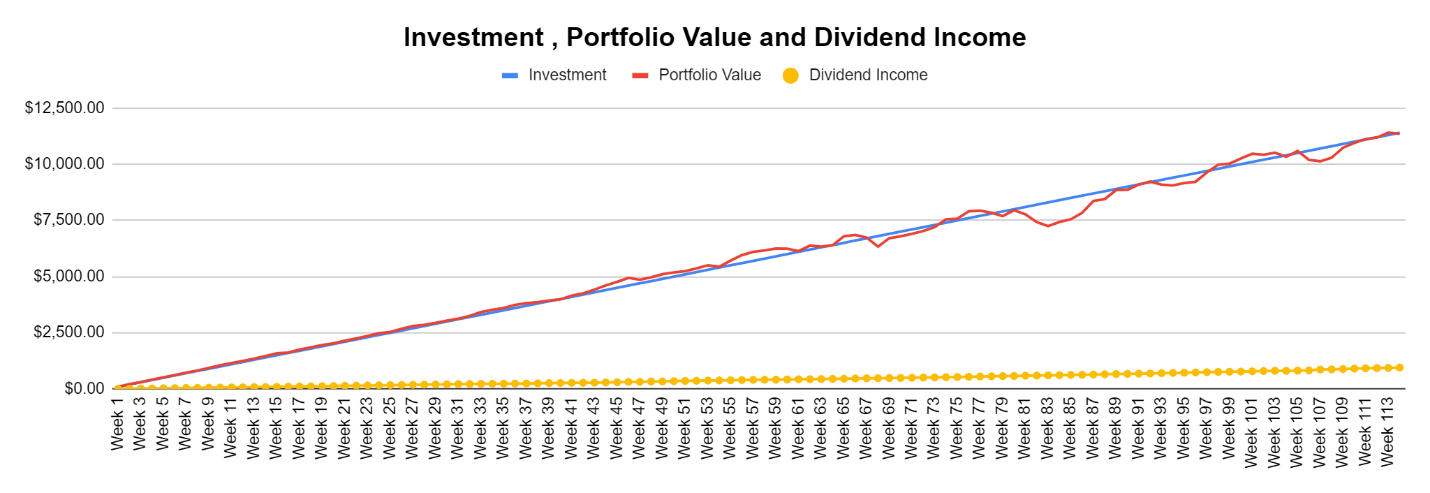
Below is a chart that extends from week 1 through the current week to illustrate the Dividend Harvesting Portfolio's Progression
- Blue line is my initial investment $100 in week 1, $1,000 in week 10, etc.
- Red line is the account value at the end of each week
- Yellow line is the annual dividend income the Dividend Harvesting Portfolio was projected to generate after that week's investments and dividends reinvested
The Dividend Harvesting Portfolio dividend section
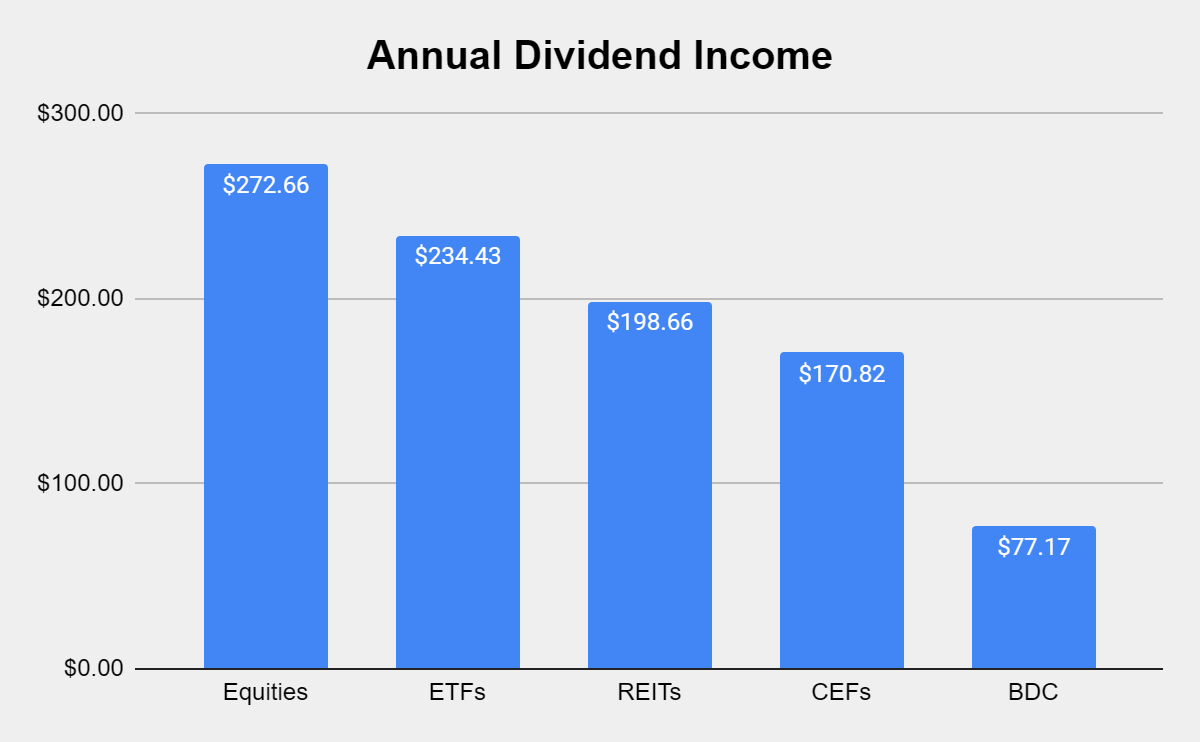
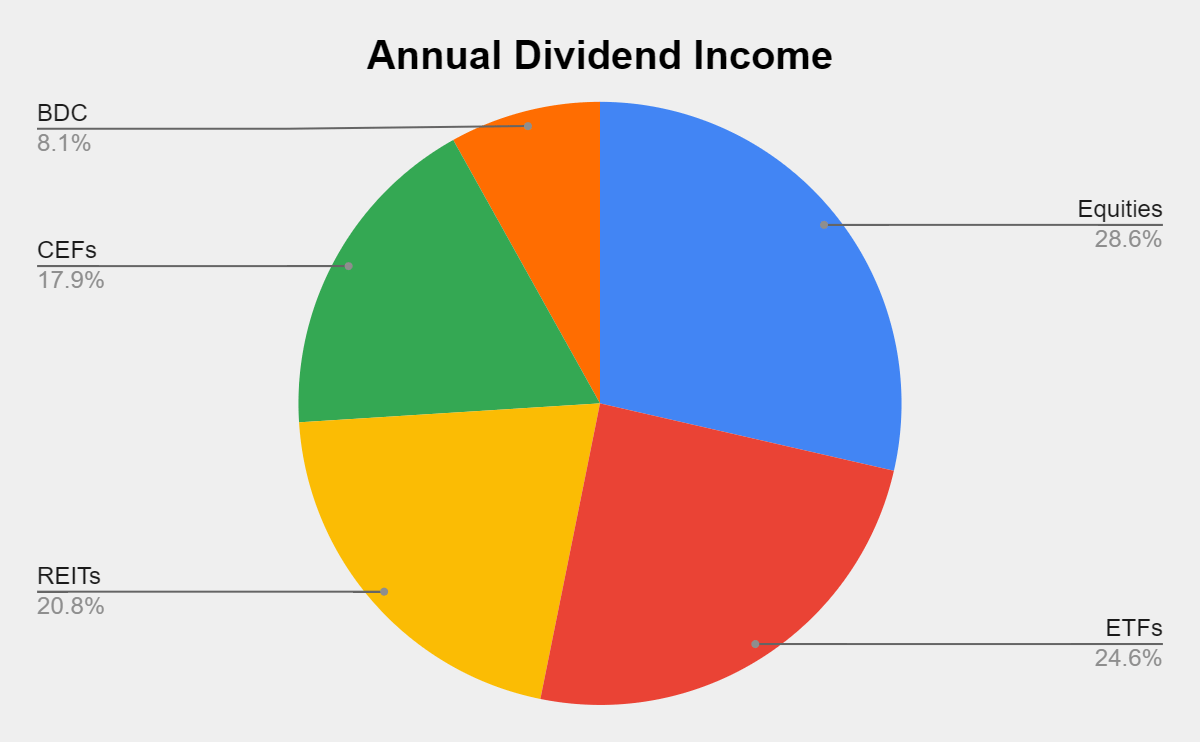
Here's how much dividend income is generated per investment basket:
- Equities $272.66 (28.59%)
- ETFs $234.43 (24.58%)
- REITs $198.66 (20.83%)
- CEFs $170.82 (17.91%)
- BDCs $77.17 (8.09%)
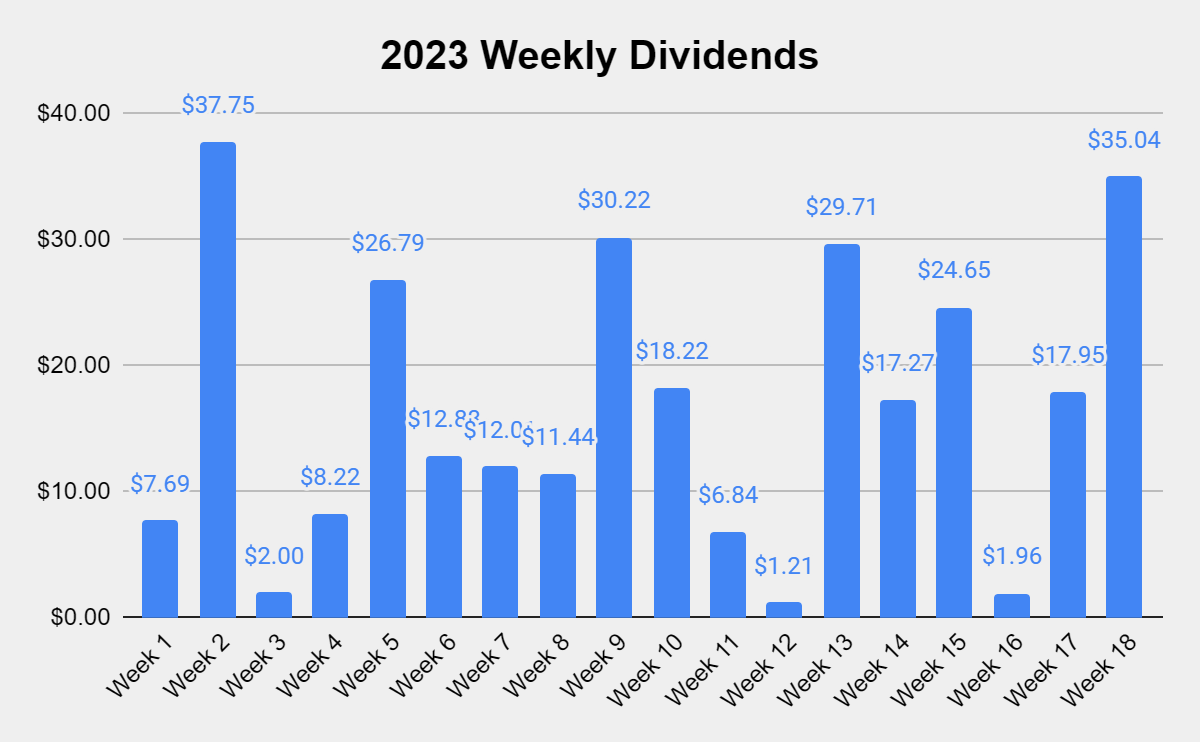
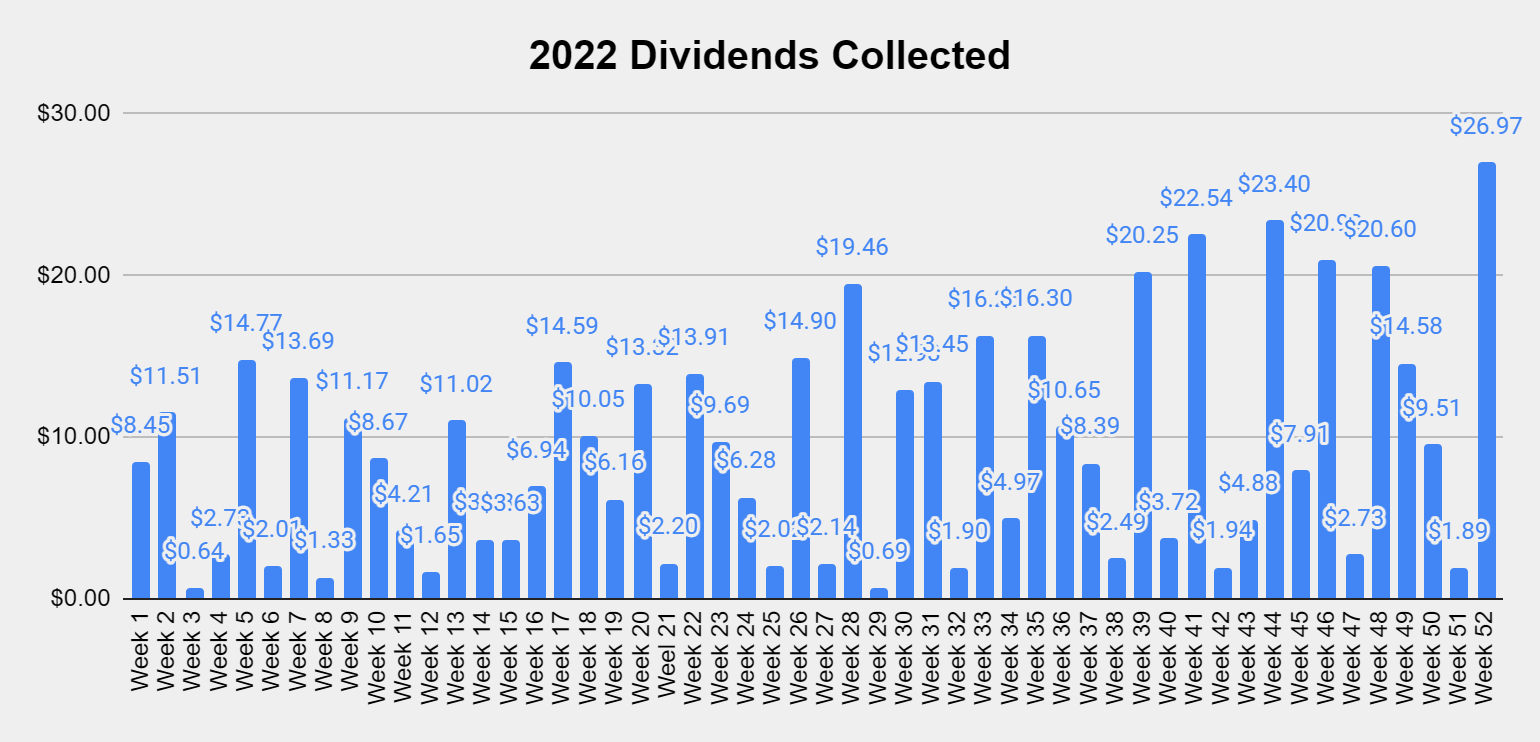
Collecting dividends can serve many functions in a portfolio. Some investors utilize dividends to supplement their income and live off of them. I'm building a dividend portfolio for myself 30 years into the future. In 2022, I collected $490.76 in dividend income from 533 dividends. In week 18 of 2023, I collected $35.04 in dividends, and in 2023 I've generated $301.85 in dividend income. YTD I have generated 61.51% of my 2022 dividend income from 228 dividends which is 42.78% of the dividends generated throughout 2022.
These dividends allow me to gain additional equity in my investments while increasing my future cash flow in down markets. This style of investing isn't for everyone, but if you're looking to generate consistent cash flow while mitigating downside risk, this method has worked for me. I'm hoping to collect around $1,000 in dividends in 2023, which will be reinvested.
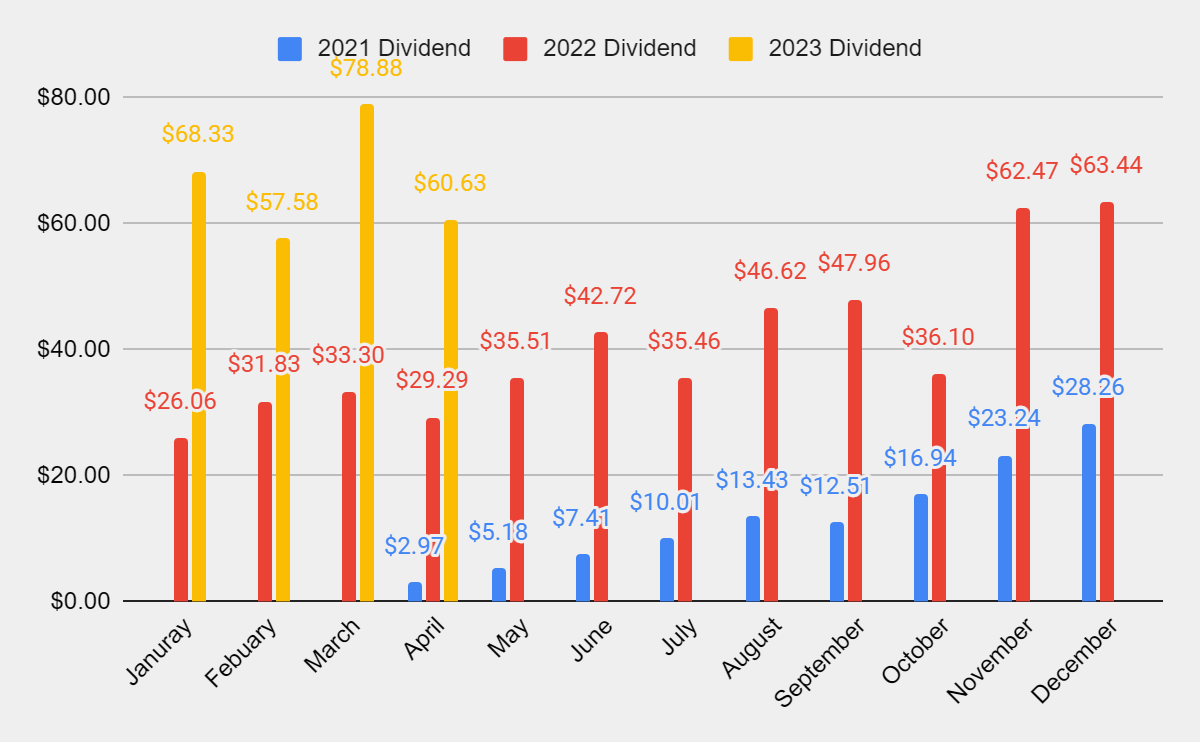
April is over and there is another month of data in my YoY comparison. My YoY stats are very encouraging as my dividend income in the month of April has increased by $26.32 (886.2%) YoY in 2022, then by another 107% YoY in 2023. From a dollar perspective, my April dividend income grew by $26.32 in 2022 and another $31.34 in 2023. At this rate April's dividend income in 2024 should be in the $90-$100 range.
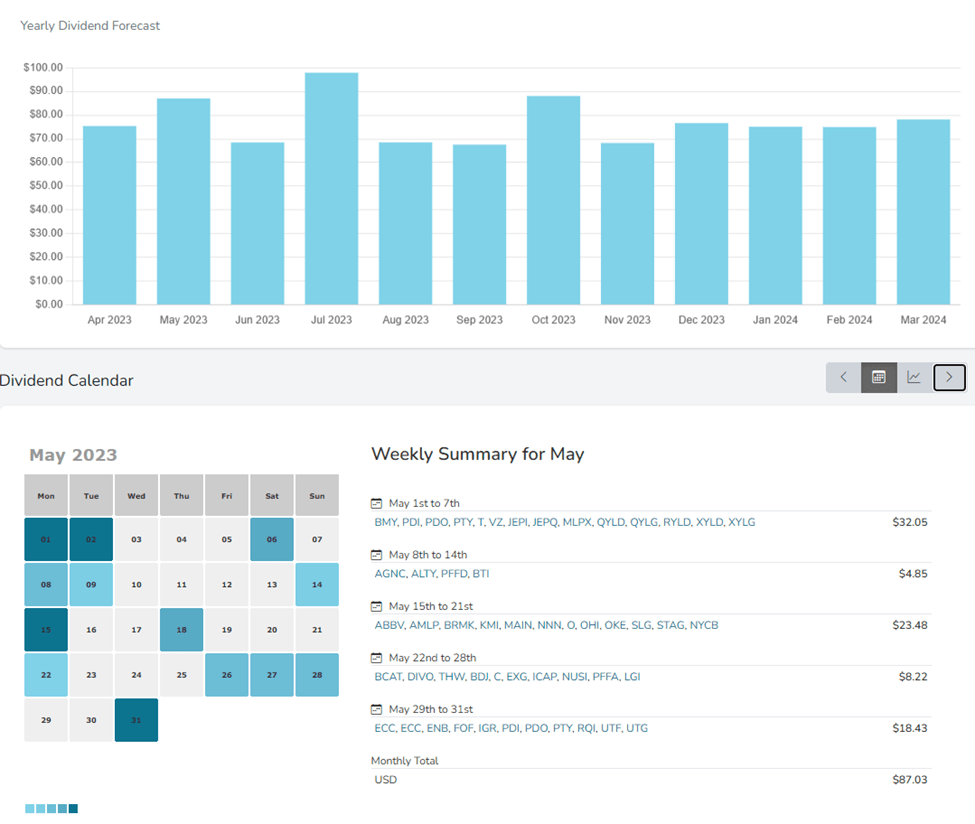
I found a tool that can track and visualize my monthly and weekly dividend income. I plan on showing this graph rather than the full year as it's a better visualization than what I had created. In week 114, I added to existing positions, so the number of dividends generated didn't increase. It's getting very interesting seeing the amount of monthly dividend income being generated and the number of days that dividends are produced. In May I have dividends rolling in throughout half the month.
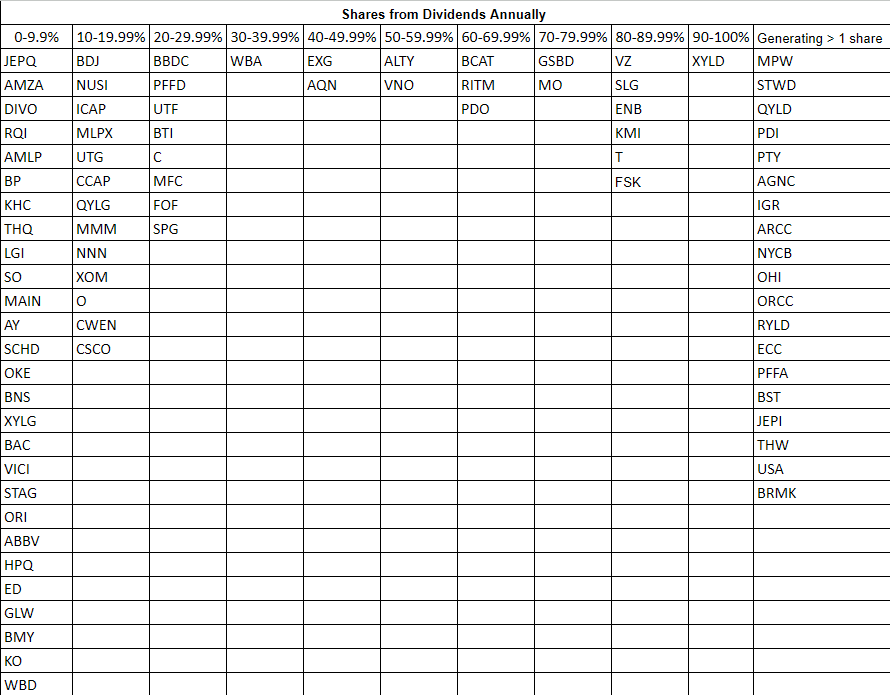
What’s crazy is that I was thinking about what I want to add this week, then I looked at the chart below and my thought process changed. I am very tempted to get Verizon ( VZ ), SLG, and FSK over the line. I just looked at a calendar and there are 8 weeks left until July 1 st which is the halfway point in 2023. My goal by July 1 st is to have every position from the 70-99% moved to the far-right column of generating at least 1 share annually through their dividends. I think it’s doable.
The Dividend Harvesting Portfolio Composition
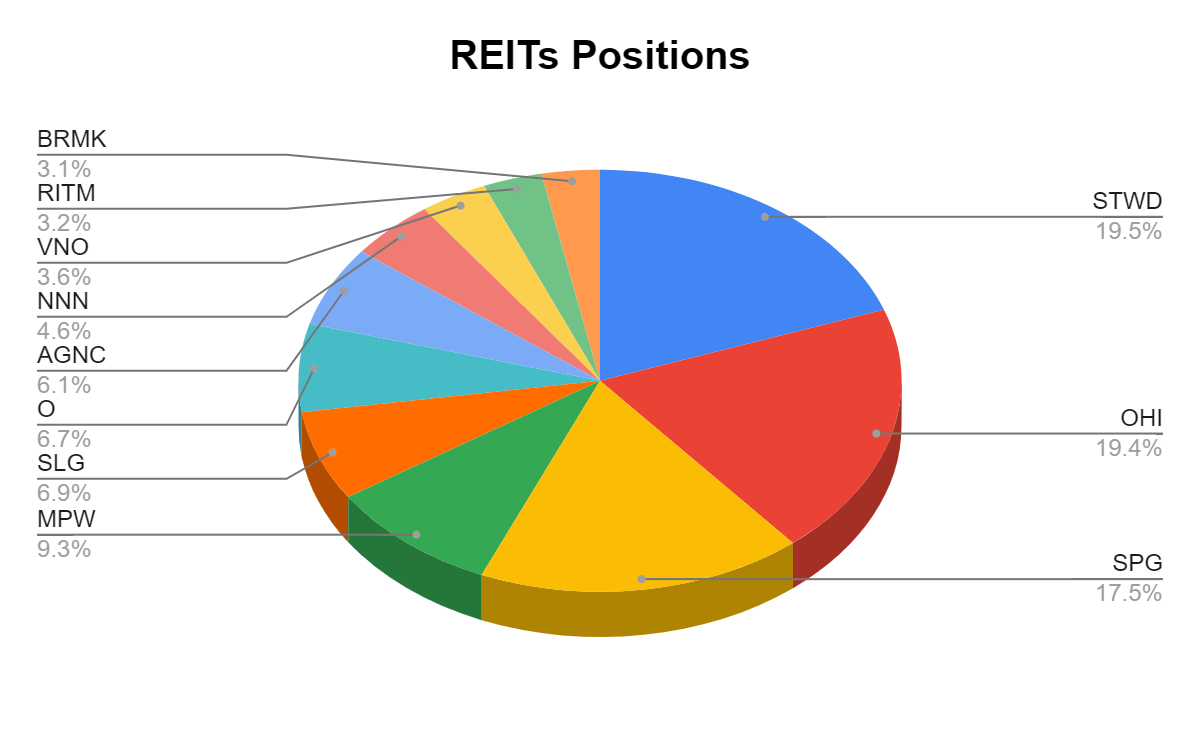
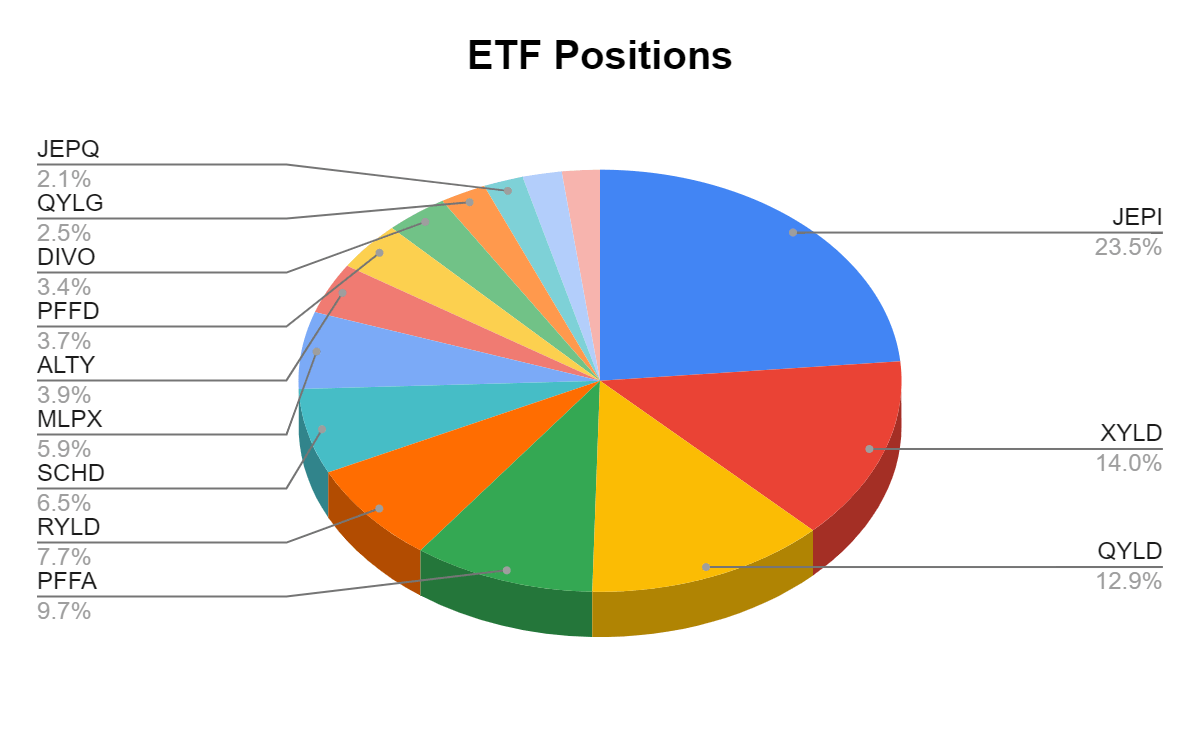
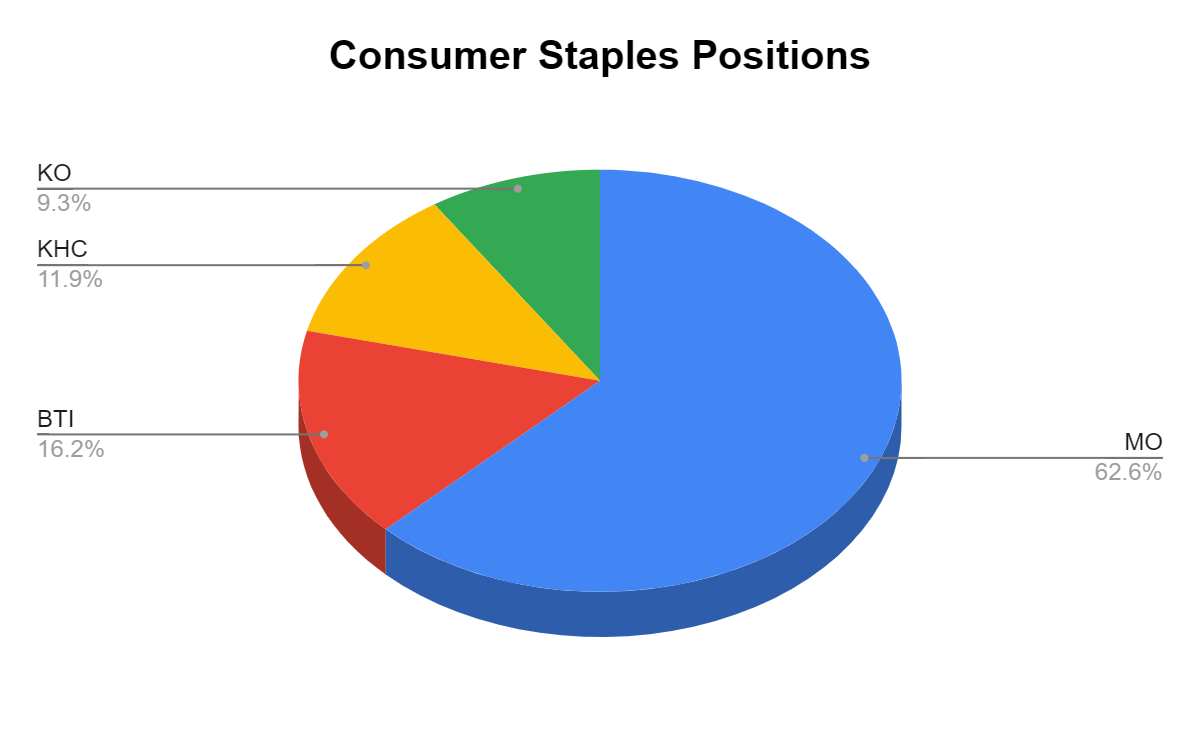
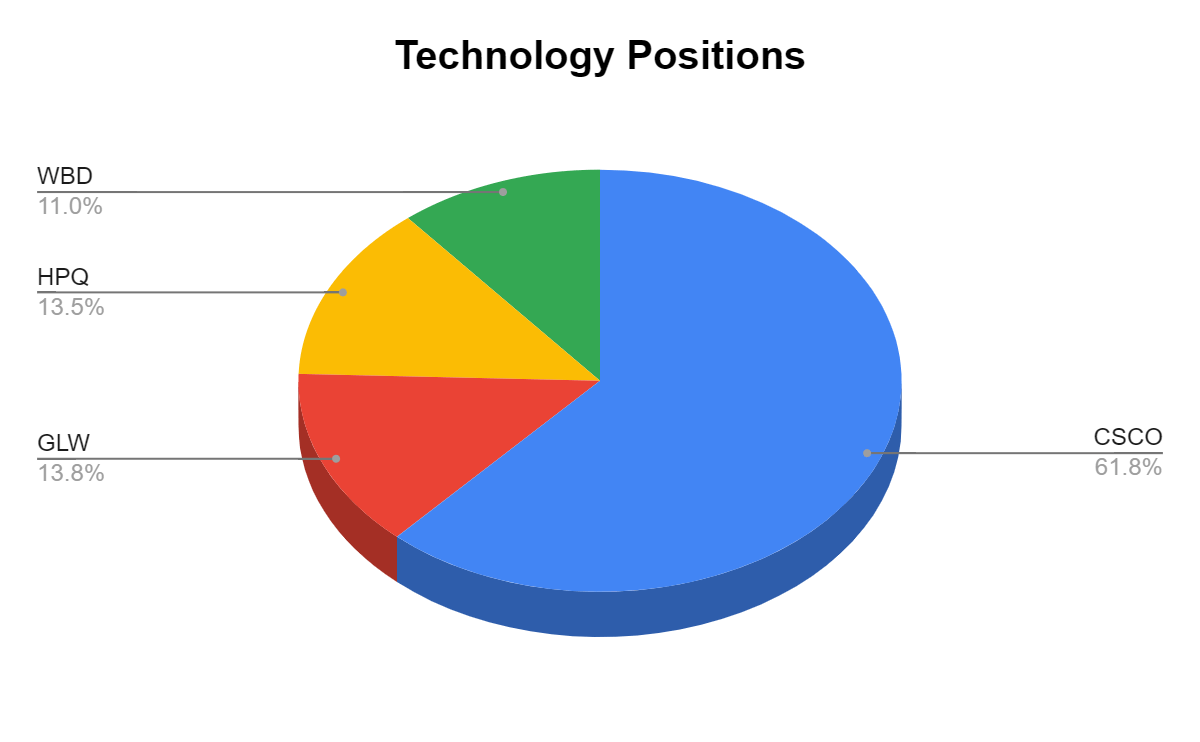
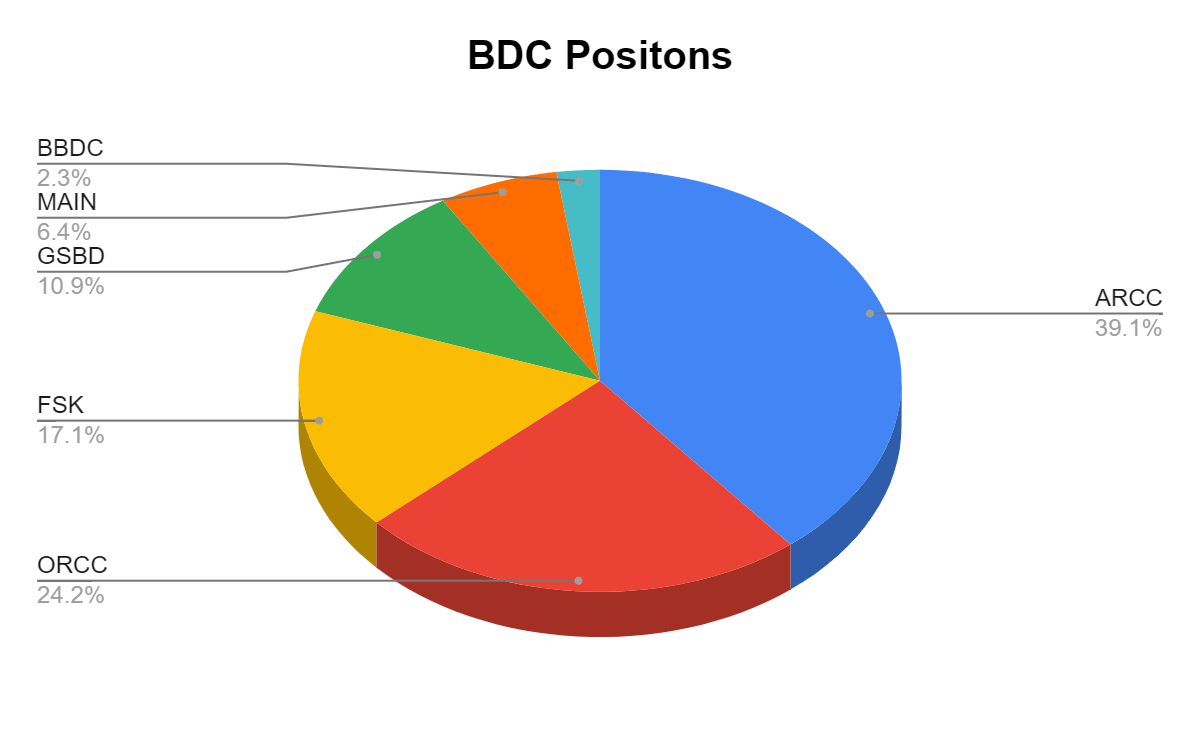
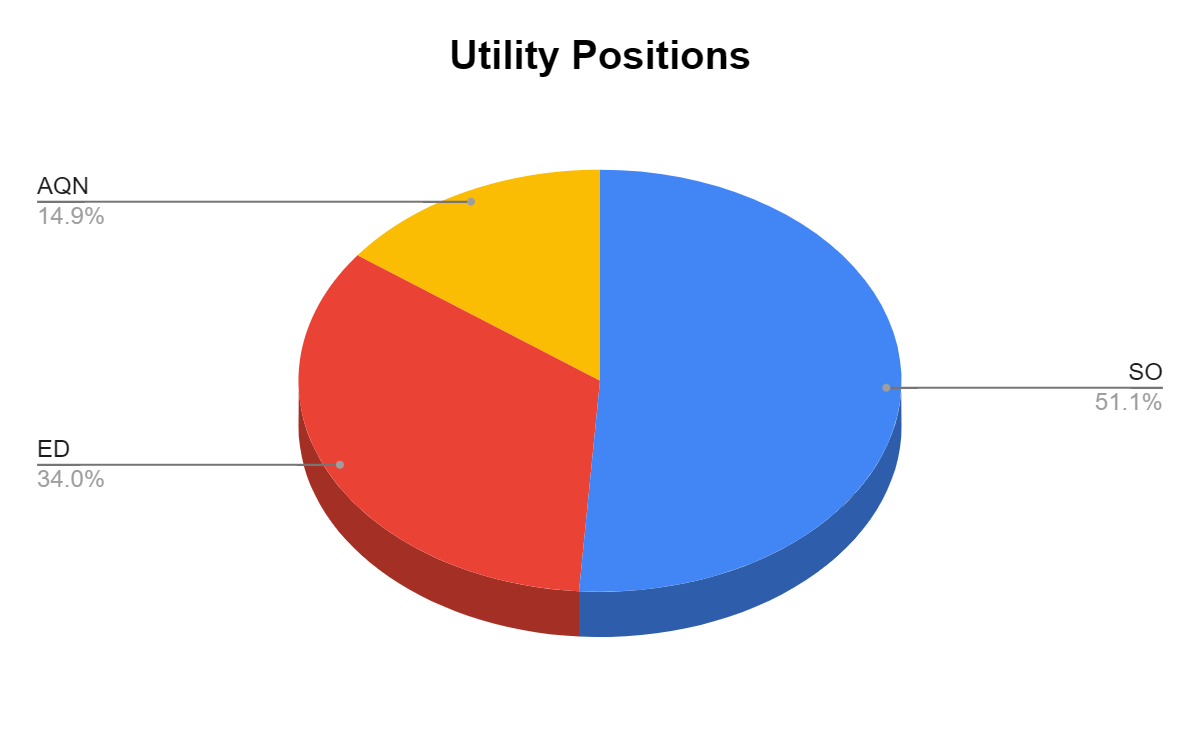
Many of the readers have asked if I could break down the individual positions within these sectors. I created pie charts for each individual sector and have illustrated how much each position represents of that sector of the Dividend Harvesting portfolio. Since I only have one position in Food & Staple Retailing and Industrials, I did not make a chart for those. 3M ( MMM ) and Walgreens Boots Alliance ( WBA ) represent 100% of those sectors. The charts will follow the normal portfolio total I have constructed. Please keep the ideas coming, as I am happy to add as much detail to this series as I can.
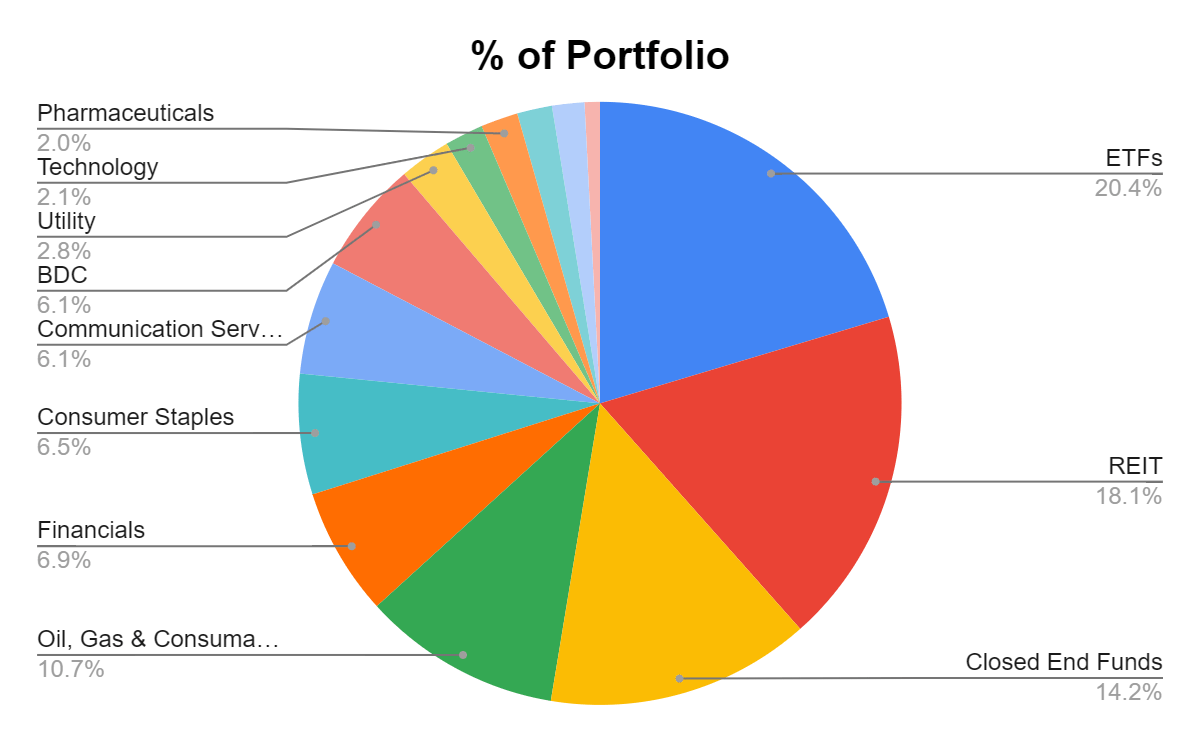
ETFs are starting to get closer to the 20% threshold, but in week 114, ETFs still remained the largest section of the Dividend Harvesting Portfolio's composition. Individual equities make up 41.33% of the portfolio and generate 28.59% of the dividend income, while exchange-traded funds ("ETFs"), closed-end funds ("CEFs"), real estate investment trusts ("REITs"), business development companies ("BDCs"), and exchange-traded notes ("ETNs") represent 58.67% of the portfolio and generate 71.41% of the dividend income.
I have a 20% maximum sector weight, so when a singular sector gets close to that level, I make sure capital is allocated away from that area to balance things out. This is the first time I have exceeded 20% in a single sector of the portfolio. I will be allocating capital away from ETFs for a while to get this sector under 20%.
| Industry |
| Investment |
| Portfolio Total |
| % of Portfolio |
| ETFs |
| $2,310.92 |
| $11,349.95 |
| 20.36% |
| REIT |
| $2,051.95 |
| $11,349.95 |
| 18.08% |
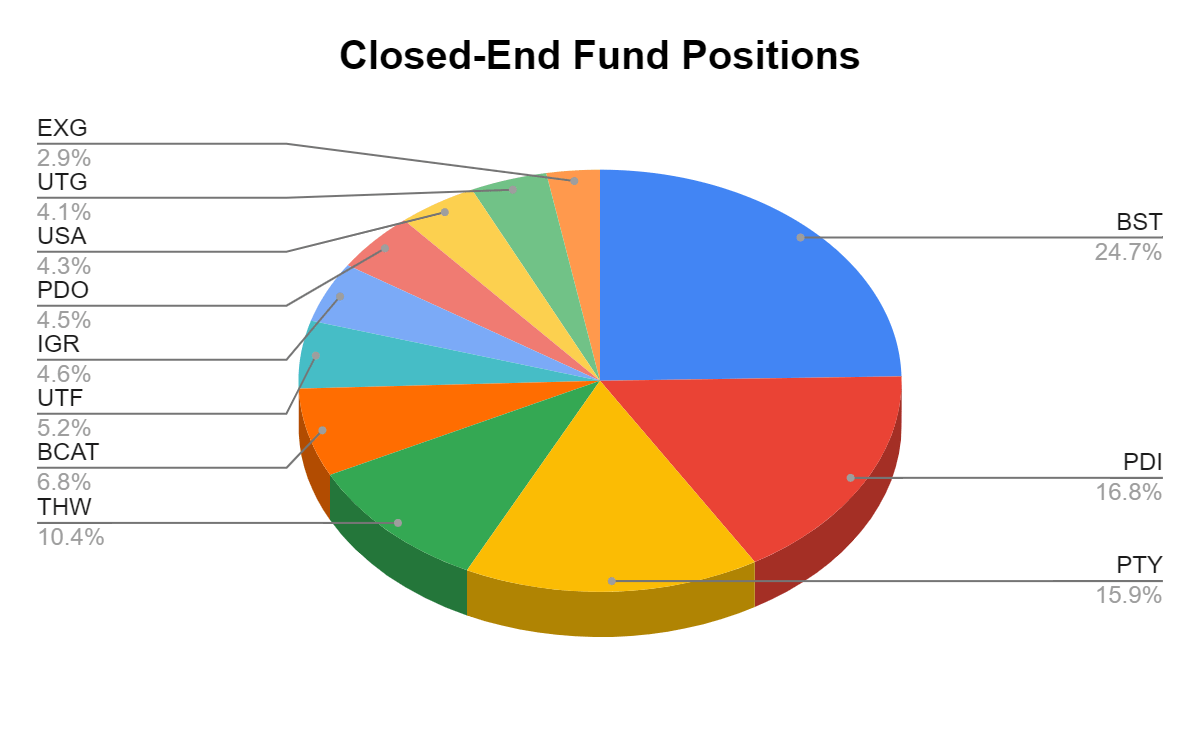
| Closed End Funds |
| $1,607.36 |
| $11,349.95 |
| 14.16% |
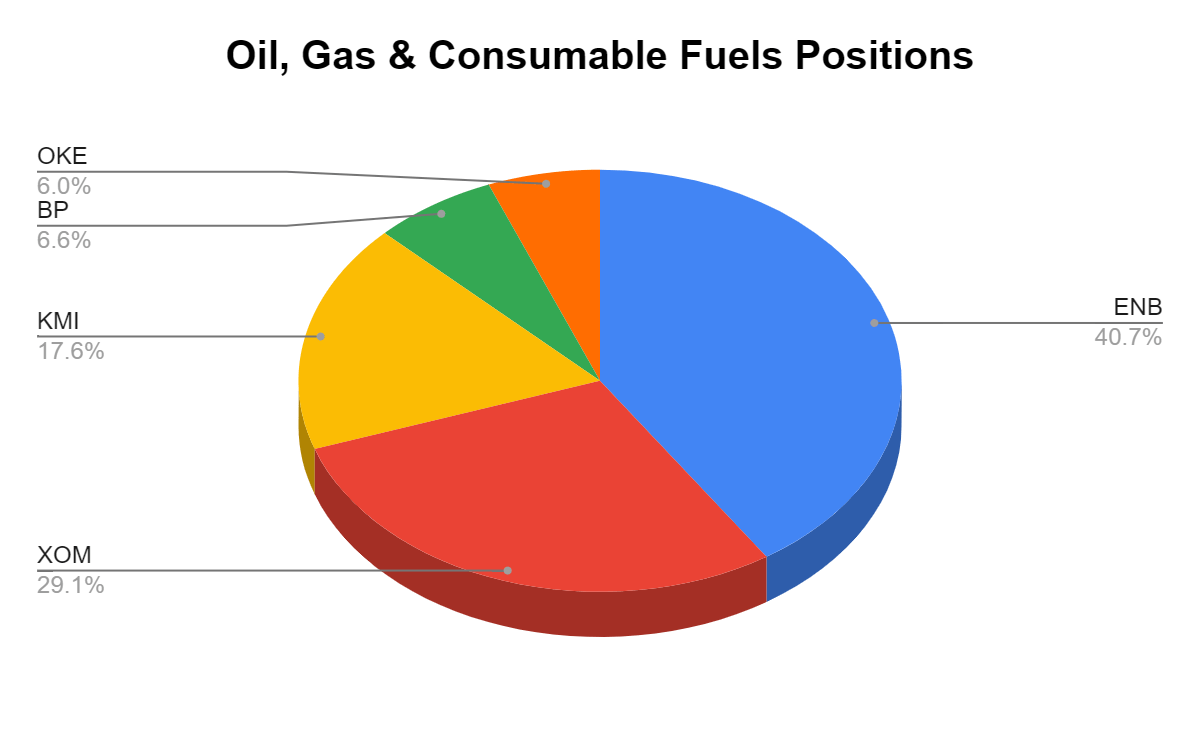
| Oil, Gas & Consumable Fuels |
| $1,208.90 |
| $11,349.95 |
| 10.65% |
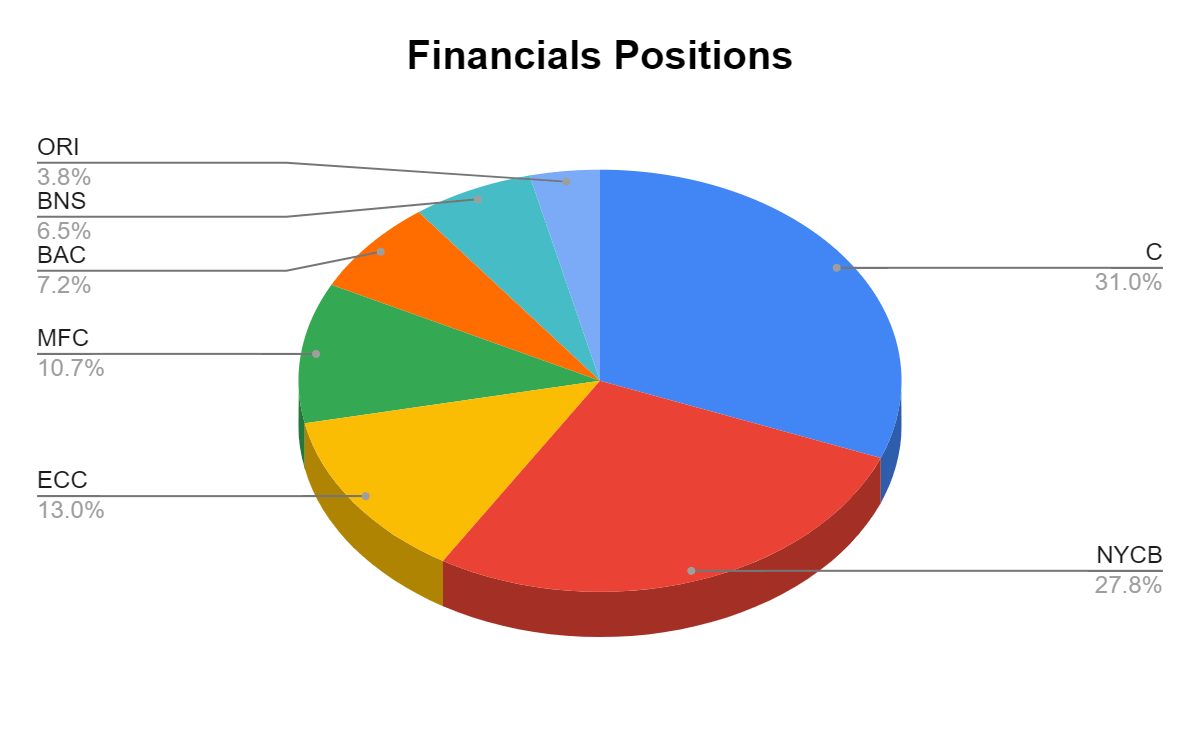
| Financials |
| $778.22 |
| $11,349.95 |
| 6.86% |
| Consumer Staples |
| $733.15 |
| $11,349.95 |
| 6.46% |
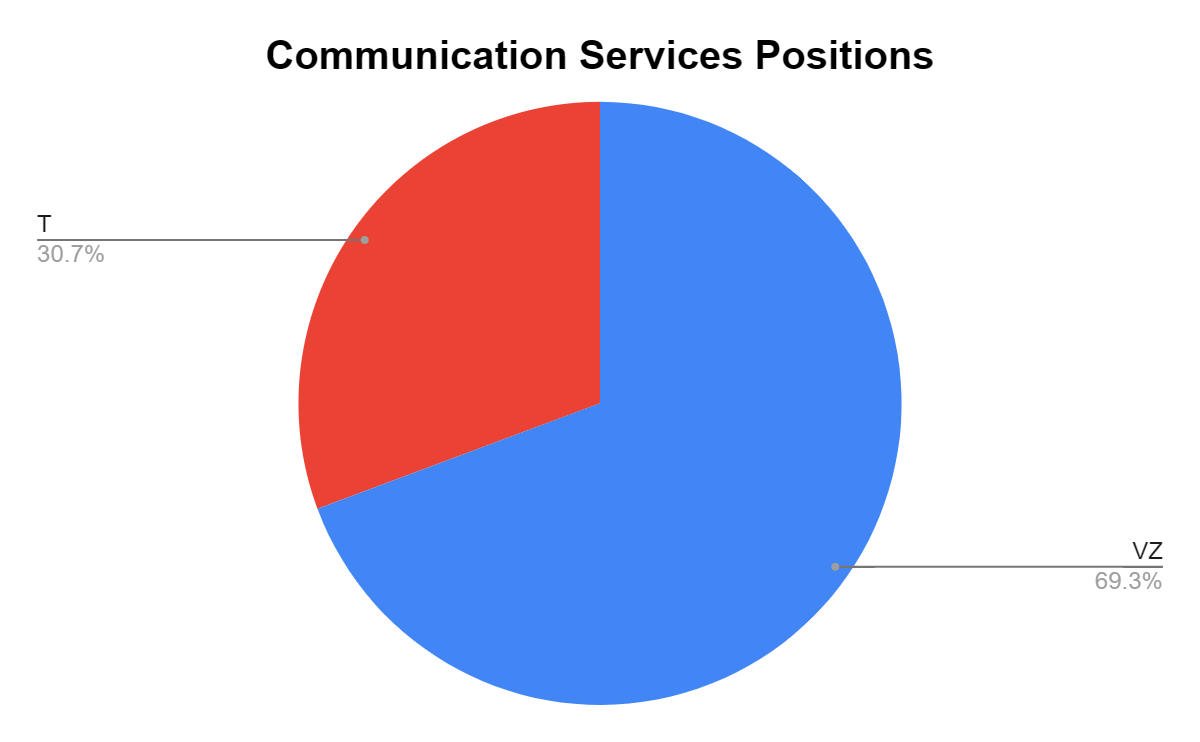
| Communication Services |
| $693.20 |
| $11,349.95 |
| 6.11% |
| BDC |
| $687.36 |
| $11,349.95 |
| 6.06% |
| Utility |
| $313.79 |
| $11,349.95 |
| 2.76% |
| Technology |
| $234.54 |
| $11,349.95 |
| 2.07% |
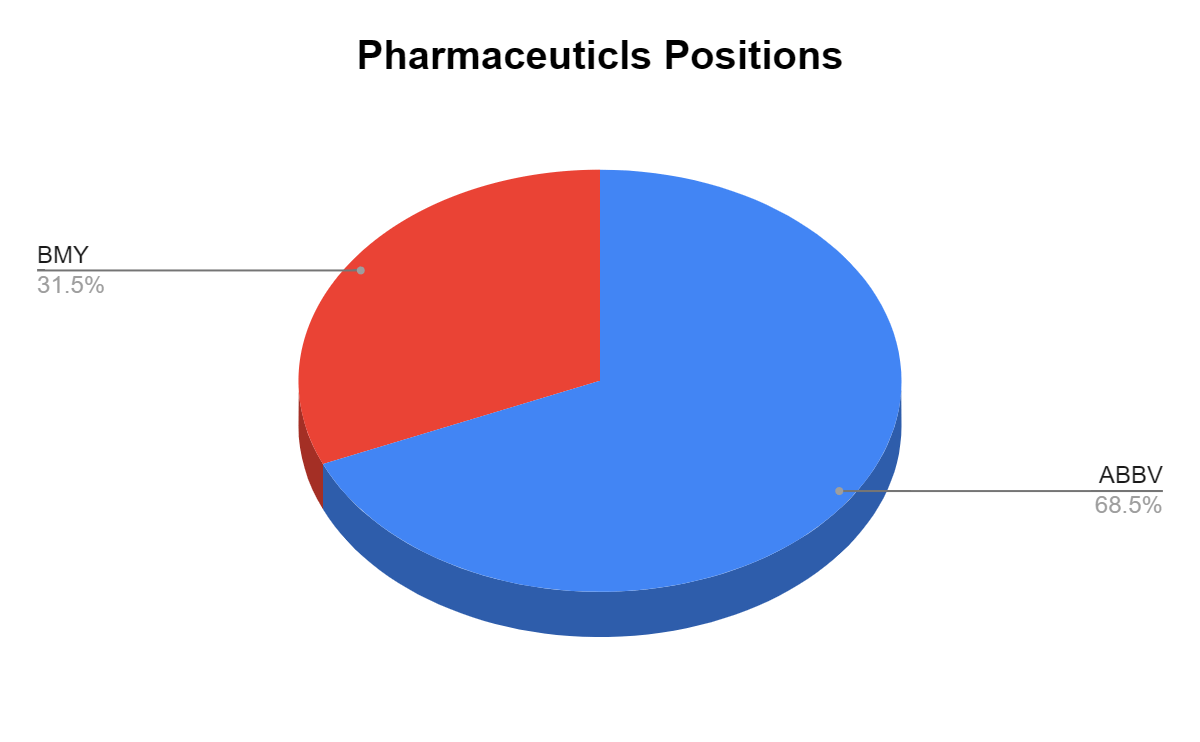
| Pharmaceuticals |
| $226.56 |
| $11,349.95 |
| 2.00% |
| Industrials |
| $212.90 |
| $11,349.95 |
| 1.88% |
| Food & Staple Retailing |
| $196.46 |
| $11,349.95 |
| 1.73% |
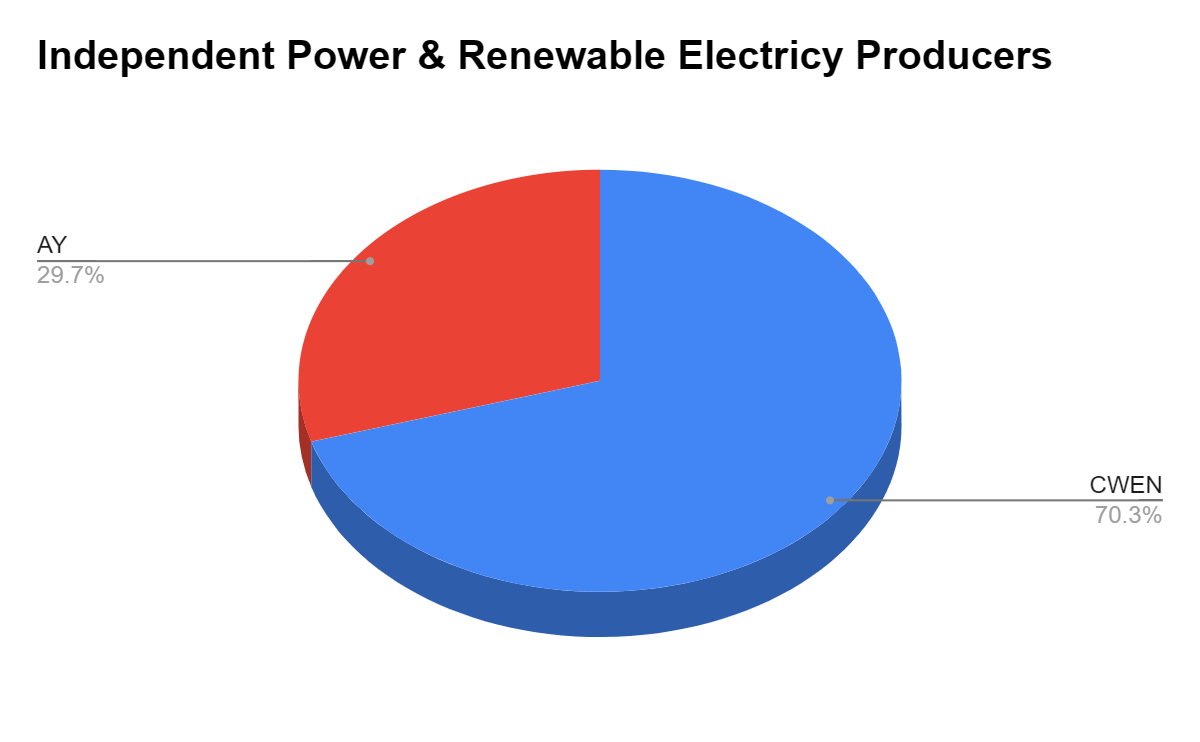
| Independent Power & Renewable Electricity Producers |
| $93.26 |
| $11,349.95 |
| 0.82% |
| Cash |
| $0.28 |
| $11,349.95 |
| 0.00% |
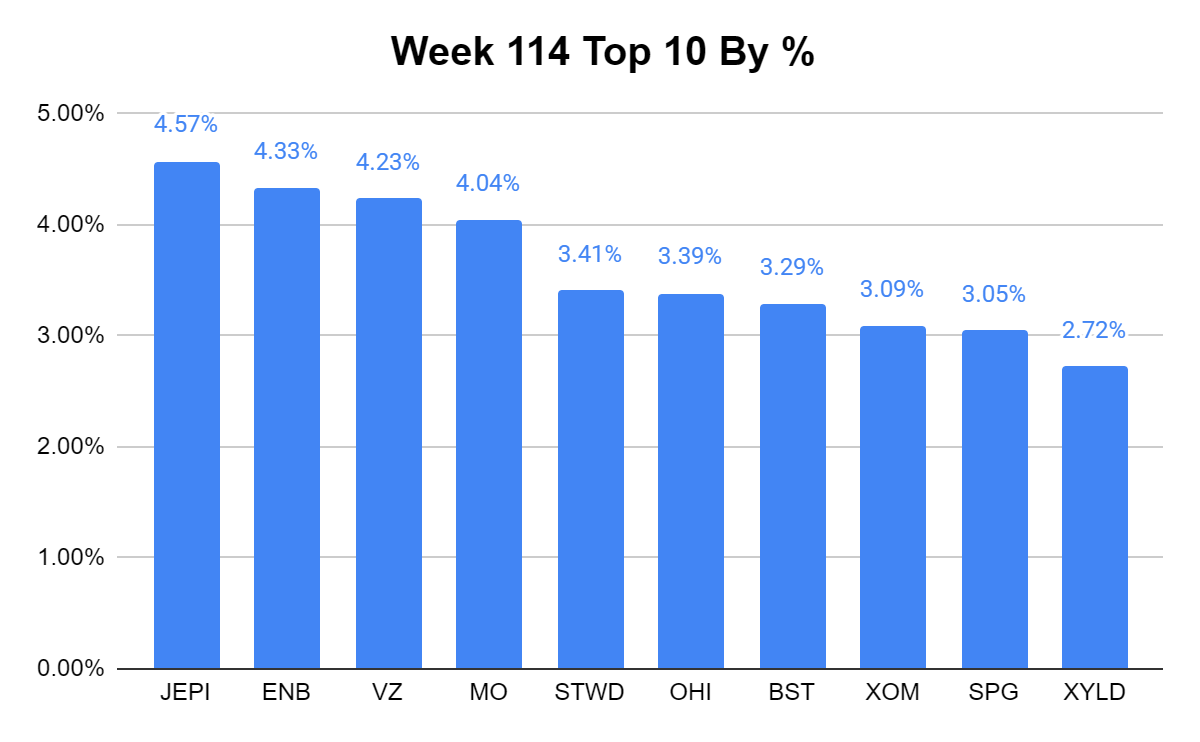
In week 114, the JPMorgan Equity Premium Income ETF ( JEPI ) remained the largest position in the Dividend Harvesting Portfolio. Enbridge ( ENB ) and Verizon remained above 4% and MO crept up above 4% of the portfolio. I think the top end will continue to flatten out over time. I am happy that nothing is too close to the 5% mark anymore.
Week 114 additions
In week 114, I added to the following positions:
- SL Green Realty
- Altria Group
- FS KKR Capital Corp
- PIMCO Dynamic Income Opportunities Fund
SL Green Realty
- My thesis on SLG isn’t changing. I am seeing more people in NYC, and SLG has a moat within office space in proximity to Grand Central Station. Short interest is also 27.95%, and I think they are wrong. The book value for SLG is $67.77 placing its current share price of $22.62 -66.62% below book value. Even if their assets were to get rerated and take a 40% haircut, SLG’s current share price would be -44.37% under book value. I think SLG is a golden opportunity and its yield is above 14%.
Altria Group
- What’s there to say about good old MO? Management is adamant about growing EPS and increasing the dividend annually, and if we do go into a recession, MO should theoretically do even better. I plan on adding more and more of MO over time.
FS KKR Capital Corp
- I have been trying to diversify my BDC holdings because I was very heavy in Ares Capital ( ARCC ). FSK is another interesting play as its book vale is $24.89, placing its current share price of $19.12, -23.18% under book value. FSK is a well-run BDC with a yield of 13.96%. I plan on adding more in the future as there is a disconnect between the share price and its book value.
PIMCO Dynamic Income Opportunities Fund
For further details see:
Dividend Harvesting Portfolio Week 114 $11,400 Allocated, $953.75 In Projected Dividends