ENB:CC - Dividend Harvesting Portfolio Week 121: $12100 Allocated $1032.11 In Projected Dividends
2023-06-29 09:00:00 ET
Summary
- Dividend Harvesting Portfolio experiences a $311.20 downturn, but I remain focused on income-producing assets.
- Portfolio aims to provide a blueprint for constructing a dividend portfolio and demonstrate the benefits of consistent investing.
- I plan to allocate capital away from ETFs to balance sector weight and continue adding to the Dividend Harvesting Portfolio.
Well, the market sold off after testimonies on the 21 st from Fed Chair Powell, Cook and Jefferson, and speeches from several Fed members including Bullard, Mester, and Bowman. Jerome Powell reinforced in prepared remarks for the Semiannual Monetary Policy Report to Congress that nearly all FOMC participants expect that further interest rate increases could be appropriate by end of year. The S&P 500 declined -1.13%, while the Nasdaq retraced -1.46% on the week. Earnings season is right around the corner, and regardless of which direction the markets go in the short-term, I will continue allocating capital toward income producing assets as I see value on the horizon.
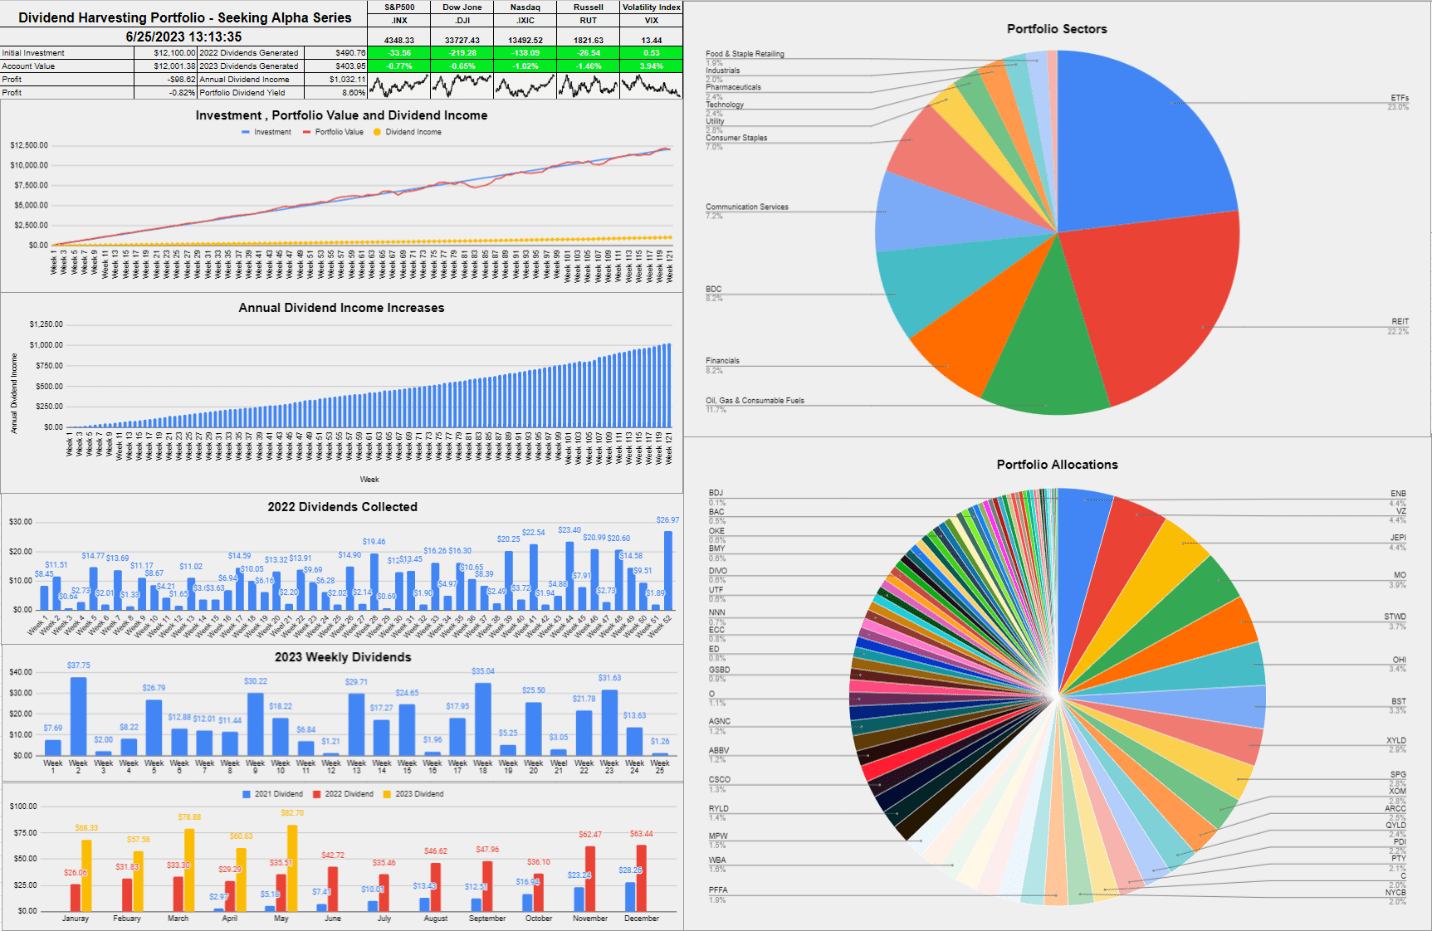
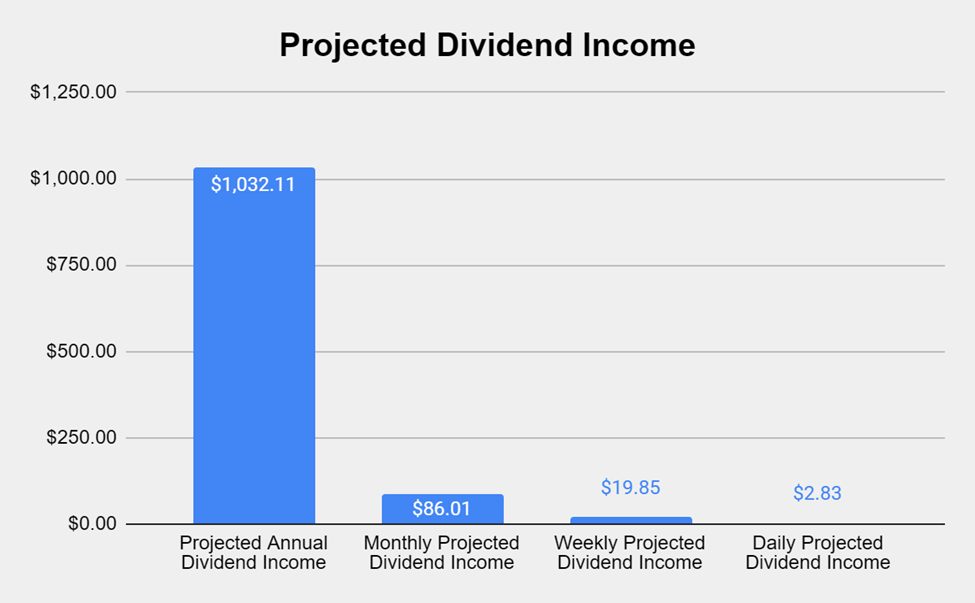
The uptrend that the Dividend Harvesting Portfolio was establishing vanished this week as it took a -$311.20 swing to the downside. After 121 weeks and $12,100 allocated, the balance of the Dividend Harvesting Portfolio is $12,001.38. This was a light week for dividend income as only $1.26 was generated, which brought 2023’s total dividend income collected and reinvested to $403.95. In week 121, I purchased 2 shares of Ares Capital ( ARCC ), 2 shares of FS KKR Capital Corp ( FSK ), and 2 shares of the Goldman Sachs BDC ( GSBD ). At the end of week 12, my projected annual dividend income increased by $12.62 or 1.24% to $1,032.11, which is a forward yield of 8.6%.
I allocate capital toward big tech, funds, dividends, and growth outside of my retirement accounts. These are not my only investments, but I did open a separate account, so I could easily track and document this series. I intentionally created broad diversification throughout the Dividend Harvesting portfolio so I could benefit from sector rotations and mitigate my downside risk on the growth and tech side of my portfolio some of my positions include Apple ( AAPL ), Alphabet ( GOOG , GOOGL ), Amazon ( AMZN ), Palantir ( PLTR ), SoFi Technologies ( SOFI ) and Meta Platforms ( META ).
I'm going to address a question that continues to surface. I'm not trying to beat the market with this portfolio. I love index funds and am invested in several index funds. I love dividend investing due to the stream of cash flow it generates. I don't want 100% of my assets outside of real estate tied to an S&P index fund. I have created a personal investment strategy that works to achieve my investment goals, and having a stream of income generated from dividends is part of my investment strategy. Low-cost index funds are one of the best investments anyone can make in my opinion, and the Dividend Harvesting portfolio is not meant to be a substitute for an index fund. I have read many questions about dividend investing and wanted to start a portfolio from the ground up and document its progress to disprove many misconceptions, including that you need a large amount of seed capital to make dividend investing work for you.
This series has never been about hitting a target yield, generating a certain amount of profit, or beating the market. I had two specific goals with this series. The first was to create a blueprint for constructing a dividend portfolio by documenting the journey starting from the beginning. The second goal was to illustrate how allocating capital each week toward investing, regardless of the amount, would be beneficial in the long run.
Too many people are under the illusion that you need tens of thousands or even hundreds of thousands to benefit from investing. Instead of using my real dividend portfolio as an example, I decided to start a new account, fund it with $100, and add $100 weekly, providing a step-by-step guide to dividend investing. This methodology doesn't have to be used for dividend investing, and it could be as simple as an S&P index fund or a Total Market fund. Hopefully, this series is inspiring people to invest in their future to attain financial freedom.
A historical recap of the Dividend Harvesting Portfolio’s investment principles
Investment Objectives
- Income generation
- Downside mitigation through diversification
- Capital appreciation
Below are the fundamental rules I have put in place for this Portfolio:
- Allocate $100 weekly to this Portfolio
- Only invest in dividend-producing investments
- No position can exceed 5% of the Portfolio
- No sector can exceed 20% of the Portfolio
- All dividends and distributions are to be reinvested
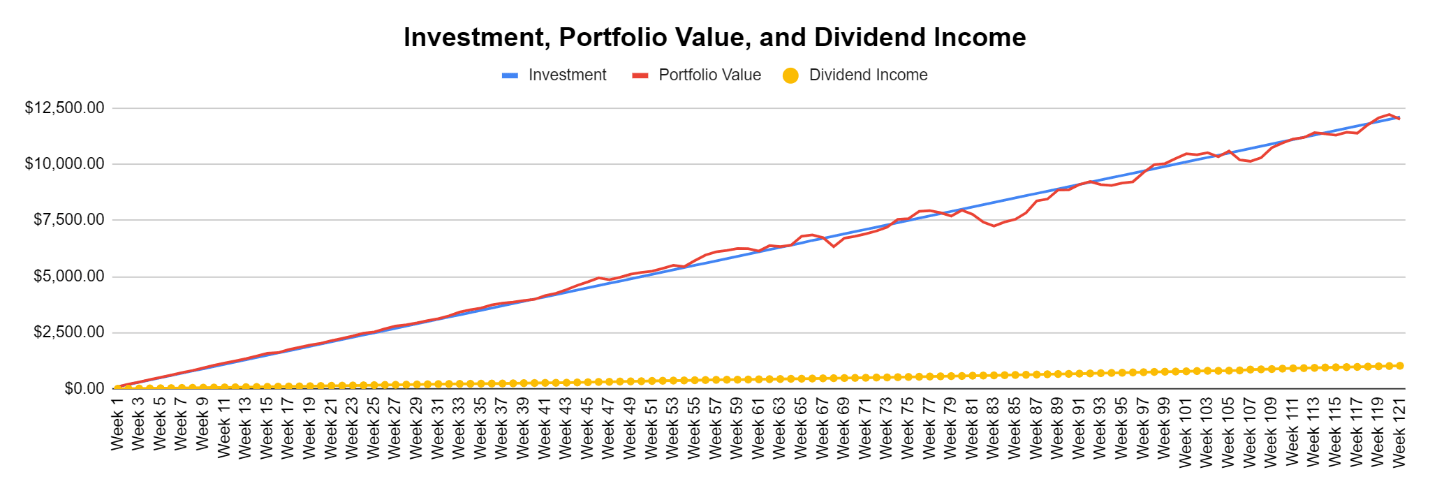
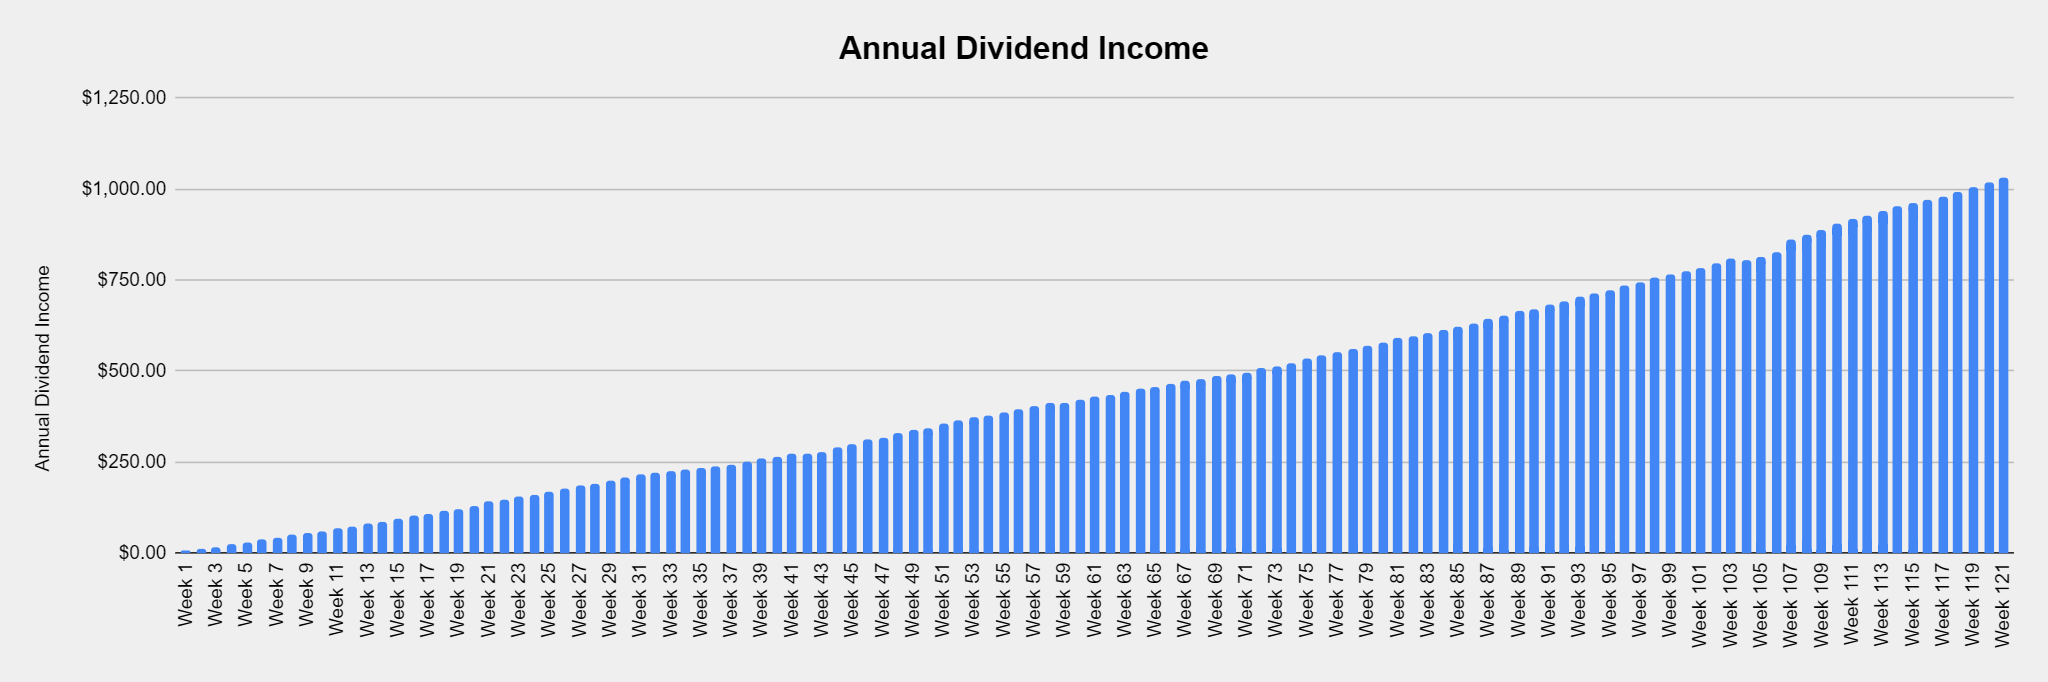
Below is a chart that extends from week 1 through the current week to illustrate the Dividend Harvesting Portfolio's Progression
- Blue line is my initial investment of $100 in week 1, $1,000 in week 10, etc.
- Red line is the account value at the end of each week
- Yellow line is the annual dividend income the Dividend Harvesting Portfolio was projected to generate after that week's investments and dividends reinvested
The Dividend Harvesting Portfolio dividend section
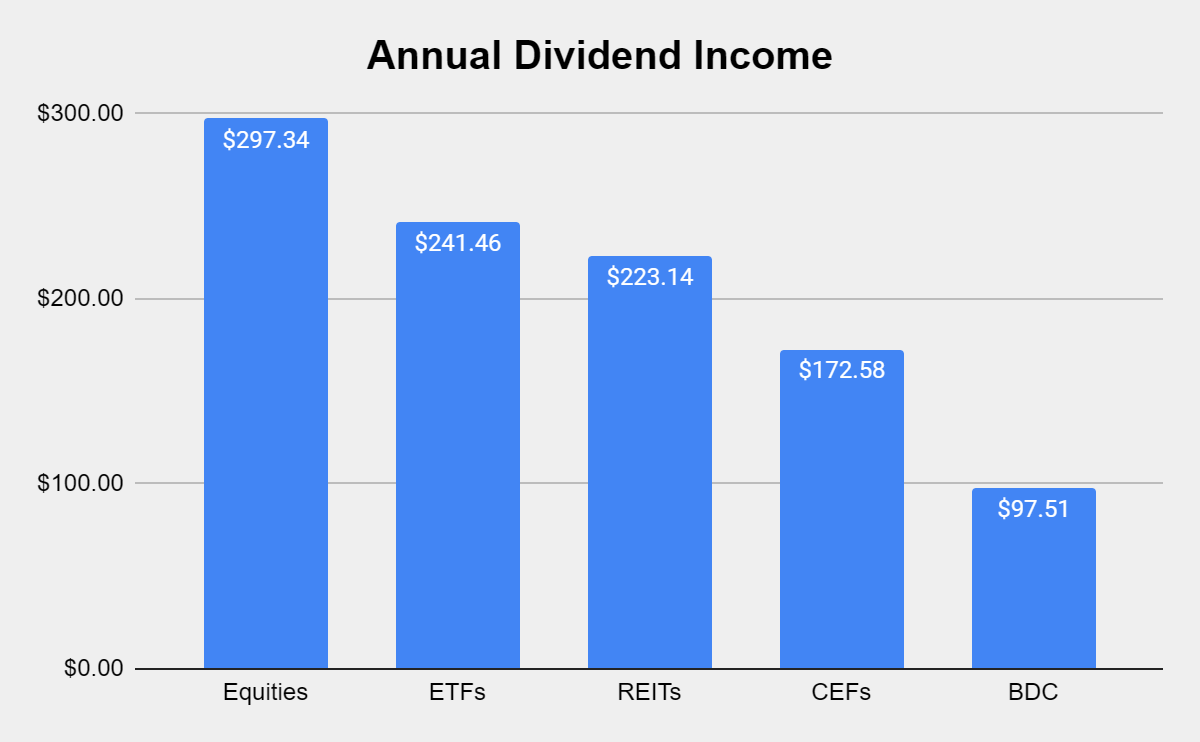
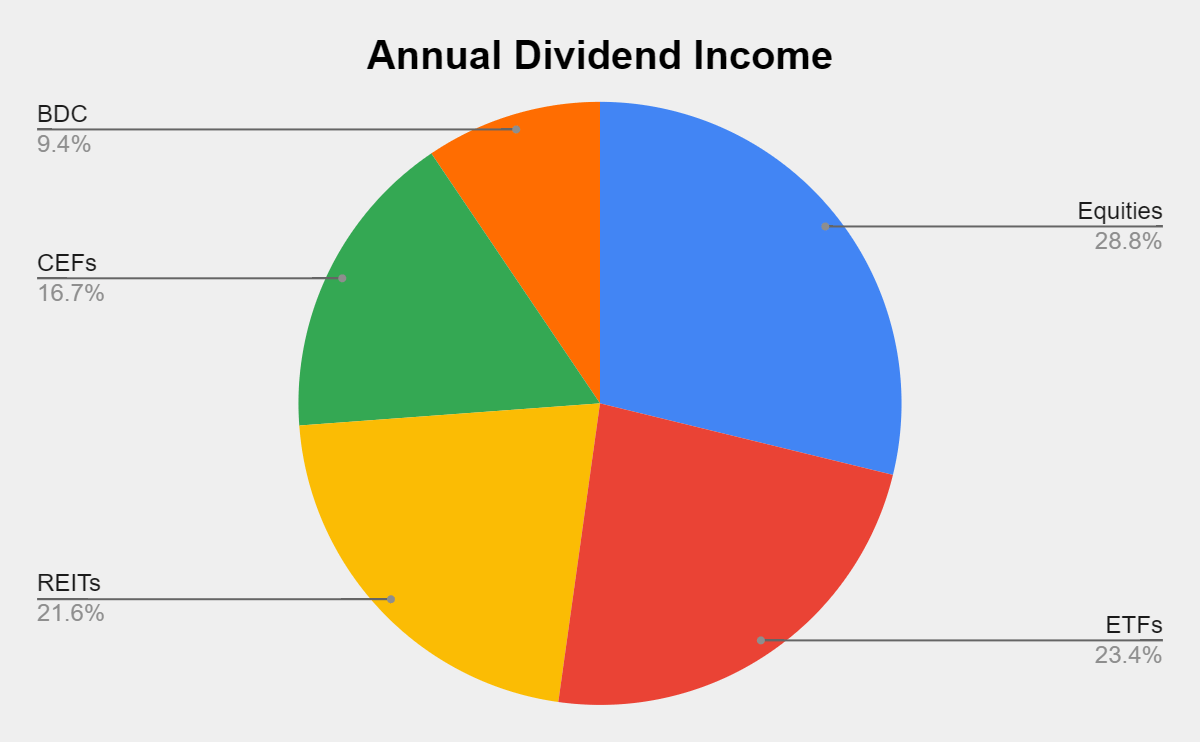
Here's how much dividend income is generated per investment basket:
- Equities $297.34 (28.81%)
- ETFs $241.46 (23.40%)
- REITs $223.14 (21.62%)
- CEFs $172.58 (16.72%)
- BDCs $97.51 (9.45%)
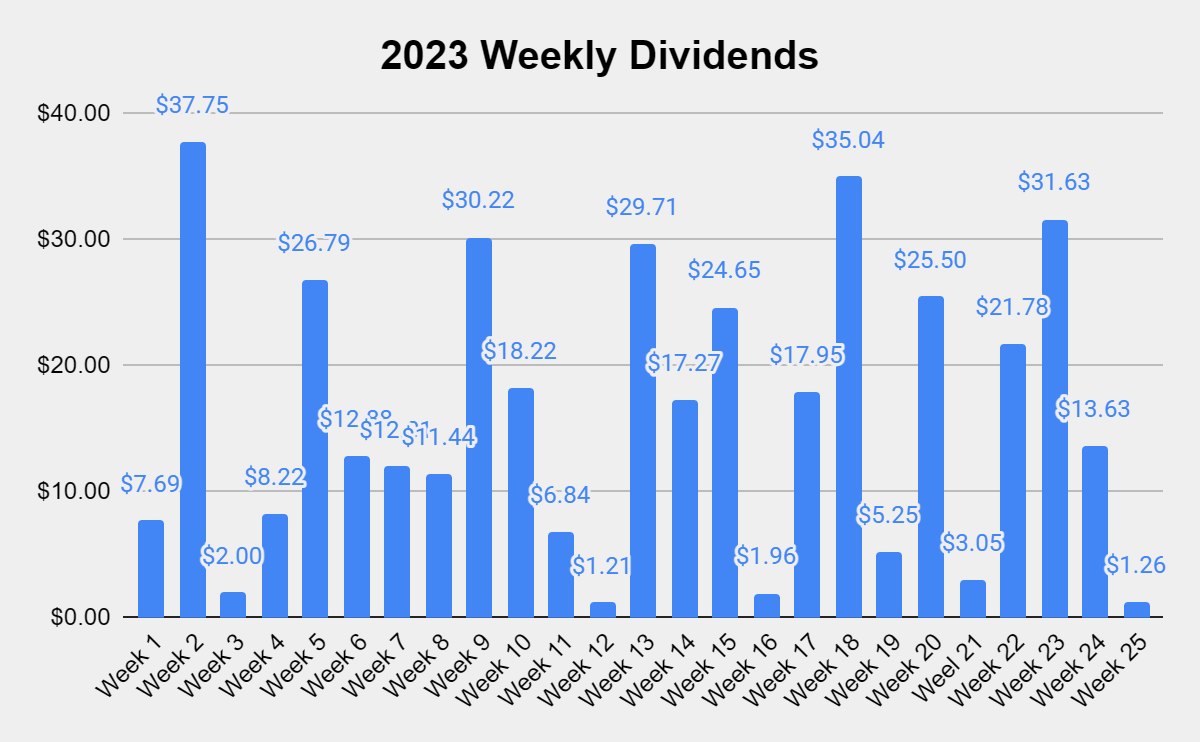
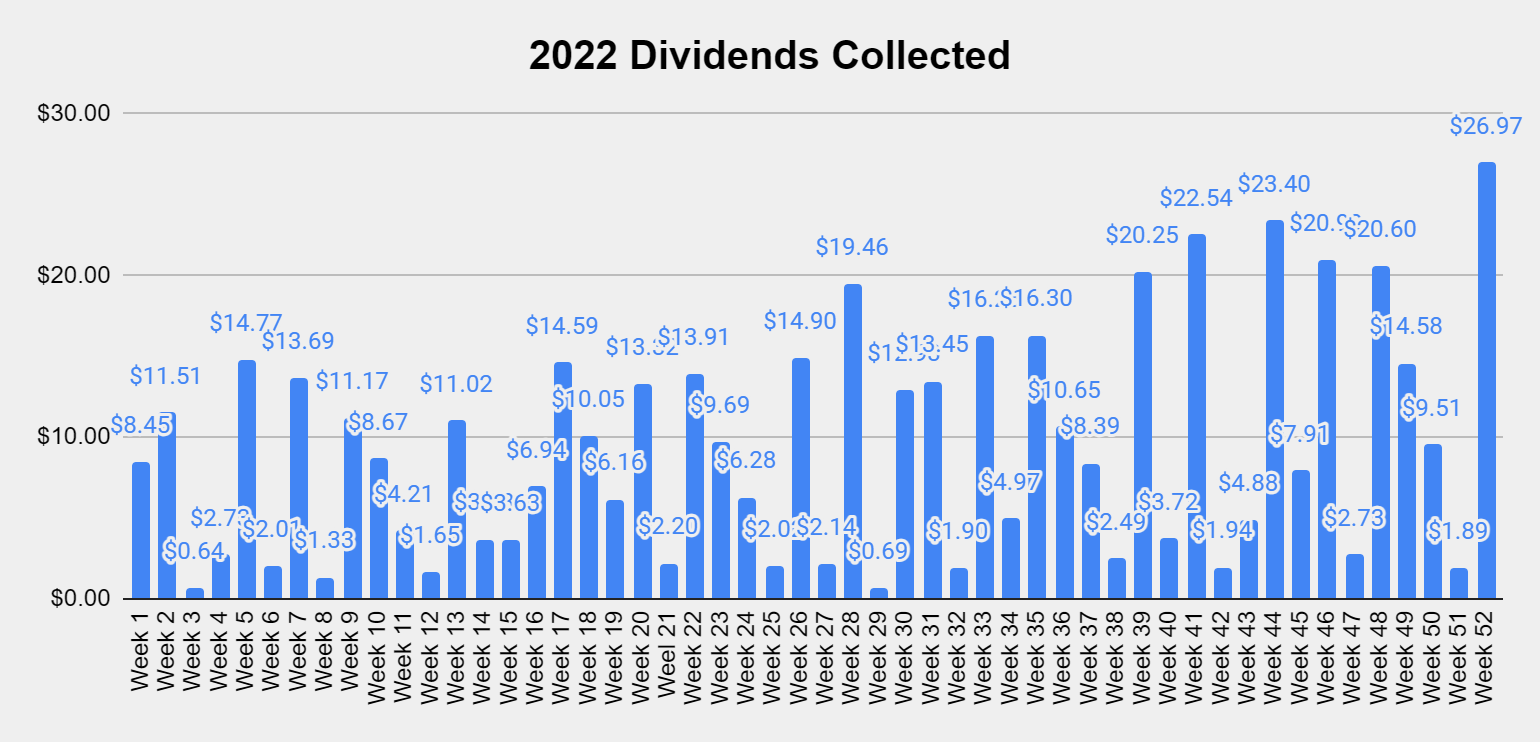
Collecting dividends can serve many functions in a portfolio. Some investors utilize dividends to supplement their income and live off of them. I'm building a dividend portfolio for myself 30 years into the future. In 2022, I collected $490.76 in dividend income from 533 dividends. In week 25 of 2023, I collected $1.26 in dividends, and in 2023 I generated $403.95 in dividend income. YTD, I have generated 82.31% of my 2022 dividend income from 299 dividends which is 56.10% of the dividends generated throughout 2022.
These dividends allow me to gain additional equity in my investments while increasing my future cash flow in down markets. This style of investing isn't for everyone, but if you're looking to generate consistent cash flow while mitigating downside risk, this method has worked for me. I'm hoping to collect around $1,000 in dividends in 2023, which will be reinvested.
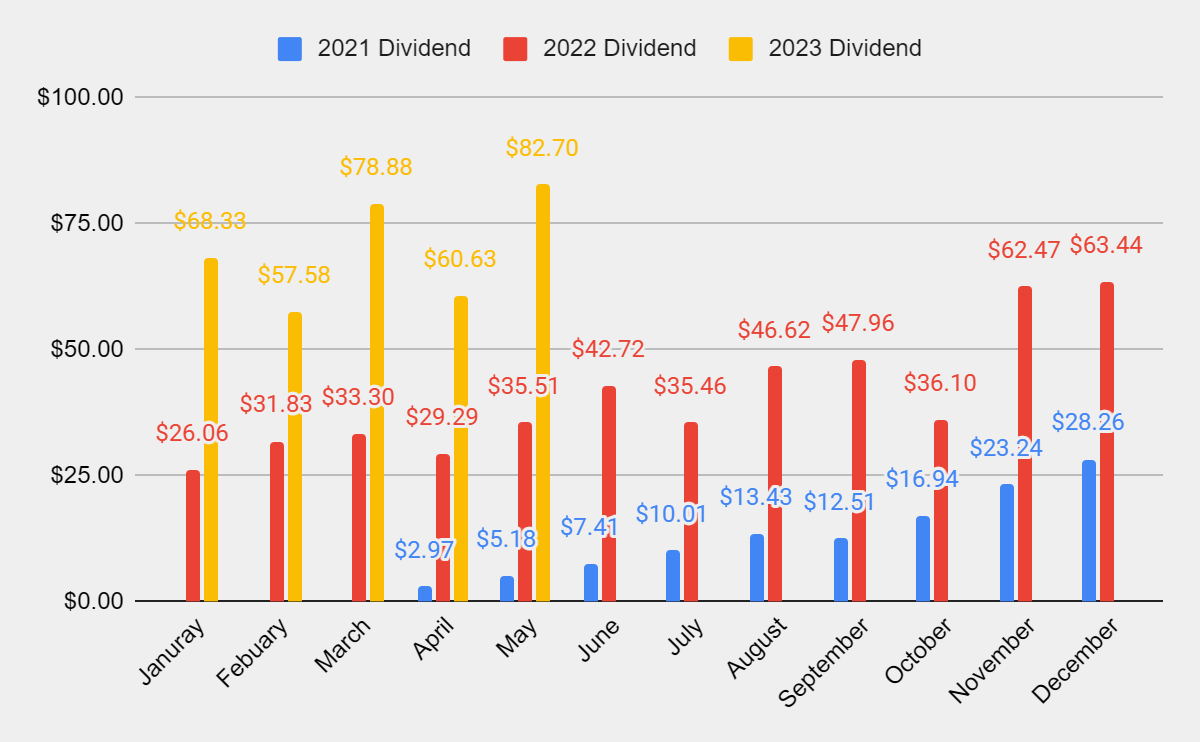
June is coming to an end and I am excited to see what the YoY progress will be. May was my largest month of dividend income to date and I am expecting that the monthly dividend income will reach $100 this year. Throughout May, the Dividend Harvesting Portfolio produced 57 individual dividends and generated $82.70 in income. This is an increase of 132.89% YoY as my dividend income in May of 2023 jumped $47.19 from May of 2022.
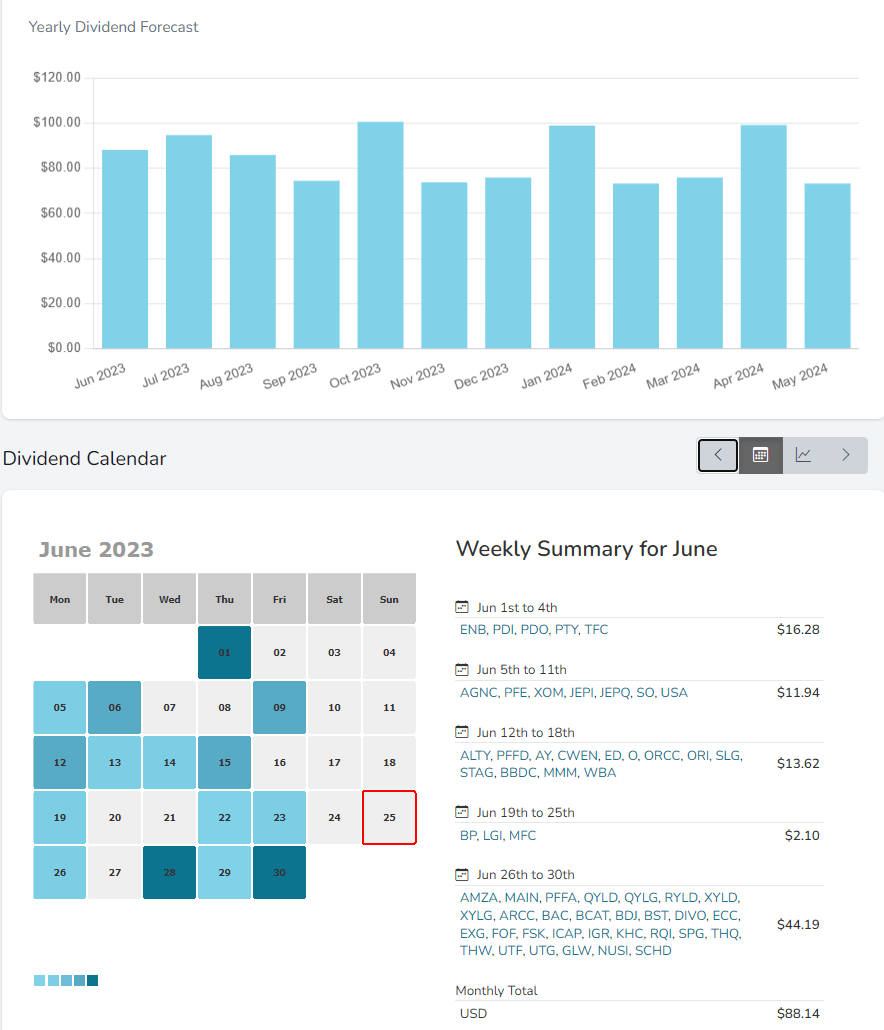
I found a tool that can track and visualize my monthly and weekly dividend income. I plan on showing this graph rather than the full year as it's a better visualization than what I had created. I really enjoy the payout calculator feature as this allows me to see my estimated monthly and weekly income and view every dividend rolling in one place.
This week should be a big week for dividend income as 30 positions should be generating dividends. There is an estimated $44.19 in dividend income being generated, and so we will see what hits the account next week. I am getting closer and closer to my first $100 dividend income month in this account, and eventually each month will be generating at least $100 of dividend income.
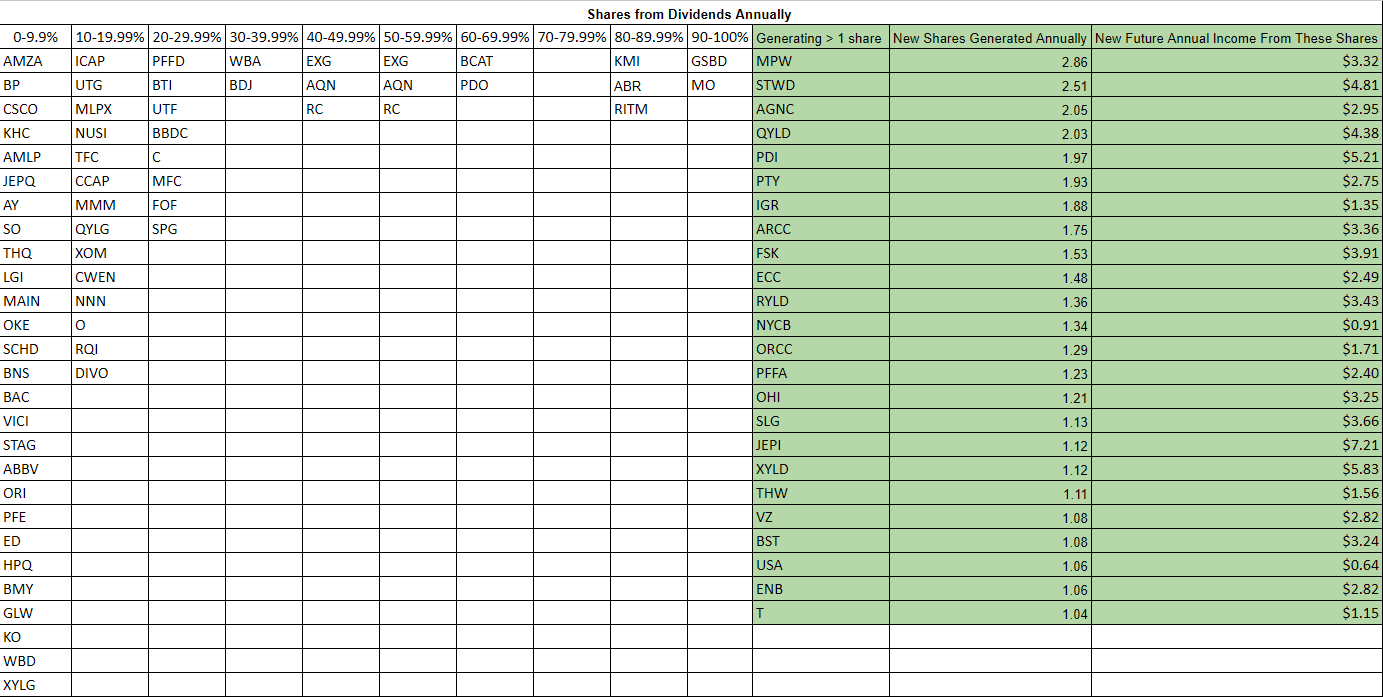
I have broken this into two sections, positions not generating at least one share per year through its dividend and positions that are. In the section for the positions that are, I have shaded it green and added how many shares annually are being generated and the new future dividend income those new shares will generate. There are currently 25 positions generating at least one new share annually from their dividends, and the new annual dividend income generated from these shares is $75.17. Eventually I am going to add shares to the positions that keep fluctuating in and out of the green section to keep them in the green.
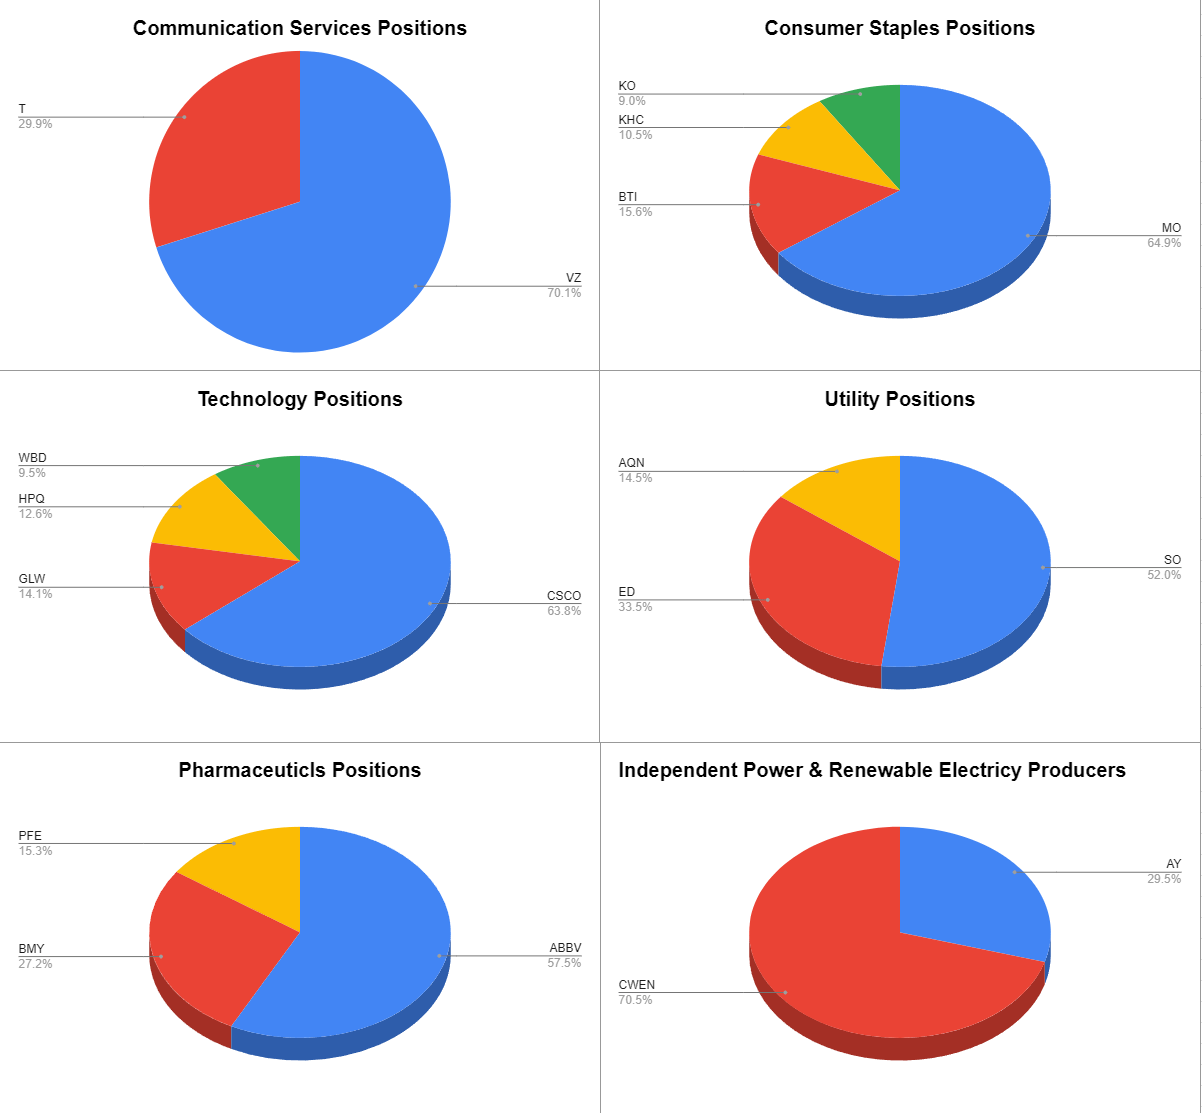
The Dividend Harvesting Portfolio Composition
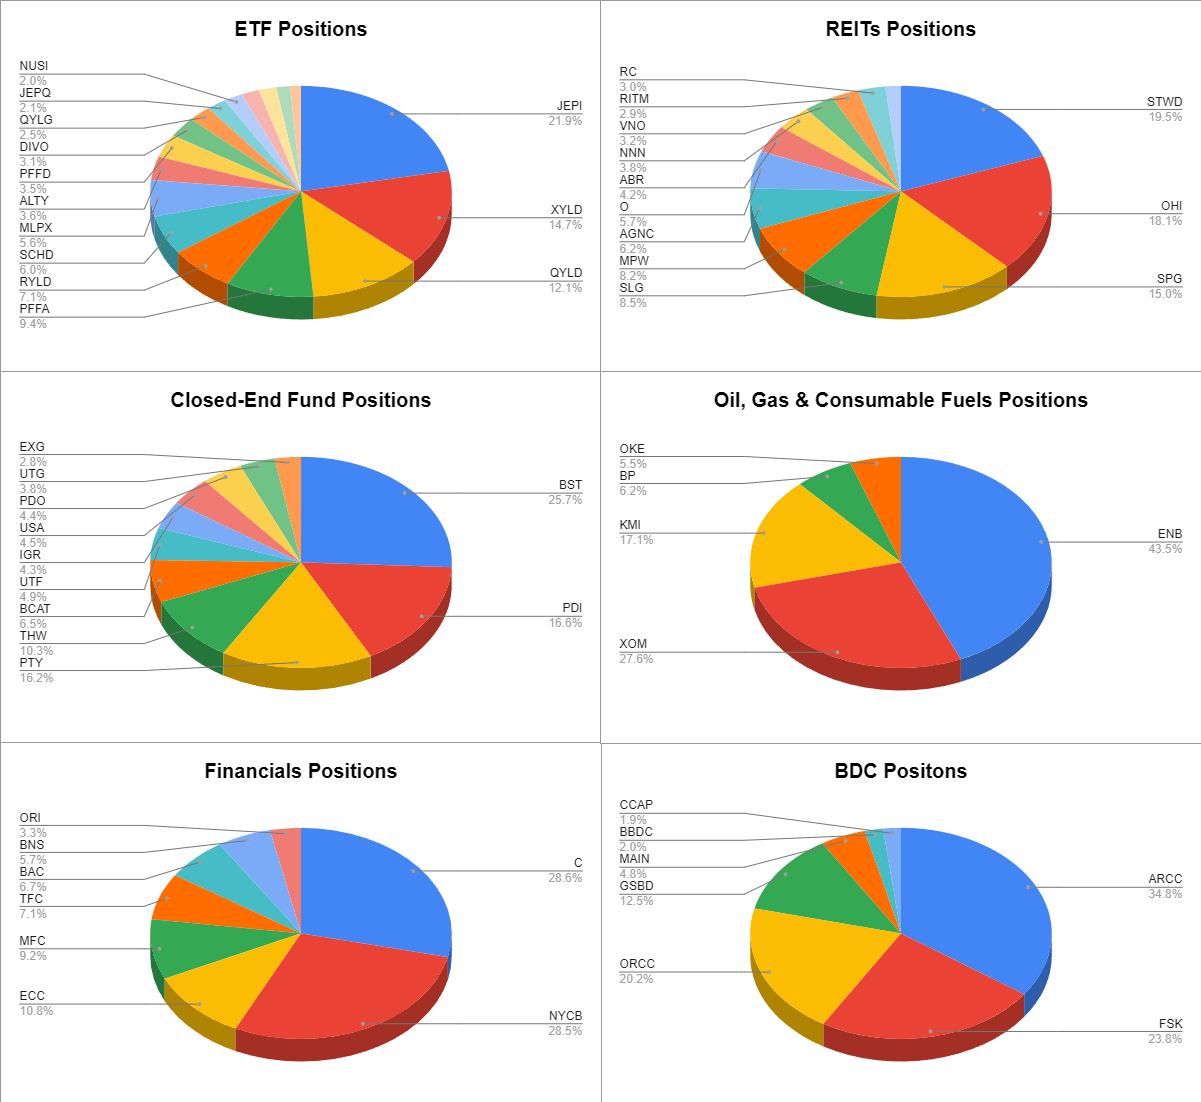
Many of the readers have asked if I could break down the individual positions within these sectors. I created pie charts for each individual sector and have illustrated how much each position represents of that sector of the Dividend Harvesting portfolio. Since I only have one position in Food & Staple Retailing and Industrials, I did not make a chart for those. 3M ( MMM ) and Walgreens Boots Alliance ( WBA ) represent 100% of those sectors. The charts will follow the normal portfolio total I have constructed. Please keep the ideas coming, as I am happy to add as much detail to this series as I can.
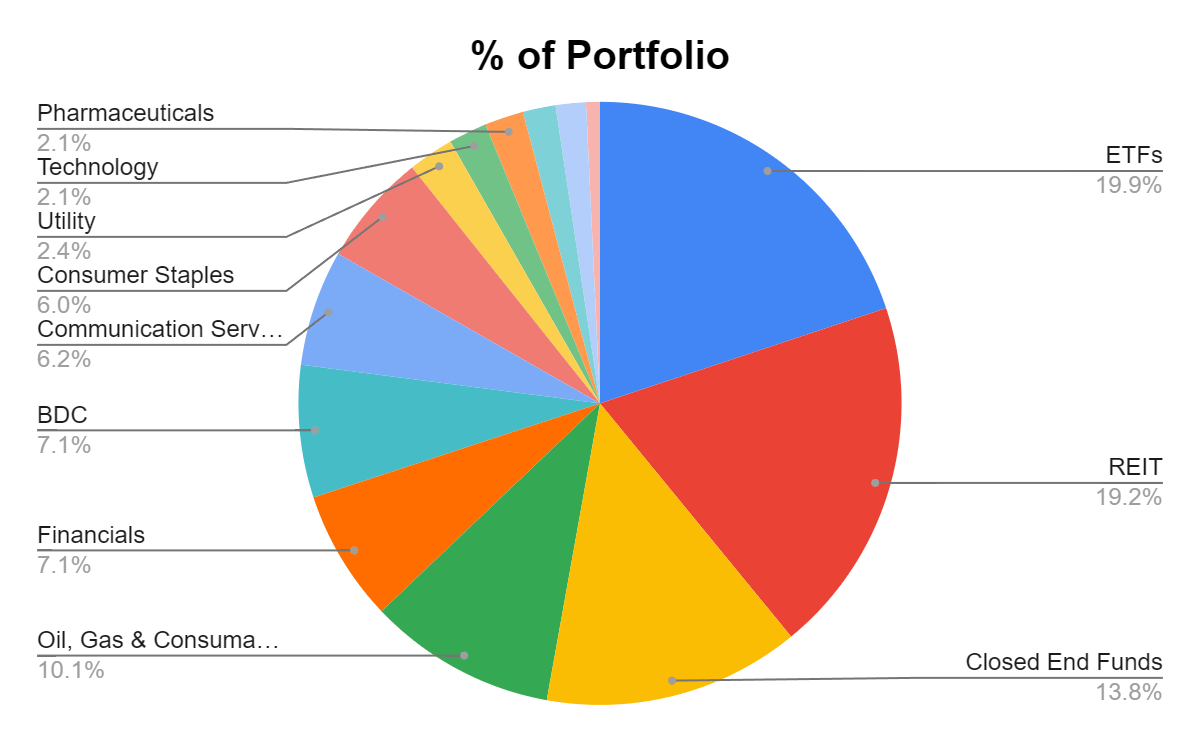
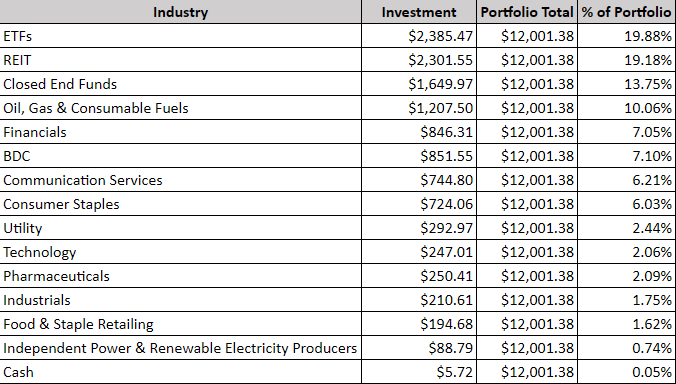
ETFs and REITs are neck and neck for the top sector after week 121. There are a lot of positions within these sector that I want to add to, so I am going to do my best to allocate capital elsewhere for a while to get them to retrace a bit as a percentage of the overall portfolio. Individual equities make up 40.05% of the portfolio and generate 28.81% of the dividend income, while exchange-traded funds ("ETFs"), closed-end funds ("CEFs"), real estate investment trusts ("REITs"), and business development companies ("BDCs"), represent 59.95% of the portfolio and generate 71.19% of the dividend income.
I have a 20% maximum sector weight, so when a singular sector gets close to that level, I make sure capital is allocated away from that area to balance things out. This is the first time I have exceeded 20% in a single sector of the portfolio. I will be allocating capital away from ETFs for a while to get this sector under 20%.
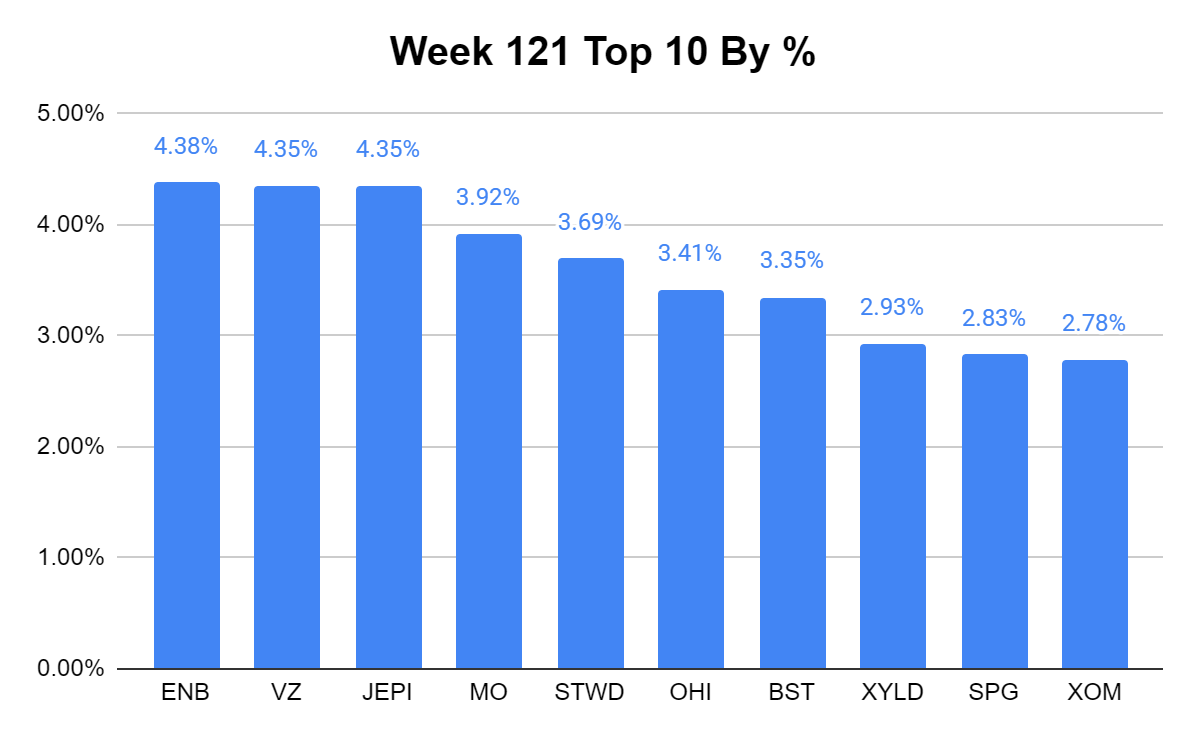
In week 121, Enbridge ( ENB ) was still my largest position in the Dividend Harvesting Portfolio. I am pleased that none of the positions exceeds 4.5% of the portfolio value, and the top 10 are leveling out. Regardless of the market rally, there are still many positions I want to allocate capital toward, and I am excited for what the future holds. Altria Group ( MO ), slipped below 4% but I am expecting that to change very soon as I will be adding to this position.
Week 121 additions
In week 121 I allocated all the weekly capital toward BDC’s. I picked up 2 shares of each of the following companies:
- Ares Capital
- FS KKR Capital Corp
- Goldman Sachs BDC
Ares Capital
- ARCC is the largest BDC by market cap and generates the largest amount of Net Investment Income ((NII)). Shares are trading at a -2.28% discount to NAV with a 10.65% dividend yield. I couldn’t resist as I want to own more of ARCC and feel it’s a great value here as it trades at 7.83 times its NII.
FS KKR Capital Corp
- FSK generated $851 million NII in the TTM which is the 2 nd largest amount in BDC space. FSK looks very undervalued as it's trading at 6.07 times its NII and at a -26.07% discount to NAV. FSK also has a dividend yield of 13.78%. FSK could be the best value play in all of the BDCs I follow.
Goldman Sachs BDC
- I needed a few more shares of GSBD to get it to generate 100% of its share price through annual dividends, and I fell just short in week 121. In addition to having it on my list to cross over to this threshold, I see value in its shares. GSBD trades at a -3.88% discount to NAV, generates a dividend yield of 12.97%, and trades at 6.71 times its NII. I plan on adding more in the future.
Week 122 Gameplan
MO continues to decline in share price and its yield is now 8.66%. I plan on adding to my position in MO, in addition to GSBD, Kinder Morgan ( KMI ), and Arbor Realty Trust ( ABR ) in week 122.
Conclusion
While the trend of finishing in the black was snapped in week 121 things are going well. No matter what has been thrown at this portfolio it’s been able to mitigate risk well while generating an ongoing stream of dividend income. Regardless of if the market declines or appreciates through the upcoming earnings season I will be adding to the Dividend Harvesting Portfolio each week. There are 88 individual positions within the Dividend Harvesting Portfolio and my forward projected dividend yield is 8.6%. I expect this to decline over time, but even as the forward yield declines, the amount of income generated will continue to increase with each purchase. Thank you for reading and I look forward to interacting with everyone in the comment section.
For further details see:
Dividend Harvesting Portfolio Week 121: $12,100 Allocated, $1032.11 In Projected Dividends