EDOW - DJD: Yield-Weighted Dow ETF Solid Despite Headwinds (Technical Analysis)
2023-03-06 14:05:32 ET
Summary
- Invesco Dow Jones Industrial Average Dividend ETF is an exchange-traded fund that simply takes the 30 stocks in the Dow Jones Industrial Average and equal-weights them.
- This delivers a portfolio that is vastly different than the traditional Dow 30, which has a quirky weighting system based on the dollar price of each stock.
- Based on my technical analysis of all 30 Dow stocks, DJD is a very good long-term way to own the Dow. But the short term looks like a struggle.
By Rob Isbitts.
My usual approach to evaluating exchange-traded funds ("ETFs") is to start with a profile report that outlines the basics of the fund: its strategy, holdings, and an analysis of its strengths, weaknesses, opportunities and threats ("SWOT"), and conclude by answering 2 important questions: do I want to follow this ETF for future consideration in my portfolio, and if so, do I want to own it now?
However, in this case, I'm taking a break from that usual profile approach we have used more than 100 times to cover a variety of unique and relatively small ETFs. Instead, I'm going to take the Invesco Dow Jones Industrial Average Dividend ETF ( DJD ), and run it through my usual technical analysis process. The goal is not so much to see if the Dow (DJI) itself looks good here. I'm on record throughout the past 18 months of saying that, while any investment can make money at any time, the broad stock market is much more likely to fall sharply than rise sharply over the next year or so. By "sharply," let's use a 20% move to quantify this.
In this recent article, I delve more deeply into how I handicap the S&P 500 (SP500). The Dow and S&P 500 tend to track each other closely over time, though the Dow had one of its best relative return years in 2022. And, with investors clamoring for yield as always, and T-Bills and the bond market in general offering plenty of "eye candy" to consider with those jacked-up yields, this seems to be an ideal time to look at an ETF that weights the Dow 30 stocks by yield, not price, as is the traditional way.
Current technical analysis of the Dow 30, my way
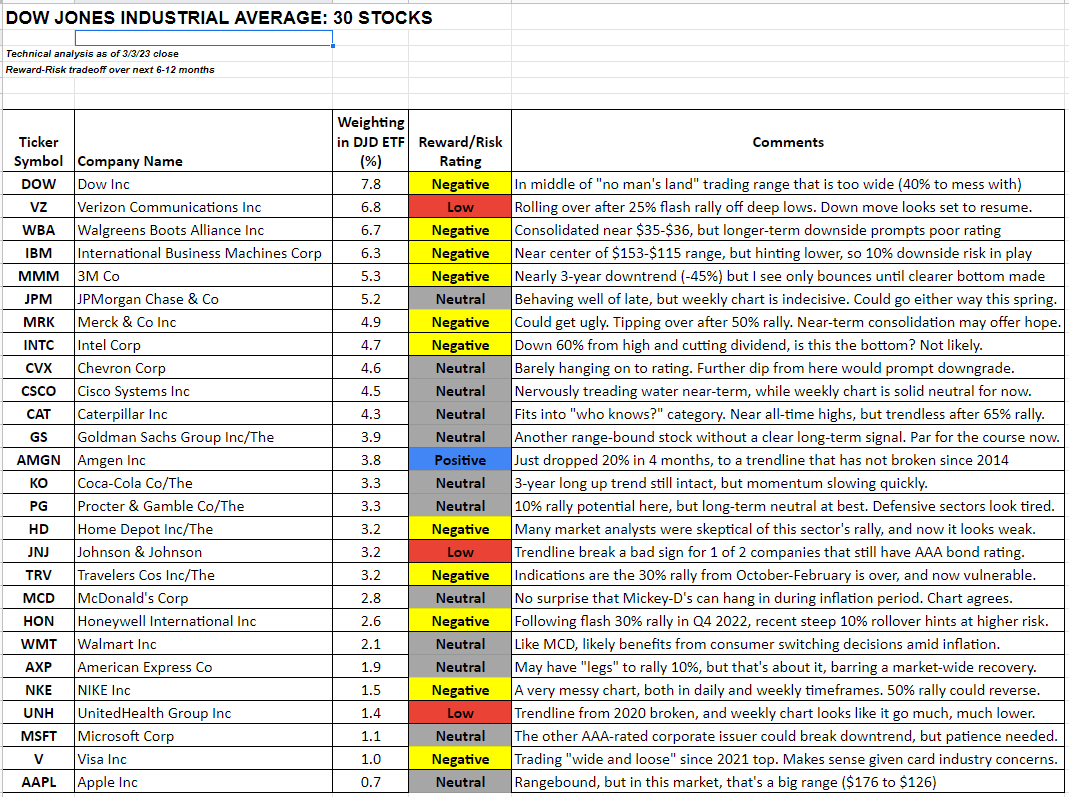
I'm a technician at heart, and there is plenty of fundamental analysis on Seeking Alpha to do as deep a dive as one wishes into these 30 blue-chip names. To offer a differentiated but complementary take on that, here's my review of the Dow 30, chart-wise, with a 6-12 month outlook. I used daily and weekly price charts here, and grouped the 30 stocks into 5 color categories, as I do frequently on paper in my own research.
The key to this analysis is that I am not saying which stocks will perform best or worst. That's a fool's errand. Instead, I'm showcasing something I have done for decades using exactly the method I did for this article. The emphasis is on the amount of risk of major loss I think investors are taking on each Dow stock right now, as compared to the reward potential of that stock. I'll conclude by putting it all together using the current portfolio allocation of yield-weighted Dow ETF DJD as a guide to evaluate the reward-risk trade-off of that fund. You might call this a bottom-up analysis of an ETF.
Based on the response I get in the comments section of Seeking Alpha to this article, I am up for doing so on a wider variety of equity ETF portfolios.
The results: blue-chip stocks, but few blue (positive) technical ratings
Here is the color grading scale I have used for decades in my own private technical analysis work, to arrive at that trade-off between reward potential and potential for major loss from the current price, and over the next 6-12 months.
I have automated this entire process into a quantitative grading system. However, I find that it helps to put human eyeballs (mine and those of my mentees and co-workers) on this. If the past few years have taught us anything as investors, it is that nothing should be left 100% to an algorithm or historical tendencies.
In that spirit, here is the color-coded grading chart, and immediately below it, my current analysis of the Dow 30 and some quick comments to help explain my work.
Technical Analysis reward-risk tradeoff: color-coded grading system (Modern Income Investor (Rob Isbitts))
The Dow 30: Rob Isbitts' technical view as of 03/03/23 market close (Modern Income Investor (Rob Isbitts))
But wait, there's more (3 Dow stocks that aren't in DJD)
There are 30 stocks in the Dow, but only 27 in DJD. That's because it is a yield-weighted ETF, and for the first time I can remember, studying the Dow for decades, 3 stocks (10% of the membership) do not currently pay a regular cash dividend. Salesforce, Inc. ( CRM ) never has, and both The Boeing Company (BA) and The Walt Disney Company ( DIS ) cut theirs a few years ago and have not reinstated them. But since this article is about not only DJD, but some broader analysis of the Dow 30, here's a "bonus" section with my chart analysis of the 3 zero-yield Dow stocks.
3 Dow stocks that don't pay dividends (Modern Income Investor (Rob Isbitts))
How now, venerable old Dow?
The Dow's price-weighted allocation mechanism made it the standard in defining the U.S. stock market for decades. It was not until the 1990s when the S&P 500 started to replace the Dow as the most popular market benchmark. Some consider the Dow to be outdated. I don't. While I acknowledge that it is missing a few important stocks, and that it includes a few that probably should no longer be there, I still see the classic DJIA as a useful indicator of what the "stock market" is doing.
DJD is a nice core holding that provides a premium yield to the broad stock market. The ETFs' trailing 12-month dividend yield is around 3.2%, nearly twice that of the 1.7% yield of the SPDR Dow Jones Industrial Average ETF ( DIA ), which tracks the standard, price-weighted DJIA. But in my years of studying the Dow, I have developed the opinion that when its yield is around 2.5% or higher, that offers an excellent reward/risk tradeoff.
At the depth of the stock market selloff in 2020, DIA yielded 3.3% and DJD had a dividend yield of 4.3%, following the aforementioned, sudden dividend cuts by some components. So in order to get very bullish on DJD, I'd prefer to see the yield up around 4.5%, which is around where 3-year US Treasury Notes yield these days. That's also below where T-Bills pay currently.
DJD: the final word for now
So, the Dow and this yield-weighted ETF version of it are certainly on my radar, and very much worthy of consideration versus many other areas of the equity market right now. But DJD's biggest drawback in the current stock market climate is the same as most other ETFs I track: T-Bills offer low-risk return, when the stock market offers return, but at a still-elevated risk level.
With the tools I displayed above, for the first time publicly after 20 years of doing this type of work "under the radar," I hope that I can investors in the quest many of us share, even if we all approach it differently: making consistent, confident investment decisions, with risk-management as a primary goal.
For further details see:
DJD: Yield-Weighted Dow ETF Solid Despite Headwinds (Technical Analysis)