AVDV - DLS: Attractive Valuation And Yield Average Performance
2023-07-09 08:09:59 ET
Summary
- WisdomTree International SmallCap Dividend Fund holds over 800 global small- and mid-caps weighted on total dividends.
- The fund is well-diversified across holdings, but it is overweight in Japan and in industrials.
- Valuation is attractive among peers, but past performance is average.
This dividend ETF article series aims at evaluating products regarding the relative past performance of their strategies and quality of their current portfolios. As holdings and their weights change over time, reviews may be updated when necessary.
DLS strategy and portfolio
WisdomTree International SmallCap Dividend Fund ( DLS ) started investing operations on 06/16/2006 and tracks the WisdomTree International SmallCap Dividend Index. It has 863 holdings, a 12-month distribution yield of 4.97% and an expense ratio of 0.58%. Distributions are paid quarterly.
As described by WisdomTree , the underlying index selects companies in the bottom 25% of the market capitalization of the WisdomTree International Equity Index after the 300 largest companies have been removed. They are rebalanced annually based on annual cash dividends paid (not yields). The parent index excludes the U.S. and Canada.
About 71% of asset value is in small and micro-cap companies per Fidelity classification, and 29% in mid-caps. The fund is quite balanced between Europe (about 48%) and Asia-Pacific (about 47%), with most of the remaining part in Israel (2.8%). The next chart plots the countries weighing more than 1%, which represent almost 98% of asset value in aggregate. Japan is the heaviest country by far (28.8%), followed by the U.K. (14.2%) and Australia (13.7%). Other countries weigh no more than 6%.
The heaviest sector is industrials with 24% of asset value. Then, come consumer discretionary, financials, materials and real estate, each one in an 11% to 14% range. Other sectors are below 8% individually and 25% in aggregate. The fund is quite light in defensive sectors, so we can expect its price to be volatile.
Sector breakdown (Chart: author; data: WisdomTree)
The portfolio is well diversified across holdings: 6% of assets is in the top 10 names, and the heaviest one weighs only 0.77%. As a consequence, risks related to individual companies are very low.
| Name |
| Ticker / Exchange |
| Weight % |
| SSAB AB |
| SSABA SS |
| 0.77% |
| D/S Norden |
| DNORD DC |
| 0.74% |
| Sims Metal Management Ltd |
| SGM AU |
| 0.63% |
| Azimut Holding SpA |
| AZM IM |
| 0.61% |
| Coface |
| COFA FP |
| 0.60% |
| Sydbank A/S |
| SYDB DC |
| 0.58% |
| Charter Hall Long Wale Reit |
| CLW AU |
| 0.55% |
| VGP |
| VGP BB |
| 0.52% |
| Deterra Royalties Ltd |
| DRR AU |
| 0.51% |
| CSR Ltd |
| CSR AU |
| 0.50% |
Past performance
Since 7/1/2006, DLS shows a total return of 105% (4.3% annualized), and a maximum drawdown of -63%. The share price has gained about 18% in 17 years, which is far from offsetting the cumulative inflation of 49% (based on CPI).
The next chart compares total returns from January 2010 of DLS and three other non-hedged global small cap ETFs:
- Vanguard FTSE All-World ex-US Small-Cap ETF ( VSS )
- Schwab International Small-Cap Equity ETF ( SCHC )
- iShares MSCI EAFE Small-Cap ETF ( SCZ )
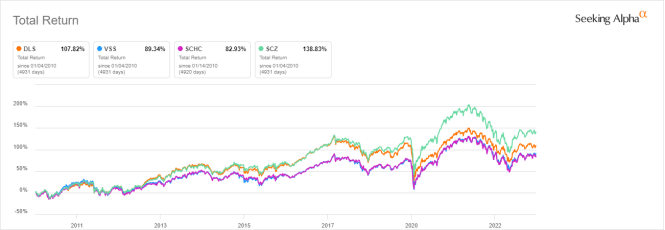
DLS lags SCZ and beats the two other funds. In the last 12 months, it has been the worst performer of the group, even after including two competitors with more recent inception dates:
- Avantis International Small Cap Value ETF ( AVDV )
- Schwab Fundamental International Small Co. Index ETF ( FNDC )
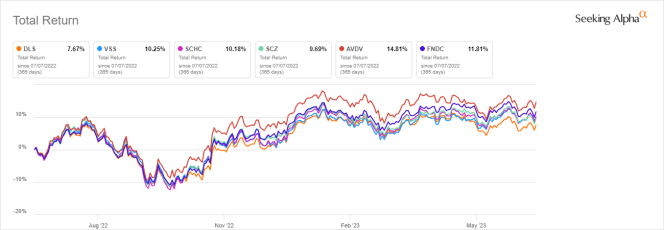
The next table compares the current aggregate valuation ratios of these funds. DLS is cheaper than SCZ, VSS and SCHC regarding all ratios, but it is significantly behind the actively managed fund AVDV.
| DLS |
| SCZ |
| VSS |
| SCHC |
| AVDV |
| FNDC |
| Price/Earnings TTM |
| 9.71 |
| 12.62 |
| 12.17 |
| 12.03 |
| 7.2 |
| 11.32 |
| Price/Book |
| 1.08 |
| 1.28 |
| 1.31 |
| 1.29 |
| 0.91 |
| 1.03 |
| Price/Sales |
| 0.62 |
| 0.8 |
| 0.85 |
| 0.82 |
| 0.51 |
| 0.53 |
| Price/Cash Flow |
| 6.26 |
| 8.14 |
| 7.58 |
| 7.6 |
| 4.05 |
| 6.04 |
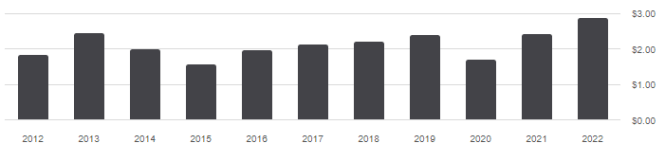
The annual sum of distributions has increased from $1.85 to $2.87 per share between 2012 and 2022. This is a total growth rate of 55%, beating the cumulative inflation of 29% (based on CPI).
Annualized distributions per share from 2012 to 2022 (Seeking Alpha)
Takeaway
WisdomTree International SmallCap Dividend Fund holds over 800 global dividend stocks outside the U.S. and Canada weighted based on paid dividends, mostly small-cap companies. The portfolio is heavily invested in Japan (27.6% of asset value) and in industrials (24%), but it is well-diversified across holdings. Compared to competitors, the fund is in the middle of the pack regarding past performance since 2010, but it has been lagging in the last 12 months. It is well-ranked in valuation. The dividend growth rate beats inflation, but share price couldn’t keep pace with it, implying a decay in inflation-adjusted capital. This fund is appropriate for investors seeking exposure to global small cap companies and an attractive yield. However, Avantis International Small Cap Value ETF looks better regarding fundamentals and performance.
For further details see:
DLS: Attractive Valuation And Yield, Average Performance