DMO - DMO: Discount Narrowing Drives Results
2023-07-20 15:17:21 ET
Summary
- The Western Asset Mortgage Opportunity Fund has seen its discount narrow from the deepest levels it was at previously.
- The fund increased its distribution despite coverage still coming in light, though the good news is seeing NII increase due to floating rate exposure.
- DMO's portfolio is made up of both residential and commercial MBS exposure, as well as some smaller allocations to other asset-backed securities.
Written by Nick Ackerman, co-produced by Stanford Chemist.
The last time we covered Western Asset Mortgage Opportunity Fund ( DMO ), I had been fairly cautious, but the discount looked quite attractive. Since that update, the fund has put up some respectable returns. The last update was at the end of March, which is when we were still in the midst of the banking crisis and exactly what damage was going to be done was unknown.
Unfortunately, despite results being fairly respectable since then, it has primarily come from the fund's most attractive feature. The most attractive feature was the fund's discount. This resulted in the share price outperforming the NAV results fairly considerably.
YCharts
Albeit the fund's discount remains fairly deep here at just over 10%, but not as tempting as the 15%+ discount previously.
Additionally, the fund increased its distribution despite my hesitation and expectation for a distribution cut. That being said, the distribution coverage actually didn't improve materially. They just raised the distribution while it's still not being covered. This is the key reason why distribution cuts and increases can be so difficult to try to predict because funds can essentially pay out whatever they'd like.
The Basics
- 1-Year Z-score: 0.62
- Discount: -10.18%
- Distribution Yield: 11.52%
- Expense Ratio: 1.77%
- Leverage: 41.78%
- Managed Assets: $235.01 million
- Structure: Perpetual
DMO's investment objective is "current income, with a secondary investment objective of capital appreciation." To achieve this, they "provide a leveraged portfolio, consisting primarily of non-agency residential mortgage-backed securities ("RMBS"), commercial mortgage-backed securities ("CMBS") and mortgage whole loans."
The fund utilizes a liberal amount of leverage. When including the leverage expenses, the fund's expense ratio goes to a total of 3.80%. Similar to credit facilities, we noted previously that the fund's borrowing costs were going to experience higher costs due to rising rates. To offset those, the fund had hedged with futures contracts and interest rate swaps. The fund also carries some floating rate exposure in its underlying portfolio that would naturally offset the negatives of higher borrowing costs.
This fund is quite small, and that can cause issues with trying to buy and sell in larger batches of shares. With the significant leverage, it increases the size materially but is still fairly small. Interestingly, they have actually been repurchasing shares despite already being a tiny fund. These repurchases were quite small, at only 13,982 shares in Q2. However, repurchasing shares at a discount is positive for CEFs as it can be accretive to NAV. Since initiating a share repurchase program, they've repurchased 81,710 shares.
Performance - Discount Narrowing
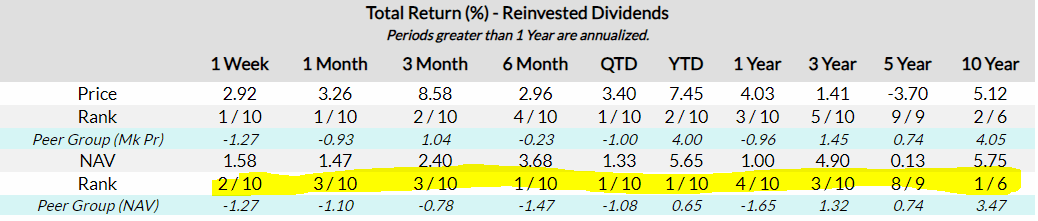
Over most periods, DMO ranks highly against its peer groups. In fact, this has improved substantially as it's now moved to the number one spot YTD from rank #4. It also went from rank #6 to #4 on a 1-year basis, and the 3-year rank gained a spot, going from rank #4 to #3. It has retained its #1 ranking over the last decade as it was previously.
Of course, I cautioned against what exactly is being shown as peers in our prior update. Several funds blatantly don't belong in this category and wouldn't be considered even remotely close to being peers.
Still, this data at least can show us the historical results against some other CEFs that are primarily fixed-income investments. Even if all of these 'peers' shouldn't necessarily be included, it gives us an overall broader sense of color on the fund's historical performance. That said, it is admittedly fairly weak results but better off than this basket of funds in general.
In terms of the fund's discount, the current discount remains attractive though off some of the deepest levels in more recent history. In my opinion, one reason for this is an overall broadening of participation in the market rally this year. As a second reason, the fund has been performing better and was at a historically deep discount, which could naturally lead to some contraction.
YCharts
However, with a narrowing discount, it could limit some upside potential going forward. Not to mention that most economists are still looking for a potential recession in the next year. A lot of ifs here, but there could be a reason to believe a deeper discount and potentially better price in the fund could be around the corner with this more economically sensitive fund.
Distribution - Receives a Boost
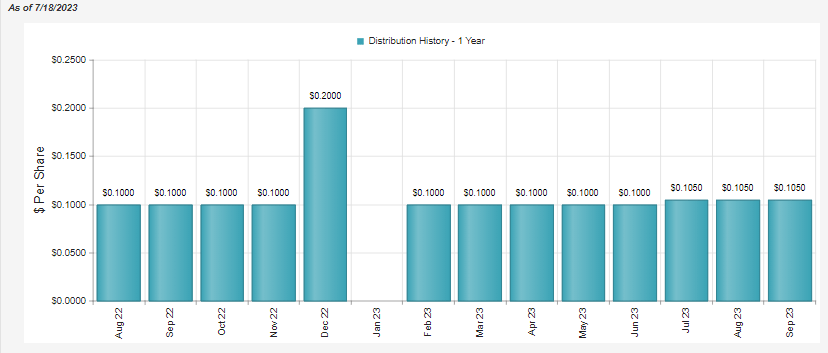
Despite my cautionary tone on a potential distribution cut, we've got the opposite. Since our prior update, they raised their payout to investors by a small amount.
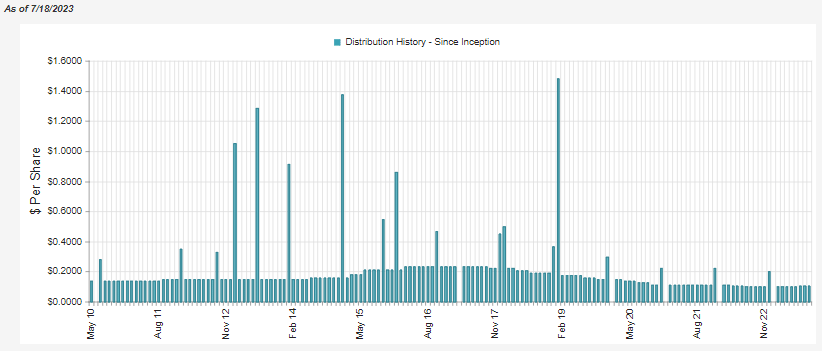
Naturally, as a fixed-income fund that's generally going to be sensitive to the interest rate environment and overall economic environment, there have been many adjustments in its history. Their last cut was in mid-2022, where they took it down from $0.105 to $0.10.
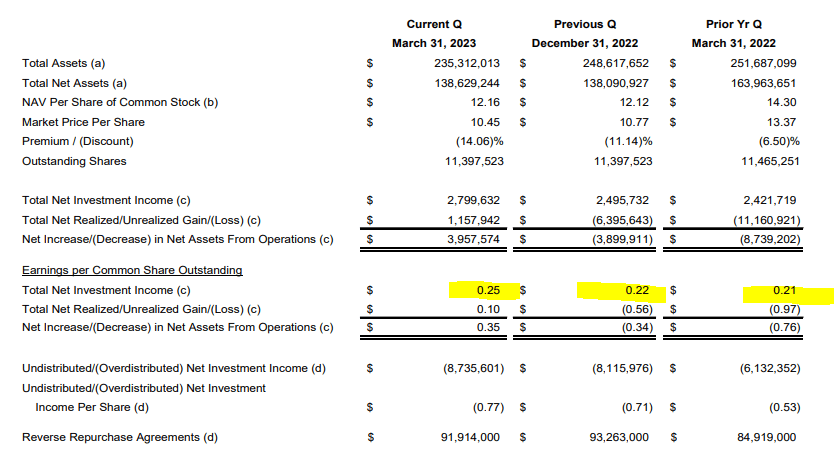
One reason I was cautious about the distribution was a lack of coverage. Coverage in the previous reports showed net investment income was 76.35%. That was an increase from the year-ago period at the time of 65.57%. So they were certainly heading in the right direction. This is also reflected in the latest quarterly financial report, as NII has increased. I had even noted that I expected NII to continue to increase.
NII should continue to trend higher as the Fed continued to increase interest rates after this period. This is also reflecting a period where half-the-year rates were significantly lower as the Fed ramped up aggressively through the end of 2022.
This played out as expected. NII increased quarter-over-quarter and year-over-year. That's the good news.
DMO Quarterly Financials (Western Asset (highlights from author))
I remain cautious because the latest monthly distribution works out to a quarterly payout of $0.315 and it isn't covered. NII distribution coverage remains light at around 80%. However, coverage would have been even better had they not increased their payout.
This keeps them in a position where they will need to rely on derivatives such as their futures, options and swap contracts to generate capital gains in order to cover their payout. We've seen this in the last annual report , where they were pretty successful in generating gains from these sources. On the other hand, the realized portfolio losses overshadowed the gains.
DMO Realized/Unrealized Gains/Losses (Western Asset (highlights from author))
DMO's Portfolio
The weighted average life of DMO's portfolio is fairly lengthy at 11.2 years. Despite this, the fund's effective duration is 4.8 years, which is fairly low relative to the maturity. One of the reasons for this could be due to the floating rate exposure in the fund.
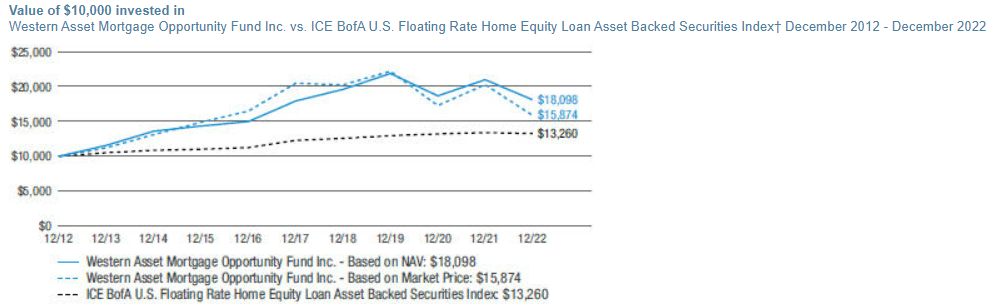
I couldn't find an exact allocation in terms of percentage for what amount of their portfolio was allocated to floating rate investments, but it is seemingly a key piece of their strategy. This is reflected by their benchmark being the IEC BofA U.S. Floating Rate Home Equity Loan Asset-Backed Securities Index. Additionally, looking through their entire holding list as of their last annual report, it's quite clear the majority of the portfolio is noted as being a "variable rate security."
On a side note, this is a benchmark they've been able to crush since inception. Though with the fixed-income market turning more sour in 2022, they've come off from the peak levels of their outperformance.
Regarding the fund's credit quality, we don't have a lot of visibility here as most of the portfolio is "Not Rated."
DMO Credit Quality Breakdown (Western Asset)
This isn't too surprising given that besides being floating rate securities, a good portion of these securities are also exempt from registration. In other words, they are considered Rule 144A securities. They are positions sold to qualified institutional buyers such as Western Asset that can hold them in DMO and provide access to retail investors through this more indirect means.
The overall tilt of the portfolio is generally below-investment grade, and it would be assumed that not rated securities would generally be considered to be below-investment grade.
In looking more specifically at the types of securities this fund holds, we are met with a fairly diverse basket of different security types. We have exposure to residential and commercial MBS markets and other asset-backed securities ("ABS"). However, they are all overwhelmingly related to mortgages, as we would expect. The exposure to various ABS of rather particular industries is pretty limited in aggregate.
DMO Asset Type Breakdown (Western Asset)
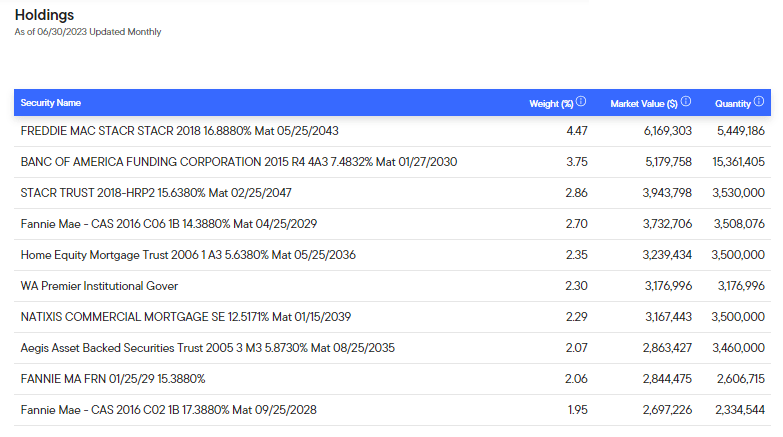
They put the total number of holdings at 333, which on its own can add to a fairly diverse basket of holdings. Even further, since most of these are packaged pools of underlying mortgages, there could be exposure to hundreds or thousands of different mortgages within each listing.
That's why even if we are looking at the top holdings, we could see some fairly substantial weightings. When we normally look at junk-bond funds, you'll generally see hundreds of positions, but each is often less than 1% of the fund.
In this case, we see several positions over the 2% weightings. In my opinion, that does mean the fund is fairly well diversified, even if each position is seemingly making up a fairly large part of the portfolio relative to what we see for junk-bond funds.
This is generally why it will take a broad-based macro event to impact DMO negatively. Rapidly rising interest rates were just such an event, as well as the Covid Pandemic, of which each event significantly impacted DMO's performance.
YCharts
Conclusion
Overall, I'd still consider being fairly cautious with this fund. While the current economic environment continues to remain resilient, mortgages can be one area that could see significant damage. The fund's excessive leverage through reverse repurchase agreements means that any moves (downside or upside) will be amplified. The fund's distribution coverage also isn't great despite seeing a distribution raise recently. The good news is NII has increased thanks to the floating rate exposure. The fund's discount has also shrunk as a result of the share price increasing against a lagging NAV. That's generally not what we want to see when we are buyers of closed-end funds.
For further details see:
DMO: Discount Narrowing Drives Results