FMY - DMO: Strong Long-Term Results But Mixed More Recently
Summary
- DMO was a fund brought up recently that has interested me in the past, but one that I've never covered.
- Over the long-term, this is the best-performing mortgage fund, but other timeframes reflect mixed results.
- At a large discount, the fund could be more compelling than its PIMCO competitor, PCM, at a significant premium.
Written by Nick Ackerman, co-produced by Stanford Chemist. This article was originally published to members of the CEF/ETF Income Laboratory on December 13th, 2022.
Western Asset Mortgage Opportunity Fund ( DMO ) has been around for quite some time. The inception goes back to 2010. While I've run across this fund many times, I've never thoroughly looked into this name. On the surface, it appears to be a relatively attractive mortgage fund with strong long-term results. The fund is also trading at a large discount at this time, making it even more compelling.
On the other hand, the fund's more recent performance has been mixed. On top of this, the fund's distribution coverage has been weak and has led to many distribution cuts over the last year. That's despite one of its main peers, PIMCO's PCM Fund ( PCM ), with much better coverage and a significantly higher yield. They aren't a perfect match, as PCM holds a meaningful allocation to high-yield bonds.
Of course, this fund would only be interesting to an investor if one would want to invest in mortgages. They hold a bit of agency MBS but are primarily invested in non-agency MBS. Agency MBS is relatively safer compared to non-agency.
One of the main areas they invest in are STACR and CAS securities . These are notes that leave DMO on the hook for credit losses and are not guaranteed by Freddie Mac or Fannie Mae, such as an agency MBS would be. So while seeing significant weightings to Freddie Mac and Fannie Mae in their top holdings doesn't mean that these are safer holdings.
The Basics
- 1-Year Z-score: -0.75
- Discount: -12.02%
- Distribution Yield: 11.08%
- Expense Ratio: 1.62%
- Leverage: 39.45%
- Managed Assets: $231.34 million
- Structure: Perpetual
DMO's investment objectiv e is "current income, with a secondary investment objective of capital appreciation." To achieve this, they "provide a leveraged portfolio, consisting primarily of non-agency residential mortgage-backed securities ( RMBS ), commercial mortgage-backed securities ( CMBS ) and mortgage whole loans."
The fund utilizes an elevated amount of leverage. It takes what would be a rather small fund of only around $14.75 million in net assets and balloons it up to over $230 million.
They are leveraged through reverse repurchase agreements. These are impacted by higher interest rates causing the costs on these to rise. The last rate reported was 2.771% in their semi-annual report for the six months that ended June 30th, 2022.
However, they've also hedged against these higher interest rate costs by utilizing short futures contracts. In this way, as interest rate rises, they can realize gains in these derivatives to offset some of the higher expense costs.
DMO Interest Rate Hedges Via Futures Contracts (Western Asset)
Additionally, the fund has underlying holdings that are also floating rate based. Therefore, as interest rates rise, their underlying mortgage-debt securities are also going to experience higher yields as well.
When including interest rate expenses, the latest reported expense ratio comes to 2.38%.
Performance - Discounted, But Mixed Results
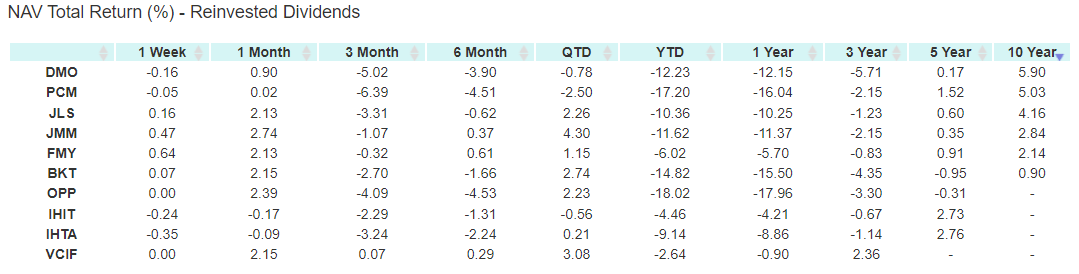
Over the longer term, we can see that on a 10-year annualized total NAV return basis that DMO was the best performing of this rather niche group. I would put a particular focus on PCM, Nuveen Mortgage and Income Fund ( JLS ) and First Trust Mortgage Income Fund ( FMY ). These are closer to being similar to DMO.
BlackRock Income ( BKT ) is also focused on mortgage investments but is almost entirely invested in agency MBS. FMY also has a fairly large agency MBS weighting too. That's always one of the problems with trying to find 'peers' in CEFs. They can get such a niche allocation that they don't truly have peers.
However, we can also see that they came in on the lower side over the last five years, were the bottom performing in the last three years and over the last year, they've come somewhere in the middle.
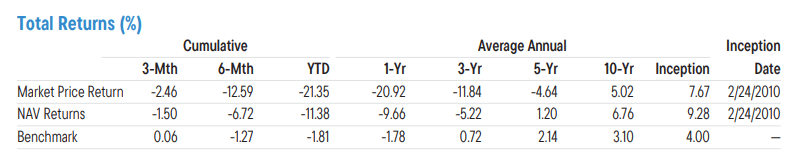
This is also consistent with the fund's returns that they reported in their Q3 fact sheet. Against their benchmark, they've also shown longer-term success but with much more lackluster results recently. They use the benchmark of the ICE BofA US Floating Rate Home Equity Loan.
So these results being mixed make it harder to get a clear picture of a track record. That doesn't guarantee future results, but clearly, something they've been doing more recently hasn't been working out.
In terms of valuation, DMO seems to be the most attractive on that metric. That could mean results in terms of total price return in the future could be relatively better, even if, on a NAV basis, results continue to lag a bit. That's if there is discount contraction, too, going forward.
JLS is also showing a relatively attractive discount. While DMO, JLS and FMY showed a widening discount over the last year, PCM has held around the same premium.
Ycharts
Over the longer term, DMO wasn't always a discounted fund. This deeper discount is actually only been a characteristic of the fund this year.
Ycharts
Distributions - Light On Coverage
In terms of distribution, JLS has recently raised its payout. FMY and PCM have held their payouts steady in the last year. DMO, on the other hand, has been trimming its monthly distribution. Again, another reflection is that it would appear that DMO is having some issues. In 2020, JLS was cutting the distribution quite aggressively and still hasn't topped back to the pre-COVID level.
Ycharts
PCM has held its distribution steady since around 2007. That's quite an impressive run and could be why the fund gets to trade at a massive premium.
In terms of distribution coverage for DMO, it would appear clear why distribution cuts have been the case for the last year. The net investment income coverage has been quite weak at 72.4%, as shown in their semi-annual report for the period ending June.
DMO Semi-Annual Report (Western Asset)
Higher interest rates should have helped coverage with their floating rate exposure. Combine that with their distribution cut, and the payouts in the future should also be lower, which should bring NII coverage higher.
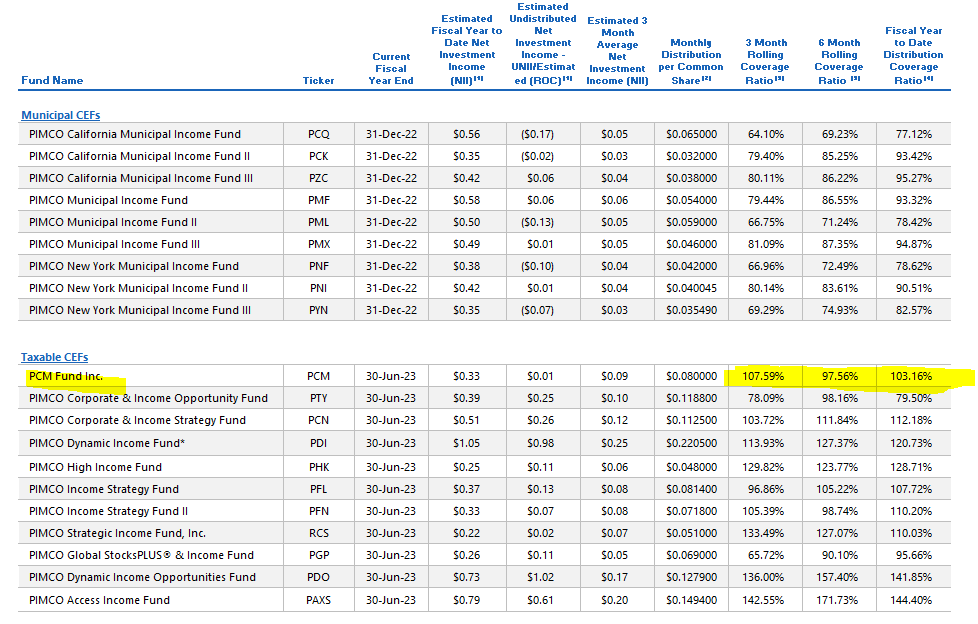
That's exactly what we've seen in a more recent press release; they posted that NII for Q3 was $0.26 . Against the latest, $0.10 monthly would mean that distribution coverage is looking closer to 87%.
What might be a bit more interesting to note is that the current NAV distribution rate comes to 9.75%. PCM has a NAV distribution rate of 13.69%. All else being equal, one could presume that PCM is showing a larger shortfall in coverage. After all, these 'peer' funds should, in theory, be able to generate around the same amount of income from their similar portfolio.
That isn't the case, and PCM's coverage is significantly higher despite the materially higher distribution rate. Again, this could help explain why PCM gets elevated to a significant premium.
DMO's Portfolio
For DMO's portfolio, they hold a mixture of residential and commercial MBS. They carry a higher amount of floating rate mortgages, and that helps keep the effective duration lower at 4.35 years. The weighted average life of their underlying holdings is 11.48 years.
I think the main risk for MBS is going to be the expected recession in 2023. Layoffs start happening when the economy gets tough and people have less money to spend. During recessions, there is less money going around to support businesses to pay their mortgages or rent. While people always need a place to live, it doesn't mean that people can always afford to pay their home mortgage or apartment rent, unfortunately.
DMO Asset Exposure (Western Asset)
That being said, DMO is going to be highly diversified. They hold 328 positions, but since most of these securities are backed by hundreds or thousands of pooled mortgages, their exposure is even wider than it would first appear. That's one of the primary ways for CEFs that carry significant credit risks to help mitigate the risks.
When looking at the credit quality allocation, we are basically in the dark. We are primarily at the mercy of the Western Asset/Franklin Templeton managers on this fund. Nearly 80% of their portfolio is considered "not rated." The reason for this is that most of their portfolio carries Rule 144A securities or those exempt from registration. Qualified institutional buyers, or QIBs, can only buy most of their underlying portfolio securities.
DMO Credit Quality (Western Asset)
While that might seem scary on the surface, it is one of the primary benefits of CEFs when you start getting into the fixed-income side of the space. These are securities that most investors wouldn't normally get exposure to if it wasn't via a fund. That doesn't always mean it's a good investment or not, but it is something you can't go on and buy positions in directly for retail investors.
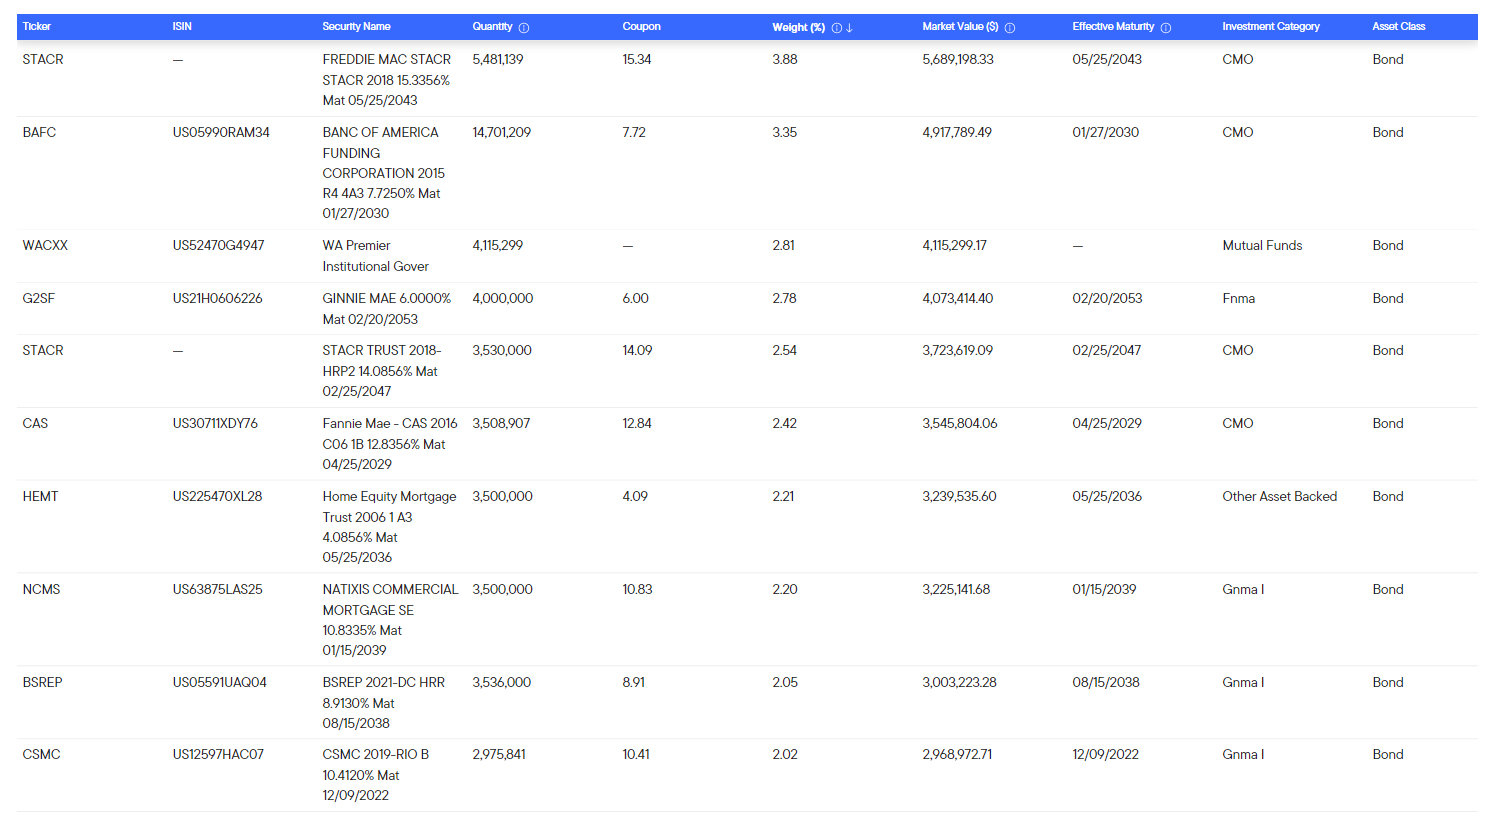
Looking at the top ten holdings is where we can see the larger STACR holding exposure and the CAS security from Fannie Mae. These are the higher risk securities because they are participating in the downside with Fannie and Freddie; these aren't the securitized MBS positions backed by these agencies.
Conclusion
DMO is an interesting fund at an attractive valuation. The distribution cuts seem to be putting coverage on a better path. On the other hand, PCM pays a significantly higher distribution rate and doesn't seem to have the same problem with coverage. The coverage on PCM isn't necessarily the strongest we could see, but it is being covered with a materially larger distribution yield, too. I think that's why we see PCM trading at a premium, while it would indicate that DMO has some problems going on with its underlying portfolio. Or, at the very least, it isn't operating as strongly as PCM.
Overall, it seems that PCM would be the better bet between the two funds. However, investors wanting to get into PCM could be more patient due to a higher valuation. While a discount doesn't seem likely, as it hasn't happened since 2015, there have been periods of lower premiums. In fact, one of the lower premiums was just a short while ago, earlier this year.
DMO could be the value play going forward, as the fund longer-term had generally joined PCM at trading at premiums historically. Investing in DMO now could provide mortgage exposure until PCM comes down to a better valuation.
For further details see:
DMO: Strong Long-Term Results, But Mixed More Recently