UTG - DNP And UTG: Updating Our Outlook On 2 Utility CEFs
2023-03-09 16:35:51 ET
Summary
- DNP and UTG are exceptionally popular CEFs for income investors.
- We had suggested a switch the last time around when we covered these two and we take a look at how the trade has played out.
- We update our thesis and ratings on both funds.
The DNP Select Income Fund (DNP) and Reaves Utility Income Fund (UTG) earn income by investing in securities of companies primarily in the utilities sector. DNP explicitly states that earning and growing income is its primary objective, with capital appreciation being secondary. UTG shoots for a "high level of total return consisting primarily of tax-advantaged dividend income and capital appreciation".
We started covering both last year and while we have been firmly in the bear camp for DNP, we briefly made a buy case for UTG before moving to being neutral on it in our most recent piece. Higher leverage, astoundingly high premium to NAV and a comparatively lower yield prompted us to suggest a switch from DNP to UTG in October of last year.
We think both funds are likely to bounce in the short run and then head lower. DNP remains extremely vulnerable as we don't believe that there is any scenario where it "earns" its distribution over the next 1-3 years. The fund is paying 9% on NAV and utility sector dividend yield is under 3.5%. Rising leverage costs will hurt as well. That likely means that the NAV depletion accelerates over the next few years and this could awaken the prospects of a distribution cut. DNP remains badly priced for this with a massive premium to NAV. We think this warrants a switch to UTG at this point, despite DNP having delivered a better NAV performance.
Source: DNP And UTG: A Switch Makes Sense
The switch did not prove to be more lucrative, but it also didn't hurt the readers that went for it. This was driven by premium expansion as euphoria hit one higher notch of craziness for DNP. The premium for DNP has overshot any sane expectations and is the highest it has ever been.
Its NAV, on the other hand, is closer to the other end of the spectrum. We review the two funds again today and update our thesis.
Fund Basics
With DNP, investors get exposure to 134 holdings versus 46 for UTG according to the most recently published data. UTG is also heavily concentrated, with the top 10 holdings making up about 45% of the fund.
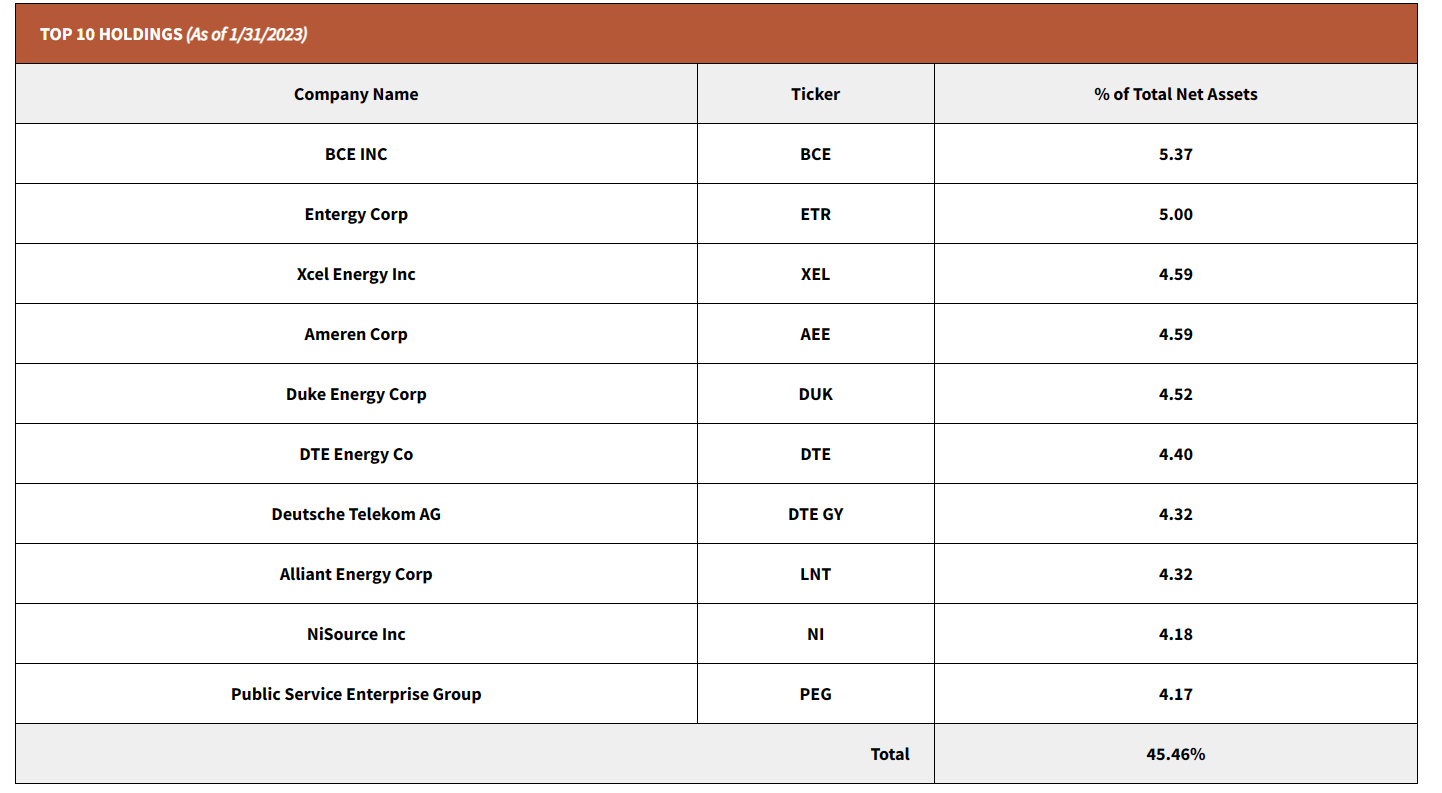
As noted previously, we do not attribute much weightage to the wider diversification offered by the former. The lower number of holdings in UTG offer sufficient diversification to investors who, in the first place, do not put all their money in a single fund. At least we fervently hope they do not.
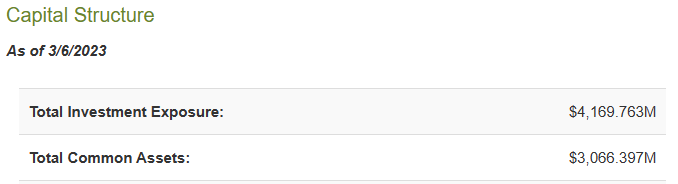
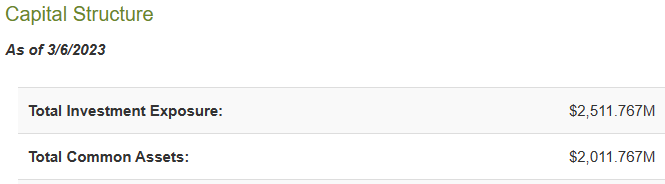
The leverage levels remain around the same since our last review, 26% for DNP and 20% for UTG.
CEF Connect - UTG CEF Connect - UTG
This may be a small difference to most investors, but we think it is an important difference as rates rise. We will note here that both annual expense ratios shown below are as of October 31, 2022, but you can see how DNP's 1.90% is being driven higher by its interest expense.
CEF Connect-UTG
UTG on the other hand is a bit lower at 1.42%, the differential coming from interest expense.
CEF Connect-UTG
Outlook
DNP is primarily a utilities sector fund with some midstream/energy and communication sector help thrown in.
UTG
UTG is similar except that we have energy, real estate and industrials making up the equivalent midstream component
UTG
Some of this is just semantics as the same names are classified differently between the two funds. We can also see that for most of their history their total return NAV performance, tracked each other fairly closely.
In general, going forward, we would expect the NAV level performance to be at least 80% correlated between these two, if not higher. The main driver of that NAV level performance, will come from three factors.
The first being the performance of the utility sector itself. In our view, utilities are still extremely expensive. The current P/E ratios are not at all reflective of a 5.5% Fed Funds rate.
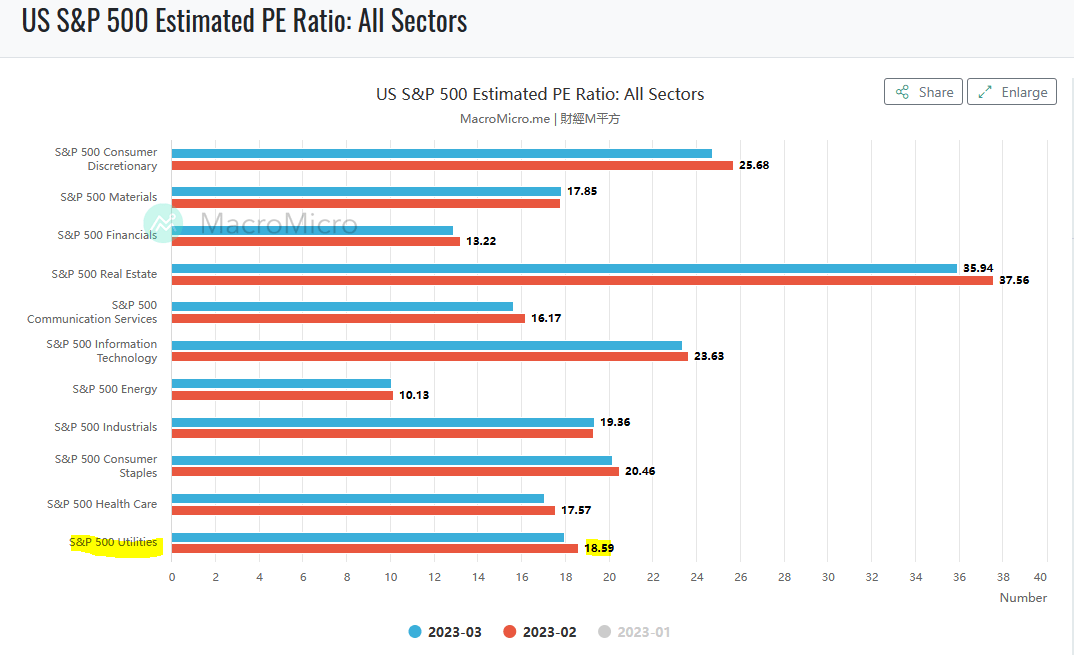
In this climate, utilities should be trading at a sub 14X multiple. While that may sound low, keep in mind that in 2002 and 2009, utilities bottomed at under 9X earnings. So 14X seems extremely generous given the near 90% probability of a recession within 12 months. The P/E ratios are also likely to turn out completely incorrect. That is, earnings will come up short. This will be influenced by the upcoming recession as well as the huge jump in interest costs for these heavily indebted utilities. Some companies have given enough warnings that the analysts have woken up and reduced estimates. Dominion Energy ( D ) is one such example where 2024 earnings estimates (shown) below, will be lower than the 2023 estimates ($3.99).
But such correct repricing is rare. Most are forecasting growth and our forecast is for a modest contraction in 2023 followed by a 10-15% earnings drop in 2024. So obviously, we are bearish on utilities as a whole.
The second driver will come from leverage. Both funds have been lulled into a sense of complacency, thanks to constant monetary pumping by the Federal Reserve. But in a constricted environment with rates rising, that leverage will really come to bite. Investors should note that most utilities are also far more leveraged today than they were a decade back. So we will likely see sharp NAV losses in this cycle.
The final driver is the commitment to pay those massive distributions. The utilities sector generates about 3.5% currently. When you subtract out the expenses of the fund and account for the small boost from leverage, both funds generate about 3% from underlying holdings.
UTG distributes 8% on NAV while DNP distributes about 9% on the current NAV. Neither are really designed to do this in a protracted bear market with this level of differential versus underlying yield.
Verdict
DNP has held up far better than what we expected. Well, the price has held up better than what we expected.
The price has actually outperformed the NAV by a stunning 11% since our October call. So while we expected that sanity would strike the fund at this point, it still has not. That does not change the final result. It actually does not even change our timeline. We still expect a negative total return over the next four years and investors should use this premium to exit. We rate the shares a Strong Sell.
UTG does not suffer from as many flaws that DNP does. Investors have generally lacked the yield chasing manic behavior that they have shown towards DNP. The premium is modest and the fund takes less leverage as well. It has performed well over long periods and served its shareholders quite nicely. We still think that we cannot give it higher than a Hold rating. At this stage of the cycle you want to be looking for larger margins of safety and we believe we will get UTG with a NAV 15-20% lower and an additional 10% discount on top of that. That would be our buy point. For now we stay out.
Please note that this is not financial advice. It may seem like it, sound like it, but surprisingly, it is not. Investors are expected to do their own due diligence and consult with a professional who knows their objectives and constraints.
For further details see:
DNP And UTG: Updating Our Outlook On 2 Utility CEFs