UTG - DNP: Utility Sector Valuations At Extremes
Summary
- DNP is a utility sector focused CEF.
- It has paid a consistent $0.065/month distribution for years.
- With sector valuations at extremes, it may be more difficult for the fund to generate sufficient returns to maintain distributions without resorting to return of capital.
Recently, I reviewed the Utility-focused Reaves Utility Income Fund ( UTG ) with the conclusion that UTG may underperform other utility funds due to its floating rate leverage exposure.
In this article, I will review another Utility sector focused fund, the DNP Select Income Fund ( DNP ) and compare it to the UTG. Finally, I will provide some general thoughts on the utility sector in general.
It is understandable why so many CEF investors swear by DNP, as it has consistently paid out its $0.78/share distribution for over 2 decades. Management has also navigated the current challenging environment well by investing in energy mid-stream companies that have outperformed. However, given utility sector P/E multiples are at all time highs, future returns that can sustain the distribution may be more difficult. Higher interest rates can also hurt the NAV from P/E contraction. I would suggest investors stay on the sidelines for now until utility sector P/E multiples ease to more reasonable levels.
Fund Overview
The DNP Select Income Fund is one of the largest and longest running closed-end-fund ("CEF") in existence with $3.9 billion in market cap. It first offered shares to investors in 1987, and has continuously paid a distribution to unitholders for 35 years. DNP's main objectives are current income and long-term growth of the income.
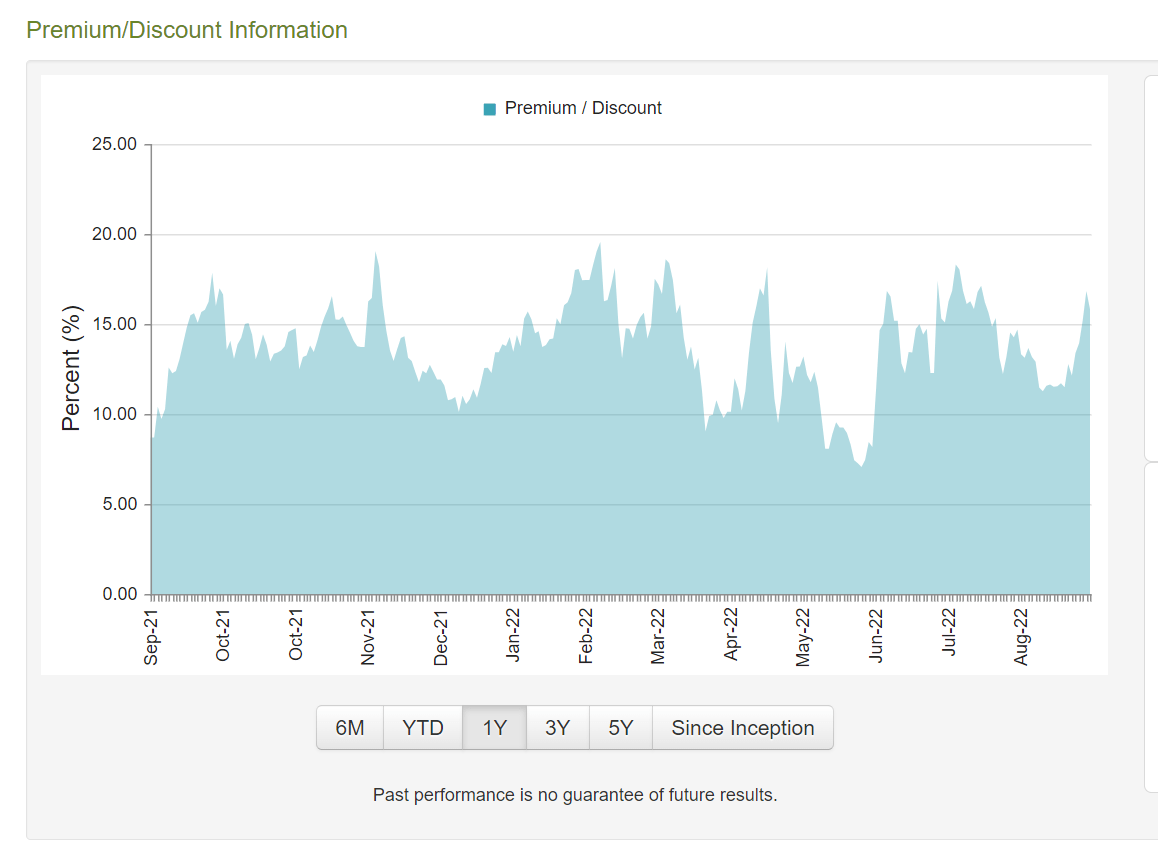
As one of the most popular CEFs in the market, DNP trades at a significant premium to its NAV. Currently, that premium is 16.8% (Figure 1).
Strategy
The strategy of DNP is to invest primarily in a portfolio of equity and fixed income securities of companies in the utility sector, taking advantage of the income and growth characteristics of utilities over the long run. Under normal circumstances, at least 65% of the fund's assets will be invested in utility companies engaged in the production, transmission, or distribution of electric energy, gas, or telephone services.
There is a limit that not more than 25% of assets may be invested in non-utility companies, and not more than 20% of assets may be invested in foreign issuers.
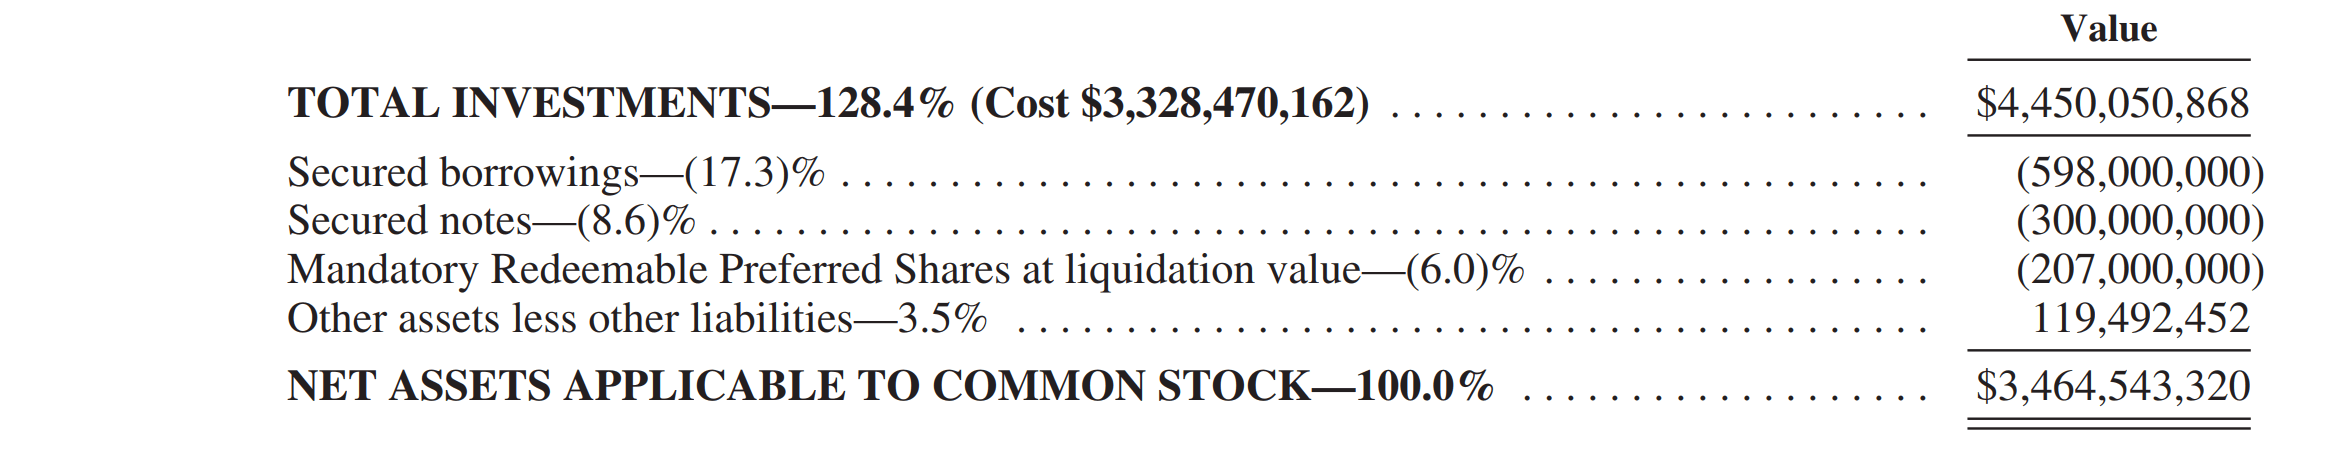
DNP also employs leverage to enhance returns. As of the April 2022 semi-annual report, the fund had $1.1 billion in leverage (debt and preferred shares) on $4.45 billion in total assets for ~25% leverage (Figure 1). DNP's leverage is part floating rate and part fixed rate.
Portfolio Holdings
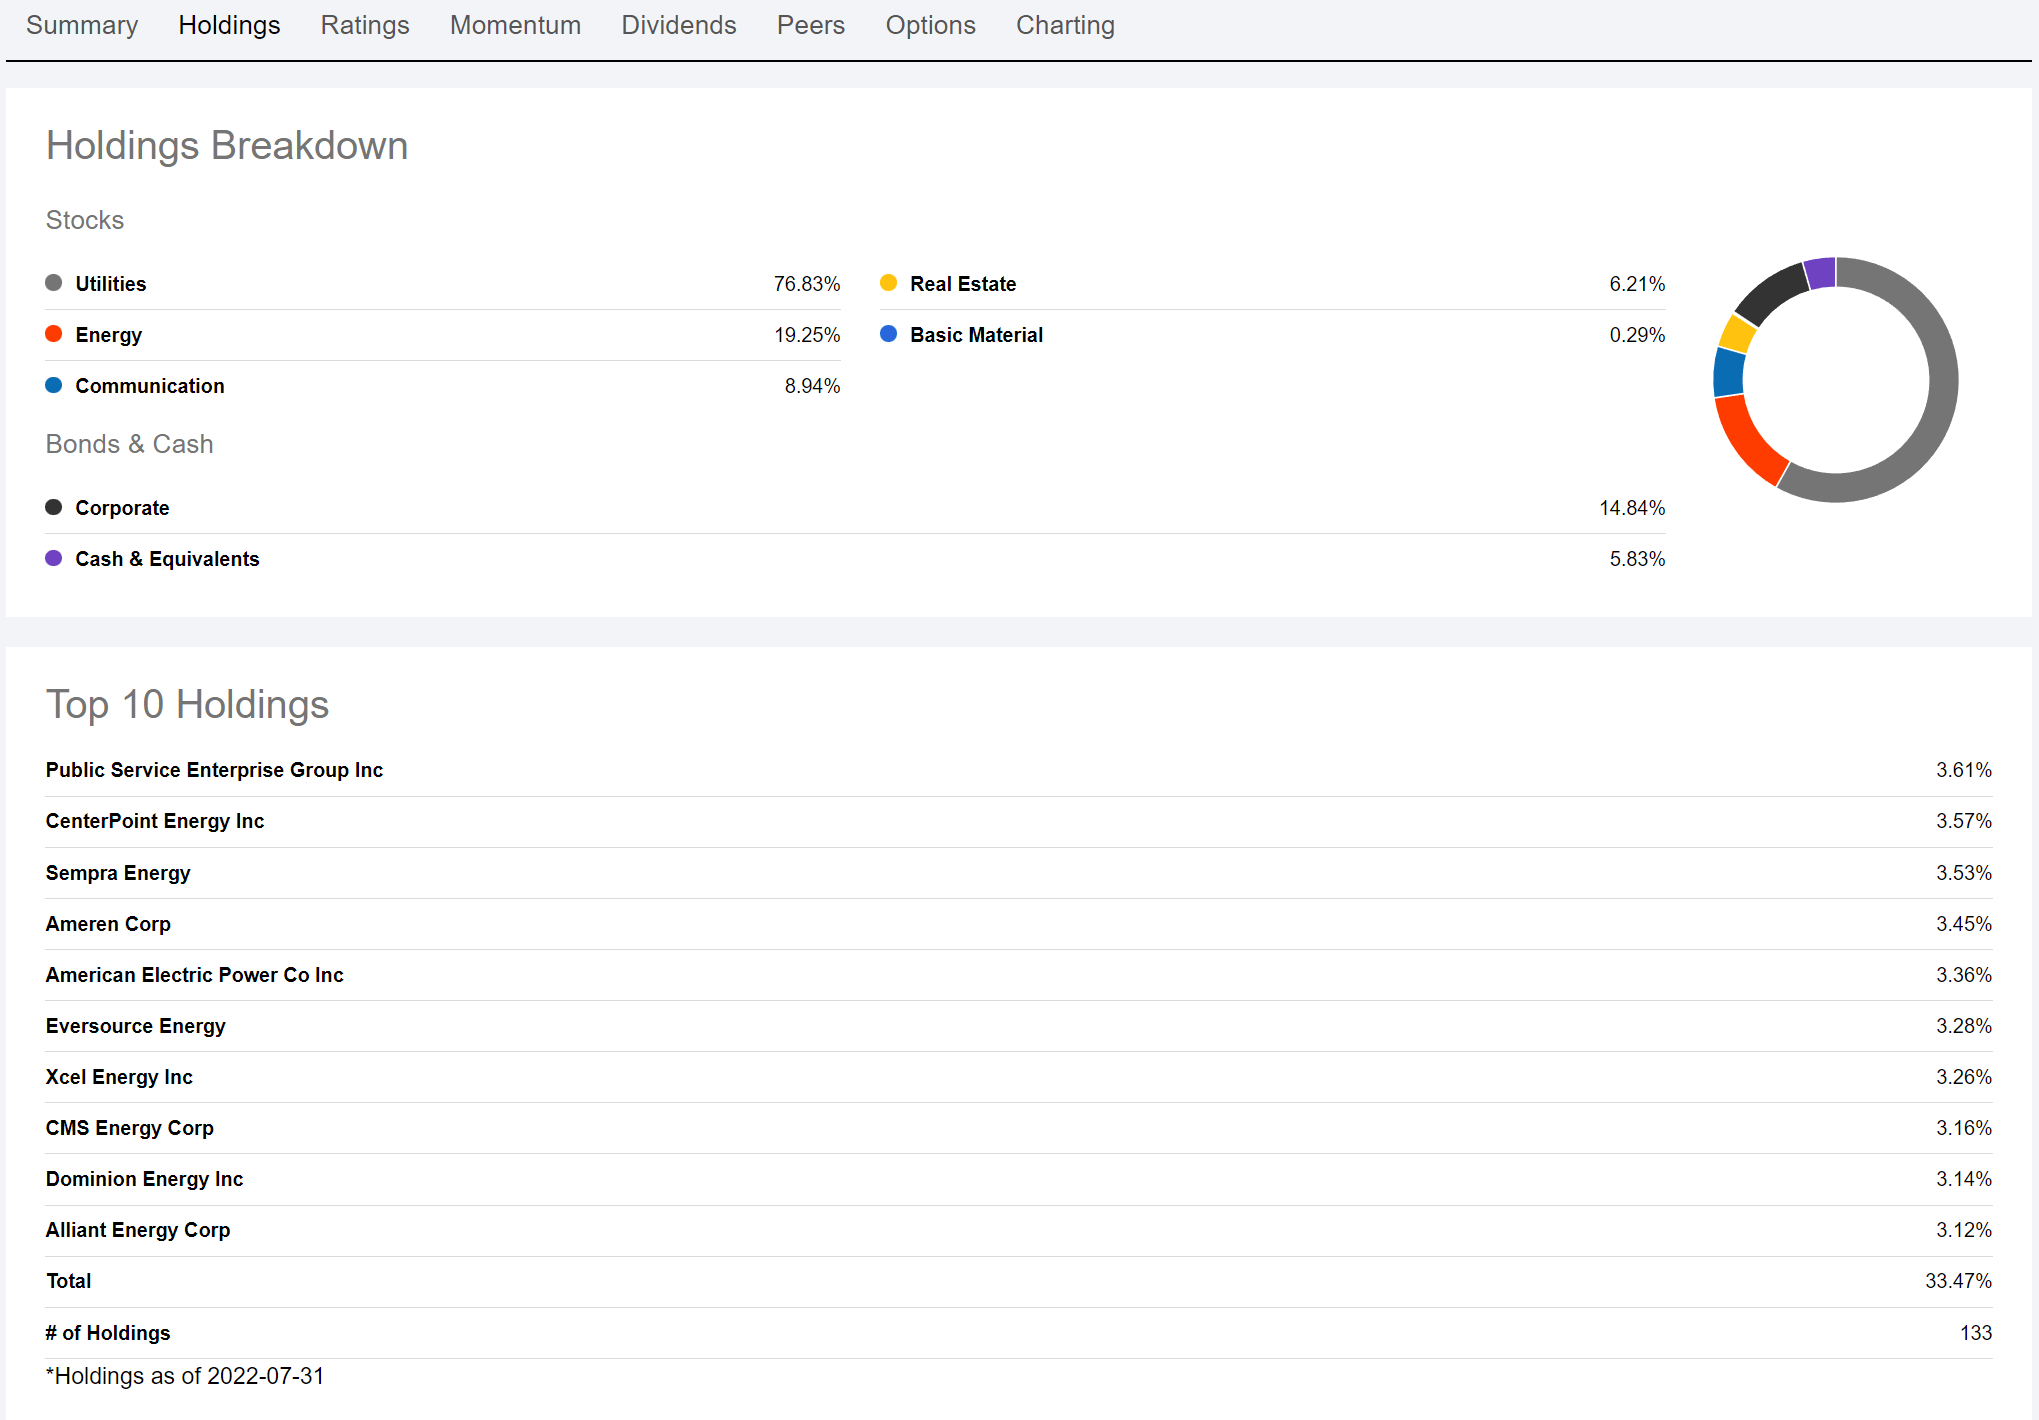
The portfolio holdings as presented on the fund's webpage is a bit dated, corresponding to the April semi-annual report. Seeking Alpha appears to have more up to date portfolio holdings details, from July 31st (Figure 3). In any case, we can see that DNP primarily invests in utilities and telecoms, with 77% and 9% weighting respectively.
The fund also has a 19% weighting in energy, which if we go through the semi-annual report, are primarily from energy mid-stream companies like Cheniere Energy ( LNG ) and Enbridge ( ENB ).
Returns
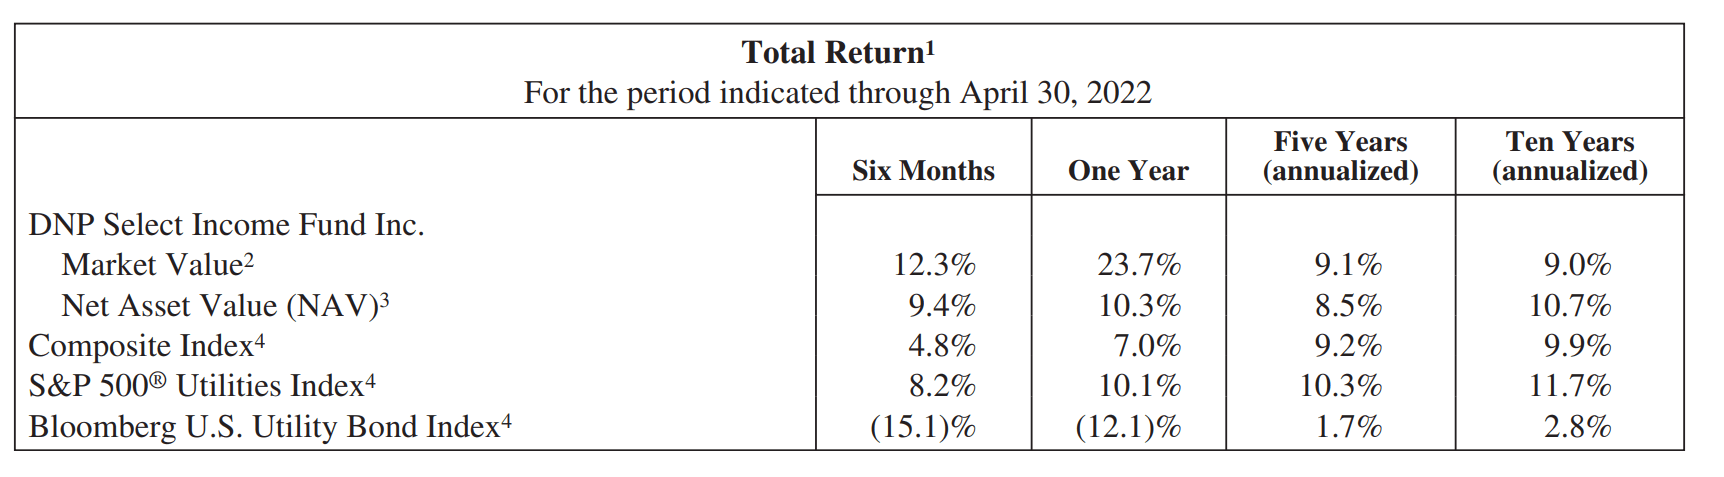
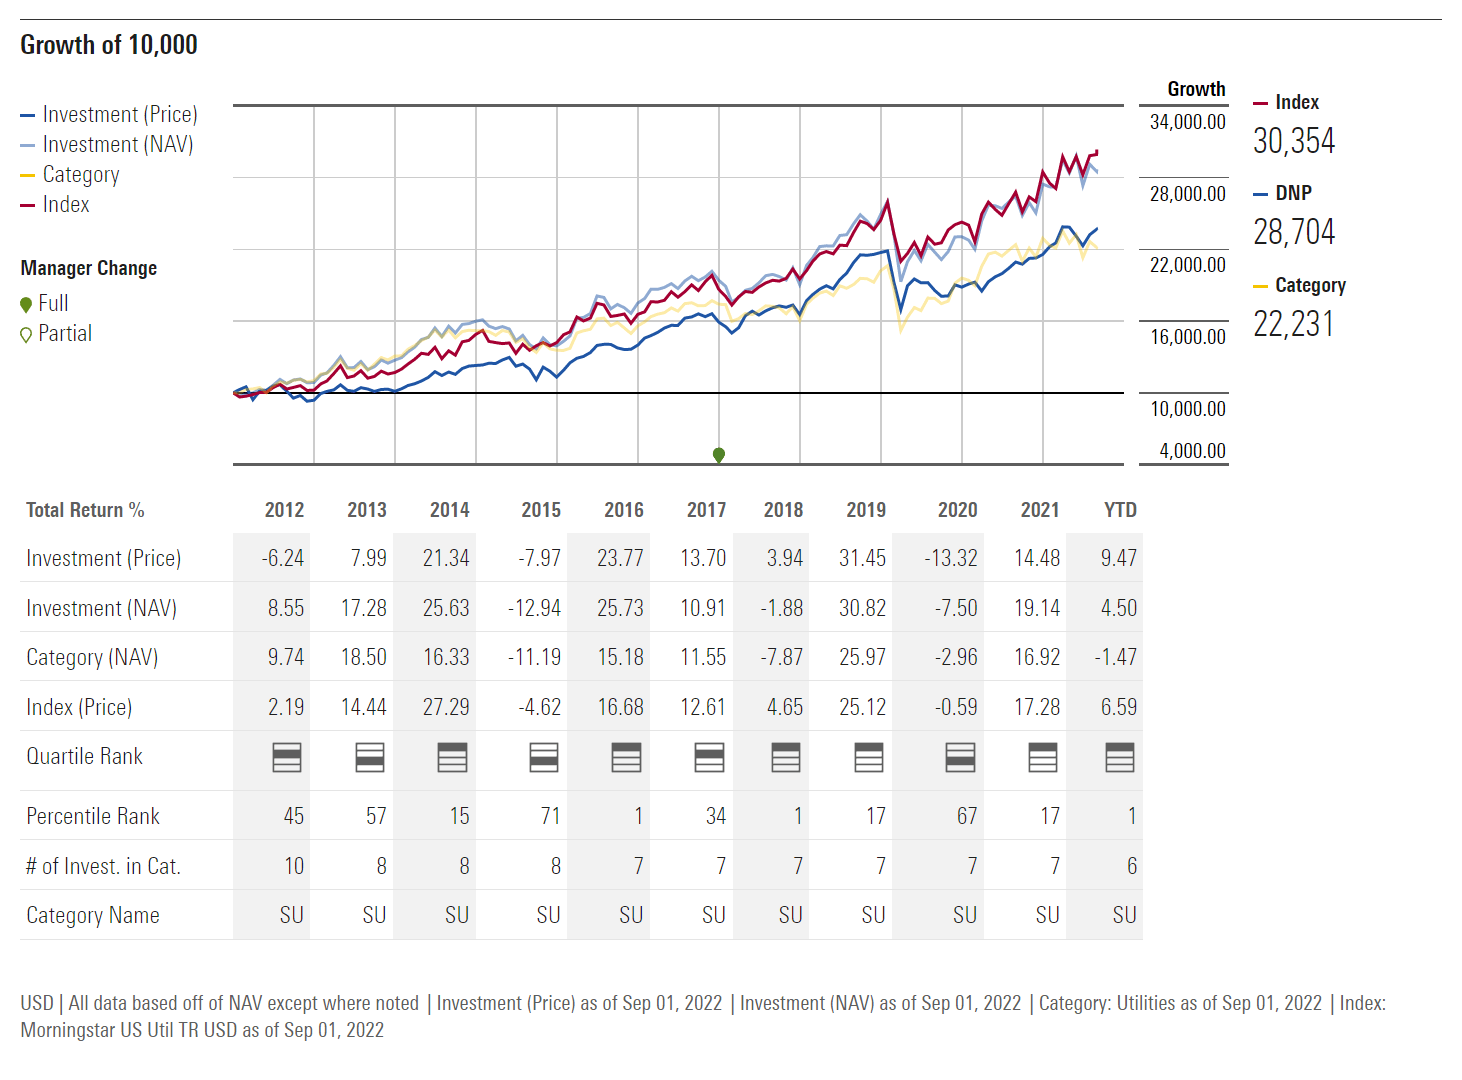
The goal of an income fund like DNP is to make steady returns that can fund its distribution, and hopefully grow the distribution over time. In terms of steady returns, DNP has certainly achieved it in the past, with a 10 year annualized NAV return of 10.7% (Figure 4).
Relative to peers, DNP also compares well, being in the top two quartile 7 out of the last 10 years (Figure 5). The YTD return of 4.5% is also a positive surprise. Given the rise in interest rates, one would have expected a floating rate leveraged fund like DNP to lag.
I believe the explanation for the strong YTD performance is from DNP's ~20% portfolio weight in energy mid-stream companies that have outperformed. For reference, the Global X MLP ETF ( MLPA ) has returned 19% YTD.
Kudos to the fund managers for finding ways to outperform in a challenging year!
Distribution & Yield
As mentioned above, DNP has had 35 years of continuous distributions, with the current distribution set at $0.065/month, unchanged since 1997. This works out to 6.9% current yield based on the market price of DNP shares. On NAV, the distribution yield is 8%. DNP also pays a periodic special distribution at the end of the year, although the last special distribution paid was in 2005.
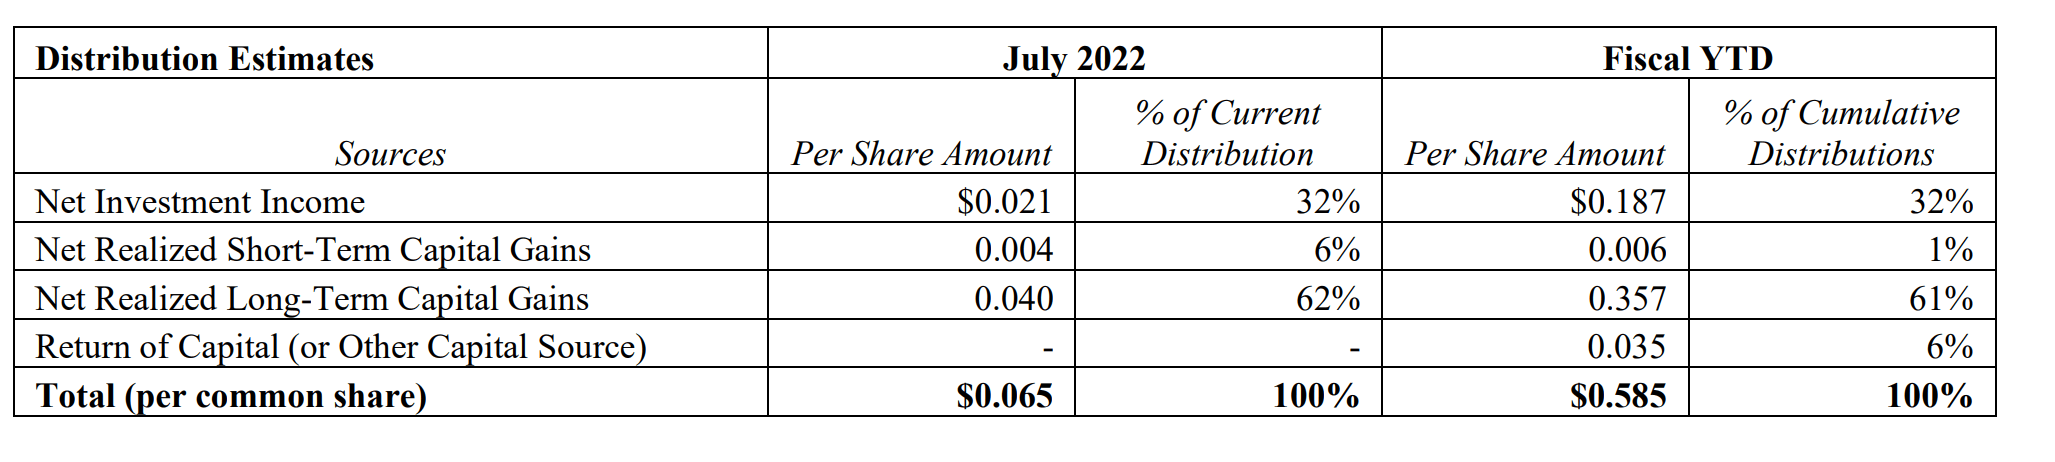
In recent years, DNP's distribution breakdown has trended towards realized gains and return of capital ("ROC"). Fiscal YTD, 32% of the distribution has come from net investment income ("NII"), 62% from realized gains, and 6% from ROC (Figure 6). In Fiscal 2021, the breakdown was 32%, 55%, and 13% respectively.
Figure 6 - DNP Fiscal YTD distribution breakdown (dpimc.com)
This shift in the distribution breakdown is to be expected, as interest rates have been held low for many years, so high yielding assets like utilities have been bid up in price as a result. NII% will naturally be lower and the fund will be harvesting high priced securities to fund its distribution.
Fees
Management fees for DNP is above average, but reasonable. The fund advisor, Duff & Phelps Investment Management Co. earns a quarterly fee at an annual rate of 0.60% of the 'Average Weekly Managed Assets' (total assets less accrued liabilities) up to $1.5 billion and 0.50% above. Total expenses, excluding interest expense, as a % of average net assets available to common stock, was 0.98% for the first half of Fiscal 2022 and 1.00% in Fiscal 2021. Including interest, the figures were 1.70% and 1.77% respectively.
For context, the Utilities Select Sector SPDR ETF ( XLU ) has an expense ratio of 0.10%.
Risks
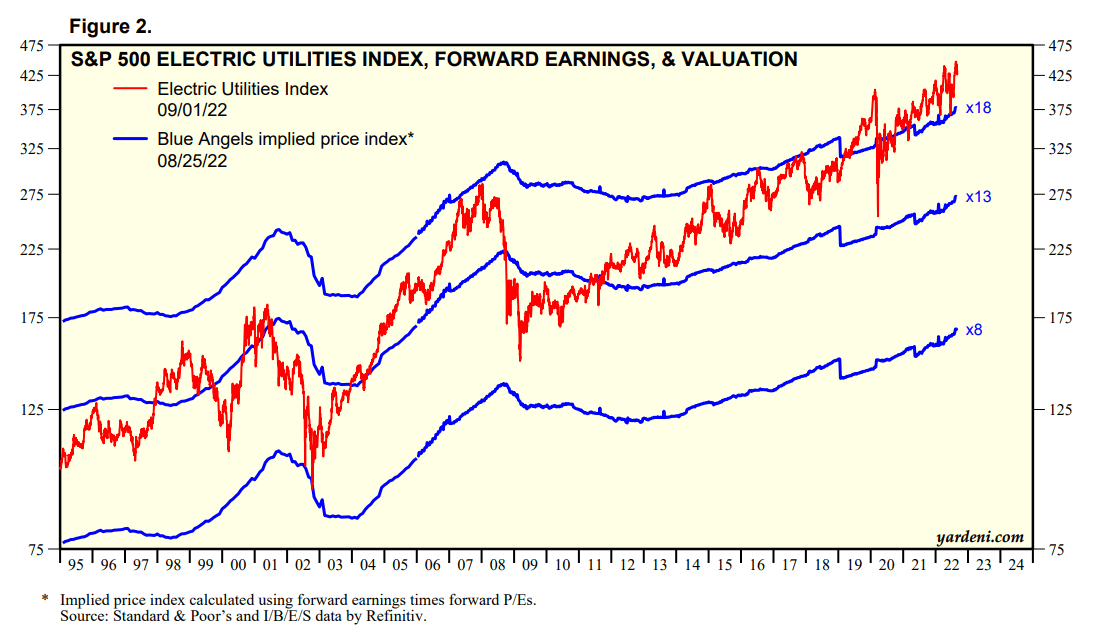
As mentioned above, in an environment of low interest rates, long duration assets like utilities have been bid up, leading to lower investment incomes and higher prices. The main concern I have is that the prices of these long duration assets have been bid up to extreme levels in recent years. From Figure 7, we can see that Utilities sector P/E multiples are currently at all time highs, so future returns for the sector, and the DNP fund by association, will most likely have to rely on earnings growth.
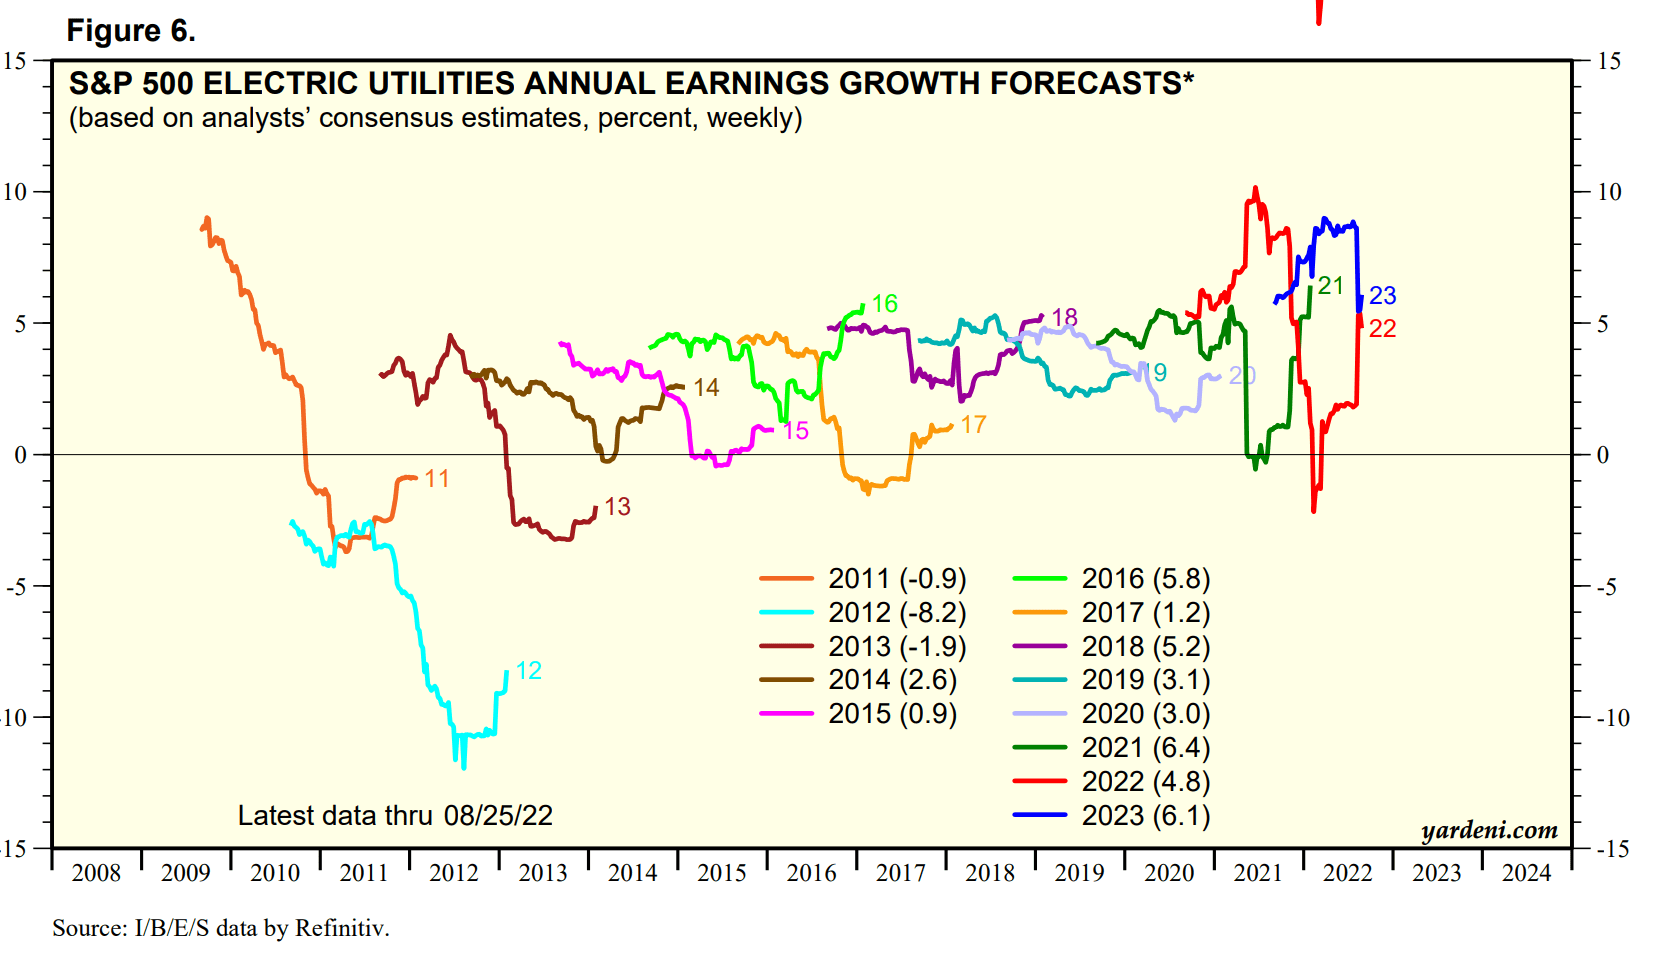
However, looking at the earnings growth for the Utility sector, we note that with the exception of 2021, earnings growth has been below 6% (Figure 8). Consensus earnings growth for 2022 and 2023 are also only 5-6%. Going forward, it may be more difficult for DNP to generate sufficient returns (either through NII or price appreciation) to cover the 8% of NAV distribution, if P/E multiples cannot expand further from already extreme levels. We may see increasing use of ROC and gradual NAV decline as a result.
Furthermore, there is additional risk that as the Fed raises interest rates, P/E multiples could materially contract, which will hurt the NAV. On the positive side, higher interest rates and lower P/E multiples should help NII when funds are reinvested.
DNP Vs. UTG
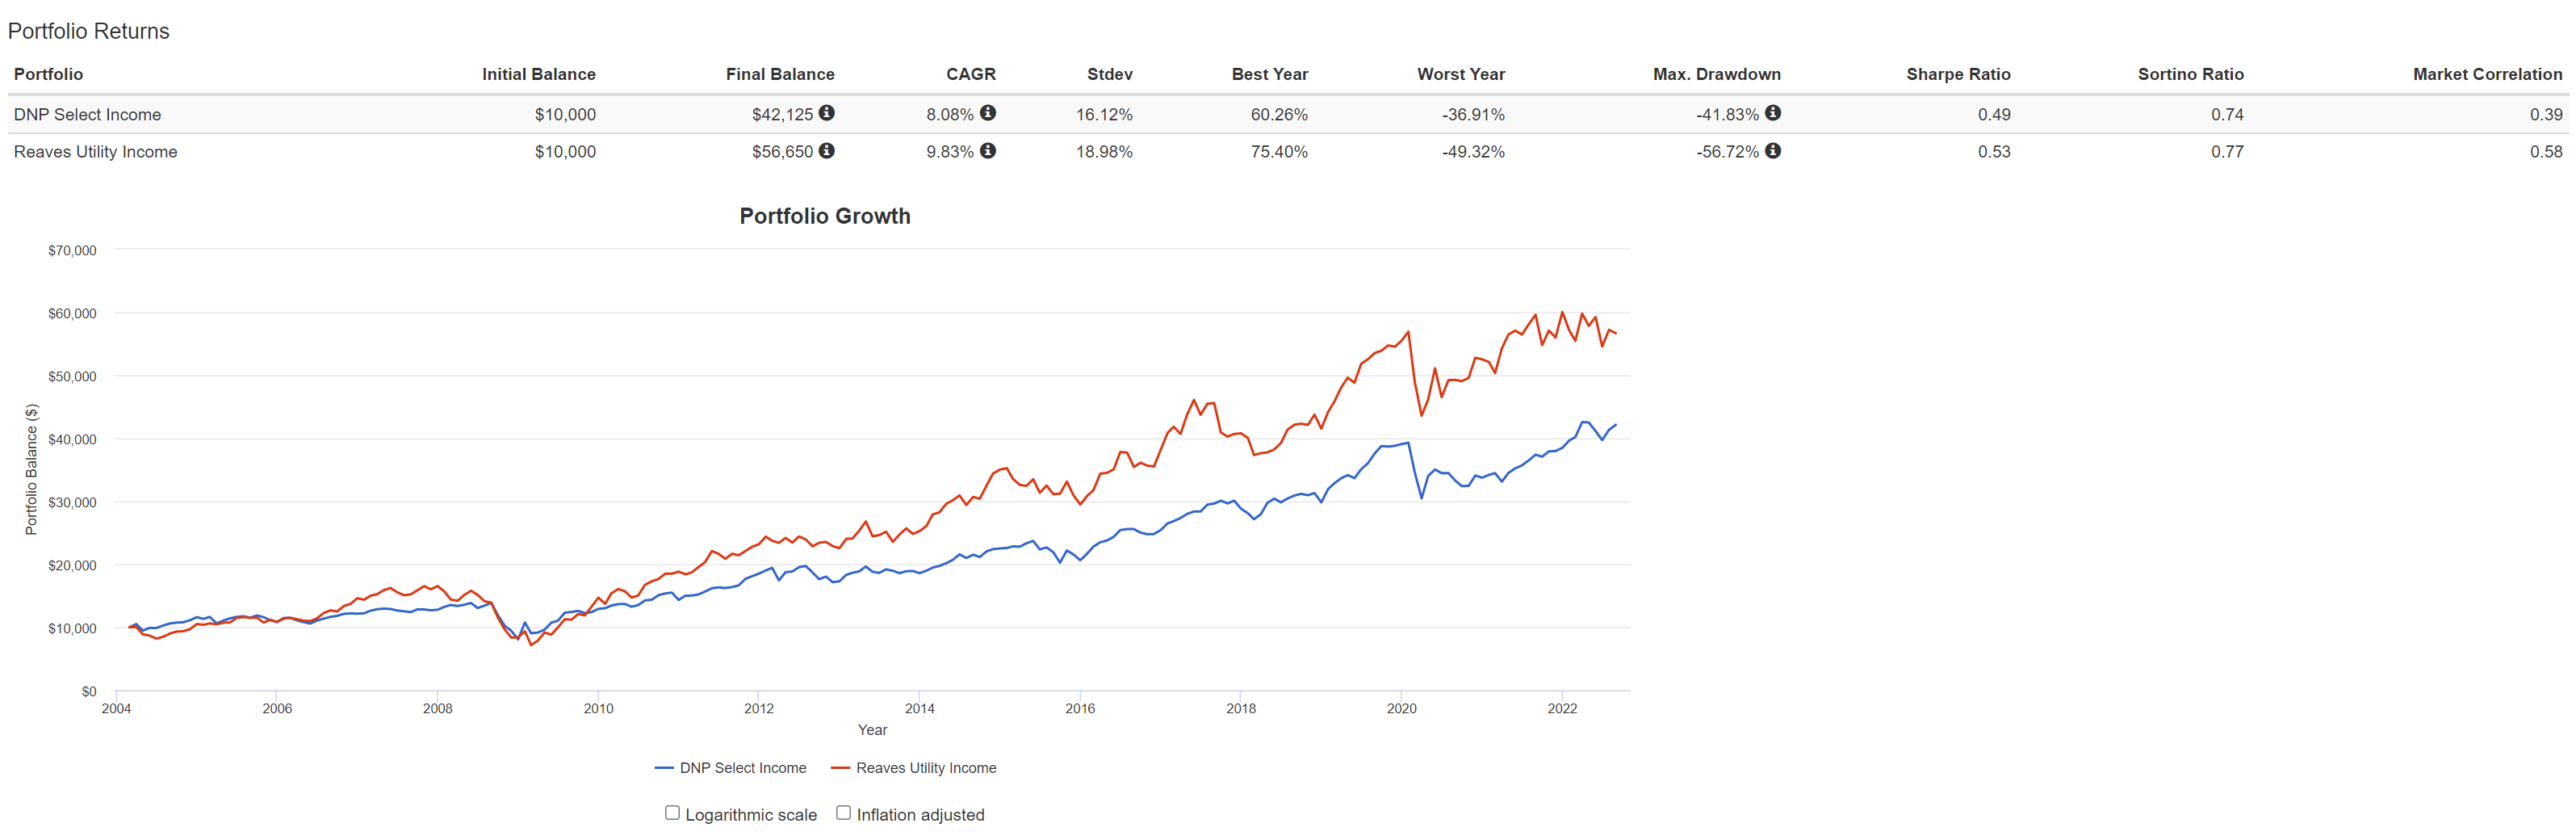
Looking at DNP versus the Reaves Utility Income Fund that is also popular with CEF investors, we see that since inception, UTG has generated higher annual returns than DNP, at 9.8% vs. 8.1% (Figure 9). However, UTG does have more risk, as it has higher volatility (19.0% Stdev vs. DNP at 16.1%), and max drawdown of 56.7% vs. 41.8%. UTG also has a higher correlation to the market. This difference can probably be explained by DNP's moderate fixed income holdings of 15% of assets.
Figure 9 - DNP vs. UTG (Author created with Portfolio Visualizer)
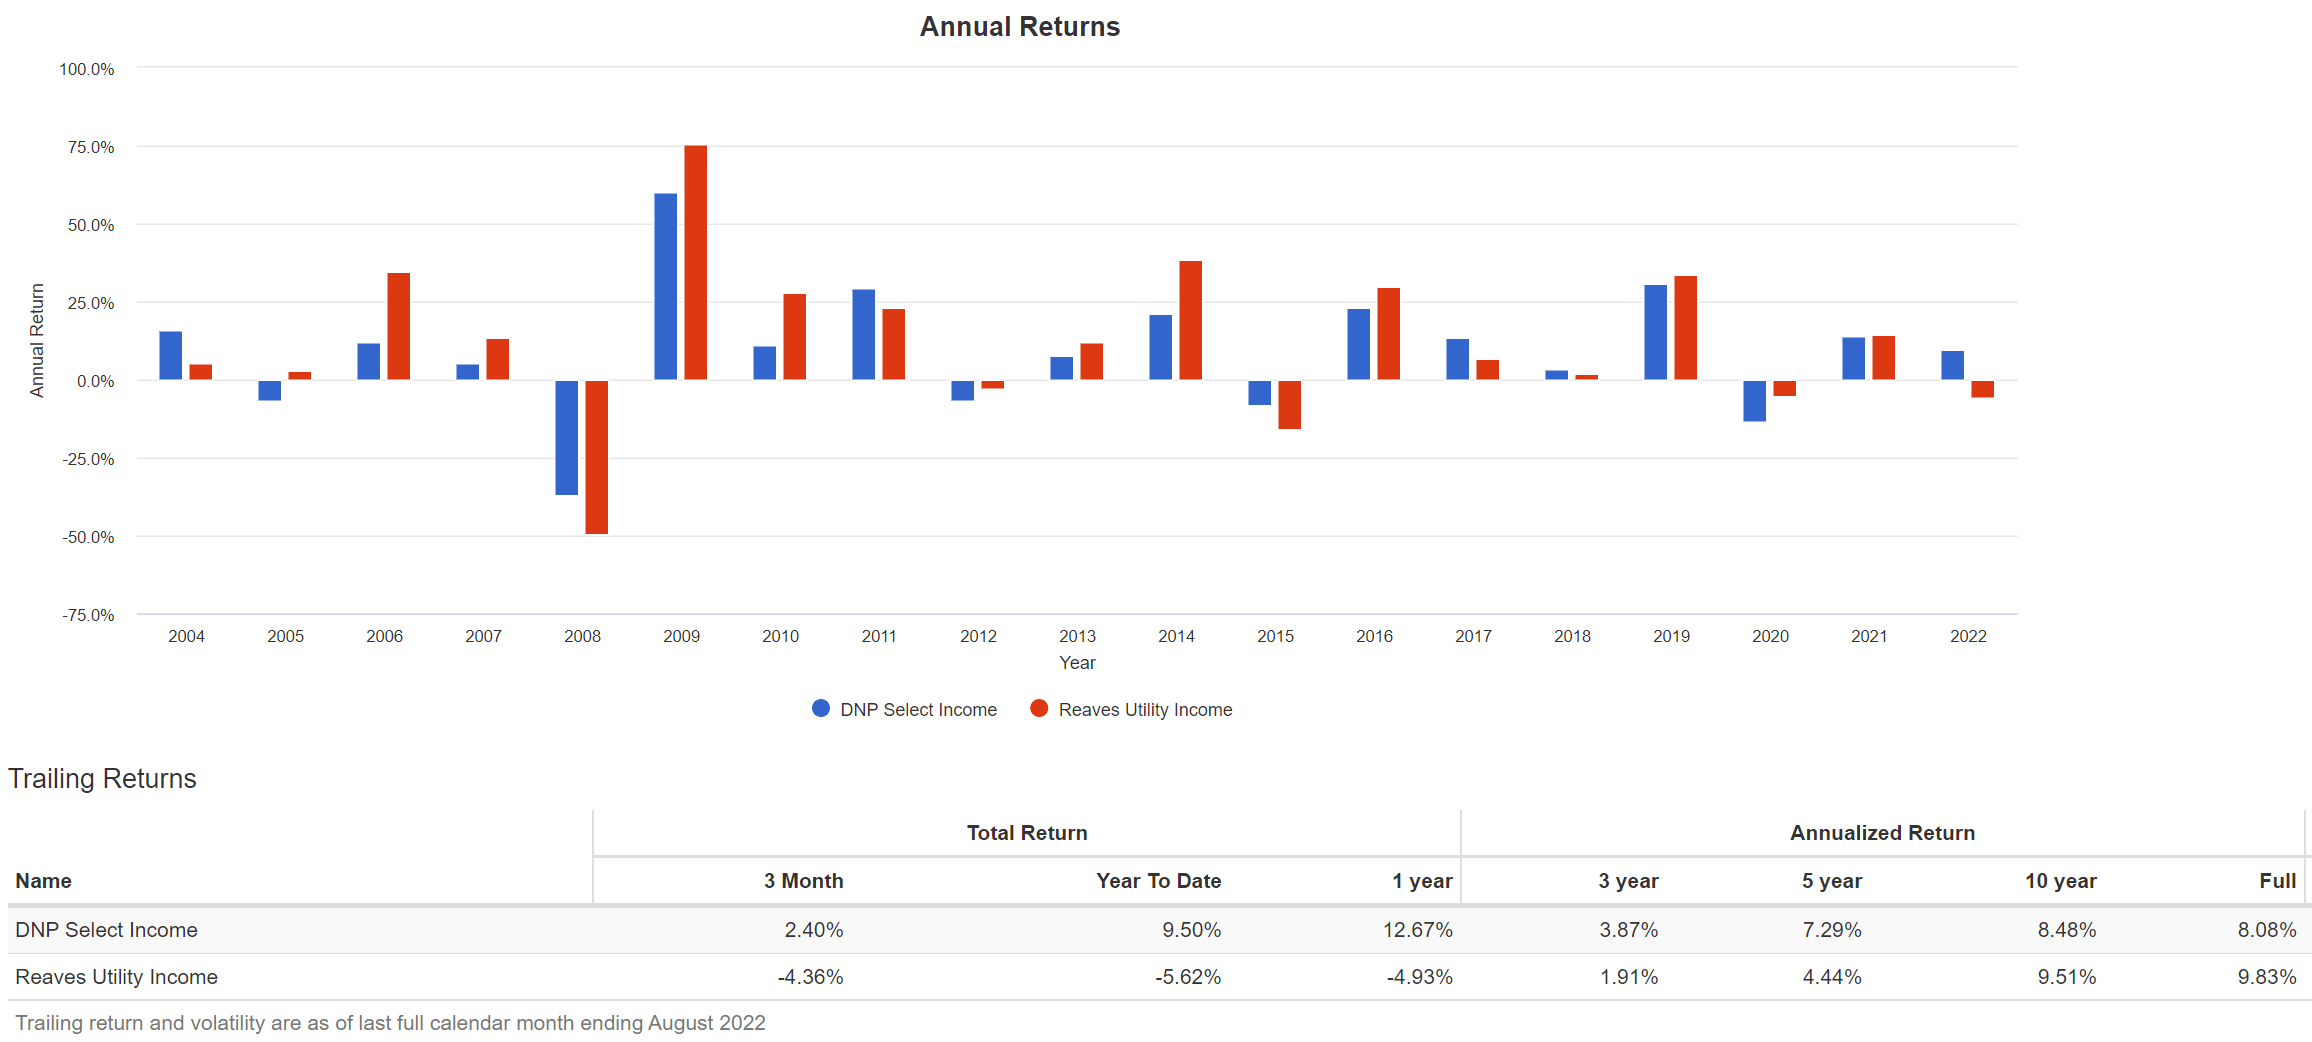
Another important point to highlight is that YTD, DNP has generated 9.5% returns, while UTG is down 5.6% (Figure 10). The key difference between the two funds is that DNP has a sizeable allocation to energy mid-stream companies which have outperformed this year, while UTG have bet on media and REITs, which have underperformed utilities.
Figure 10 - DNP vs. UTG annual returns (Author created with Portfolio Visualizer)
Finally, it should be noted that DNP's base distribution has been stagnant at $0.78 per annum since 1997, whereas UTG has grown its base distribution at a 3.5% CAGR in the past 5 years, from $1.92 annualized in 2017 to $2.28 annualized currently. Both funds currently yield approximately 7%.
Between UTG and DNP, my long-term preference is for UTG, as it has a higher historical compounded return and has been growing its distribution. The caveat is that in the short run, UTG is not properly positioned for the current market volatility with its floating rate leverage and long bets on media and REITs.
Conclusion
In summary, it is understandable why many CEF investors swear by DNP, as it has consistently paid out a moderately high distribution of $0.78 per year for a current yield of 7%. Management has navigated the current challenging environment well by investing in energy mid-stream companies that have benefited from energy-driven inflation. However, there are risks to DNP's NAV from return of capital as it may be increasingly difficult for DNP to earn sufficient returns to sustain its distribution when P/E multiples are already at extremes. Higher interest rates can also hurt the NAV from P/E contraction. Similar to my recommendation on UTG, I would suggest investors stay on the sidelines for now until utility sector P/E multiples ease to more reasonable levels that will make NII yields more attractive and realized gains easier to achieve.
For further details see:
DNP: Utility Sector Valuations At Extremes