VOO - Does Elliott Wave Work In The Current Market?
2023-05-23 10:54:39 ET
Summary
- From my experience, the up and down patterns formed by the price movements of the market, called Elliott Waves, are unpredictable in themselves.
- In practice there are simply too many possible extensions, corrections and "alternate counts" to be predictive. To be workable, the theory requires additional data.
- The predictability of the patterns can be improved substantially by integrating measurements of market sentiment into the theory.
- When you do this, it allows rather clear and more probable forecasts.
Last February we made a market forecast based on merging the Elliott Wave theory with the theory of contrary opinion. It forecast an advancing move back to the all-time highs of 4,800 on the S&P 500. We still hold to the forecast.
However, many investors are rightfully skeptical of any forecast based on the Elliott Wave theory, so we want to explain how this works. I feel I'm qualified for this since I’ve been using this theory for over 40 years and also wrote about merging these two theories twenty years ago in my second book.
This current article was stimulated by a very good question I received from a reader yesterday.
A good question from a reader
I just published an article two days ago about the granddaddy of all sentiment indicators pointing to higher prices. It generated this very good question (comment) from Bulldog67 who asked,
How do you reconcile this with the fact that market breadth (advances less declines) is very, very poor? The S&P 500 and NASDAQ are weighed indexes, and have been going up because of fewer and fewer stocks! History shows a bullish investor should be worried when that occurs!
I gave this answer:
The two-year, 1970-72 recovery from the 1969-70 bear market moved up in two advancing waves, each lasting about nine months. Both waves had dismal breadth. These narrow, weak bull markets were a prelude to the 1973-74 bear. I think the current situation is similar and supports the price forecast outlined (in the February article).
The “granddaddy” article said, “higher prices”, but it didn't say “how high.” This earlier article did as it forecast of a rally back to the all-time of 4,800 on the S&P 500 forming large ABC correction called a flat. This forecast also aligns with the weak breadth in the current market.
The quote below is from that February price forecast, which was based on merging Elliot Wave Theory with Contrary Opinion.
The Forecast
In the February article we made this market forecast:
We are also troubled by the fact that interest rates are not coming down, which normally occurs coincidental with the start of a new bull market. If this is the start of a new bull market, it seems to be ahead of itself. Which begs this question. Is there a market scenario that allows the October lows to be the price lows of the bear market, but not have the bear market complete? Yes, there is. It would be possible if one accepted the idea that the market is forming a large Elliott Wave bear market "flat."
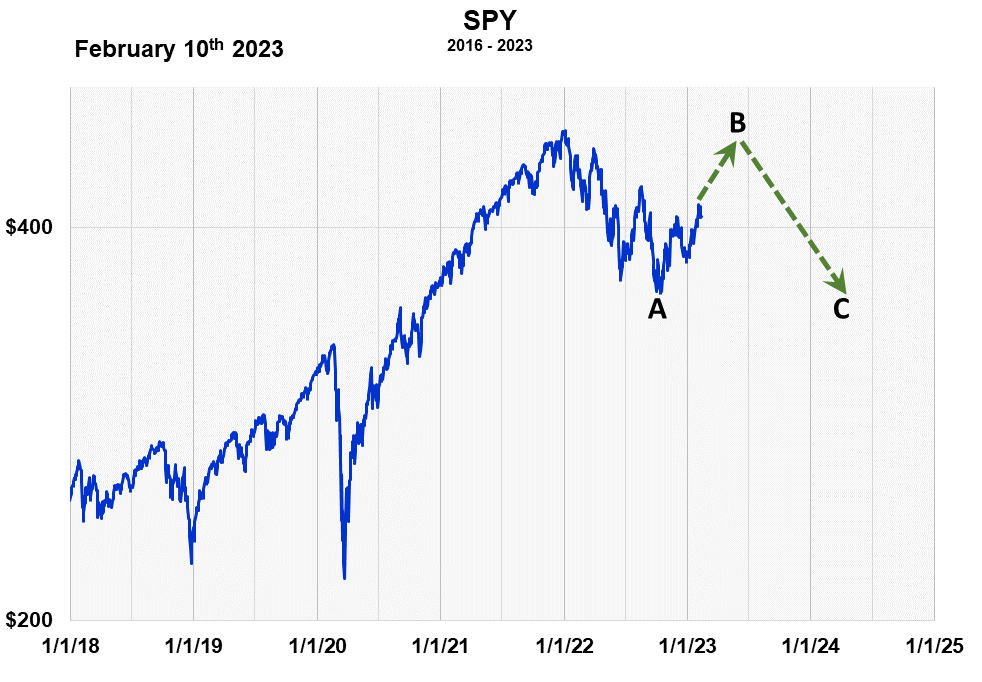
In Elliott Wave terminology, an ABC corrective pattern called a flat has both a large, double top and double bottom like the pattern shown below. They are common. To us, this is the price pattern that would fit with the high level of bearish sentiment that occurred last summer. The current rally isn't the start of a new bull market, but a large intermediate term movement back to the previous peak.
An Example of the Market Forming an Elliott Wave Bear Market Flat (Sentiment King)
The Elliott Wave Theory is Incomplete
The Elliott Wave theory is fractal theory that is both insufficient and incomplete. Simply put, it is impossible to consistently predict the up and down fractal patterns of the market just like it’s impossible to predict the fractal patterns in the famous Mandelbrot set shown in this article’s picture. People's skepticism with the theory is well placed. I mentioned this incompleteness in an earlier article:
The Elliott Wave theory is a fractal theory, which is a well-defined subject in mathematics. While some fractal patterns are completely predictable, many are completely random, while others, like the patterns formed from the ups and downs of the stock market, lie somewhere in between.
From my experience, the up and down patterns formed by the price movements of the market, called Elliott Waves, are more unpredictable than predictable. In practice there are simply too many "alternate counts."
The predictability of the patterns, however, can be improved substantially by integrating market sentiment into the theory. After doing this I believe the chart shown is the most probable EW pattern to expect.
The October low was the end of wave A and start of Wave B
The predictability of the patterns, however, can be improved substantially by integrating market sentiment into the theory. It can be used to find the tops and bottoms of the waves, thereby eliminated many of the possible alternate wave patterns.
The high level of bearish sentiment last October signaled the end of wave A in the beginning of wave B. The question is, “Is wave B the beginning of a whole new bull market or an advancing wave which is part of a longer-term market correction, or a bear market?" We think it's the latter.
It is here where contrary opinion helps a forecaster choose, from the multitude of Elliott wave corrective price patterns, the one that is most probable. The Elliott theory alone can’t do this.
As we stated, we still think a corrective pattern called an ABC flat fits the current situation: record levels of bearish sentiment last October and weak market breadth during the subsequent seven-month rally.
If this scenario is correct, this seven-month rally should continue up to 4,800 on the S&P 500. Then a second wave down will begin, which is shown as wave C. If correct, this second wave down should end about the same price level as wave A.
For further details see:
Does Elliott Wave Work In The Current Market?