DLTR - Dollar General: A Strong Earnings Compounder Facing Growth Ceiling
2023-09-29 15:53:09 ET
Summary
- Dollar General has been a strong earnings compounder, even outperforming Visa and Google, with a 10x increase in EPS at a 20% CAGR since 2010.
- The company's volatile performance includes a 150% price rise followed by a decline, raising questions about its future prospects.
- Its business model offers a unique value proposition to low-income shoppers in rural/troubled areas, but faces limitations in store growth potential and renewed competition from Family Dollar.
An "Obvious" One-Line Thesis
"a 20% CAGR Earnings Compounder priced at 11x LTM P/E"? Many might question the accuracy of the statement. Well, that is a factually true statement but doesn't necessarily mean much.
Is it "a great business at a fair price" as Charlie Munger puts it is the focus of this analysis.
An Earning Compounder with Recent Volatile Performance
Other than close followers in the industry, few would think Dollar General has been an earnings compounder, let alone a stronger earning compounder than Visa, Google, and Walmart since 2010. Its earnings per share increased from $1.05 in FY2009 to $10.73 in FY2022, 10x at ~20% CAGR for a decade, beating commonly perceived compounder heroes like Visa and Google as my tweet below shows:
20% compounder (author from Twitter)
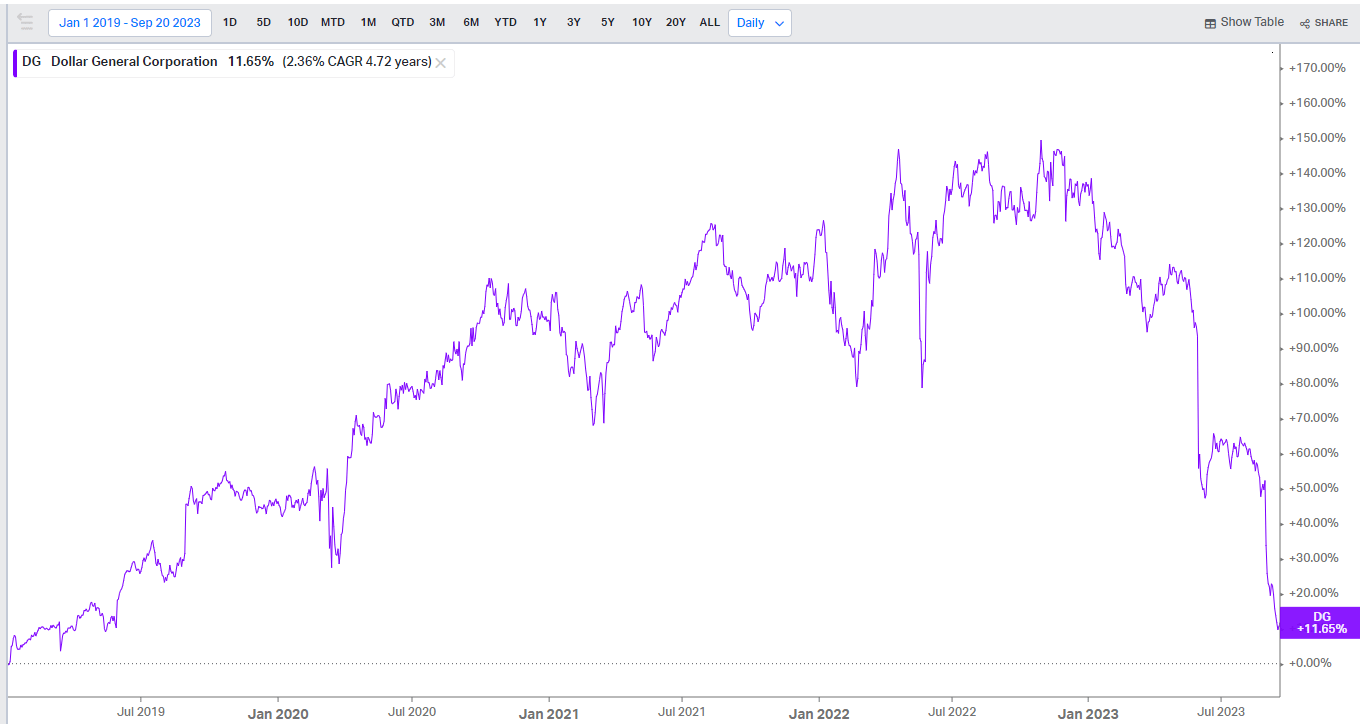
Adding a twist to this amazing compounding story is its explosive 150% price rise in less than 3 years (from 2019 to mid-2022), and it has given all it up since.
DG price chart 2019-2022 (Koyfin)
Before we unpack its secret formula for compounding earnings for a decade, and discuss what the hell happened since 2019, let us take a look at the Dollar General story, where it originated from, how it evolved, and became the discount retail giant today.
Dollar General Story
To better understand Dollar General's compounding miracle, and its rise and fall over the last 4 years, let us go over its 80+ years of history which I divided into 3 phases.
Phase I (1939-2003)
A family business started by Cal Turner Sr., and later run by his son for 60+ years. It grew from a humble start in 1939 to $6B revenue, operating over 6000 stores in 2003.
Phase II (2003-2007)
The Turner family passed the baton to its first outsider CEO David Purdue, and 4 years later, sold to KKR through a private buyout
Phase III (2008 - now)
KKR hired Rick Dreiling as CEO and rearchitected its business model. The company has been executing the 'Dreiling' Playbook since. CEOs: Dreiling (08-15), Vasos(15-22), and Owen(22-now)
"Sell everyday basic items at extraordinary prices for our customers", throughout 80 years of operating history, DG's founding principle has been consistently presented.
A fun fact about Cal Turner Sr. He has a knack for seeking deals in an unconventional manner. He once said: "If the price is right, I can sell pink pants to guys", and he had the picture to prove it.
Dollar General (Dollar General 75 Years website)
Father and Son Cal Turners (Sr. & Jr.), each ran the company for 30+ years and grew Dollar General empire from its humble start to over 6000 stores nationwide. In 2003, David Purdue, an outsider took over the CEO position.
Unfortunately under Mr. Purdue's leadership from 2003 to 2007, the operating margin collapsed from 7-8% to less than 3%. KKR observed its weakness, paid a 30% premium, and took the company private.
KKR appointed Rick Dreiling as the CEO. Dreiling carried out a slew of new initiatives and significantly improved DG's business from revenue to profit while maintaining the founding principles.
The results showed. From 2007 to 2010 (Dreiling was hired in Jan 08), its revenue grew 37%, gross margin improved 400bps, SG&A expense reduced by 290bps, and as a result, its operating margin improved 700bps from 2.7% to 9.8%. Extreme makeover isn't an overstatement in this case.
author compiled (sec 10q/10k filings)
In a late section, we will dive into Dreiling's playbook, and how it improved its business.
DG was relisted in NYSE in Nov 2009. Dreiling remained as CEO for 7 years and transitioned the position to then COO Todd Vasos in 2015, who, after being CEO for 7 years, retired and transitioned the position to then COO Jeff Owen in 2022.
While there has been significant business growth and many business initiatives throughout the years, at the highest level, the company has been executing the same Dreiling playbook since 2008.
Business Model
"If Walmart and 7-Eleven had a baby, that would be Dollar General", David Perdue, the first outside CEO who also sold the company to KKR, and later became a US senator, said it artfully and precisely.
It summarizes some key differentiators of Dollar General's business model. Dollar General offers convenience and affordable price tag to low-income shoppers who usually resides in rural areas or troubled neighborhood in metropolitan areas, and often struggle from paycheck to paycheck.
"We go where Walmart doesn't" is another PoV to describe Dollar General's business model. It sells daily essentials, mostly consumable products at a low price tag (not necessarily the cheapest), in a small store format that can run economically even where it is located in sparsely populated areas. A few numbers highlight this:
-
80% of its store service areas under 20k population
-
Small format store at 7.5-8.5k* sqft with 10k SKU. (roughly 5% of Walmart's size, and carries ~7% of Walmart's SKU)
-
Average customer income is $40k/year, with 58% earning under $50k a year.
-
Its prices are ~40% below drug stores, 10-20% below grocery stores, MSD% below Family Dollar, and 2-4% higher than Walmart.
(*) Dollar General has been exploring a larger store format (~10.5k sqft)
DG's primary shoppers are lower-income households also explains its rise since COVID, when Dollar General was kept open as essential stores, and when government stimulus checks disproportionally helped lower-income households. Thus it shall not surprise with its struggle (esp. YoY comp) when Covid rested, and the stimulus stopped.
Its Limitations
Dollar General has been executing the same (Dreiling) playbook since 2008. It continued to optimize its operating engine for both revenue and profit and became the dominating player in this space. It also helped, to some degree, that its closest competitor - Family Dollar, a banner under the Dollar Tree umbrella, has had an uninspiring decade, and little success with its turnaround efforts since its merger with Dollar Tree in 2015.
We will revisit that in a late section.
When Dreiling architected its current playbook, it carved out an under-tapped large operating space (low-income households in rural areas) with a long growth runway. In 2014, then-CEO Dreiling mentioned 25k stores as the total store count target. Dollar General is currently near the 20k mark, leaving ~25% growth potential to its long-term operating target set in Y14.
Over the last decade, Walmart (and to a lesser degree Target) has solidified its lead in the median household income market. It is fair to say in areas where Walmart operates, Dollar General stores will have a difficult time competing, if within a short distance. That also sets a ceiling limit on Dollar General's store growth potential.
As 80% of Dollar General stores are in areas with a population <20k, according to the US census data (below) there are fewer than 19k cities/towns that fall into that category. Now US Census data didn't specify whether an area is rural/suburb/urban, thus leaving quite room for data interpretation.
We can slice and dice the Census cake (e.g. by rural area total population, etc., and I have done that as an exercise), but the succinct point is there are only that many cities/towns left that fit the criteria. In other words, I find its store growth limitation is real and quite eminent unless Dollar General changes the playbook.
Data (US Census 2020)
Store Unit Economics
Before I talk about any models and/or projections, let us talk about some basics - its 4-walled store unit economics.
Its store average sales is slightly under $2Mn. An average shopper visits a store 32 times a year, average basket size of ~$24, thus $~760/year. I model each shopper represents one household (or slightly less than 1), thus each Dollar General requires ~2.5k households as frequent shoppers to support the store economics.
For every $100 store sales, ~$69 is COGS (including the goods, and logistics/distribution),
-
$7 goes to store labor (each store has 8 to10 employees, avg $15k/year)
-
$5.6 goes to store lease: avg $110k/year
-
$1.8 goes to other store operating expenses, such as utilities, insurance, maintenance, and repairs.
-
$7 goes to HQ overheads.
That leaves a ~$9 operating profit (per $100 store sales), if we take financing expense, and tax into consideration, its net profit is about ~$6 (per $100 store sales).
The numbers vary from year to year but are largely within the +/- 1.5% range.
Compounding Earning Power
Let us look at what drives its compounding earning power. I will start with an analyst question during the 2Q23 conference call from Michael Lasser:
"My follow-up question is, historically, Dollar General has targeted an algorithm of mid-single-digit unit expansion, 2% to 4% comp growth, stable to growing margins and then buying back 4% to 5% of the stock to get to double-digit EPS growth. So if you take all of the different pieces of that algorithm, especially store growth, is it realistic that Dollar General can get back to that algorithm by 2024 based on what you know now?"
This question lays out Dollar General's 3 not-so-secret levers for its earnings per share growth for the last decade: Same-store sales (SSS), Store Count Growth, and share repurchase.
SSS growth is driven by unit price and volume: excluding pre/post Covid noise, DG achieved 7-8% SSS growth over the last decade (though slowly declining from 8-9% to 7% prior to COVID)
It is straightforward to break it down: price-wise, it is mostly at parity with inflation, 2-3% increase a year.
The rest is through various initiatives to increase store foot traffic and average basket size by 4-5% a year.
Same Store Sales Growth (company data)
Store Count: From 8k stores in 2010 to over 18k by 2022, a 7.5% CAGR over a decade, however, the growth rate has been declining quite significantly since 2017. There is a good explanation for that. As mentioned above, an average DG store needs 2.5k households that frequently shop in DG to support its store economics, which is roughly 6k population.
Dollar Store Count YoY% (company data)
That means when you open a store servicing a 20k population, it requires 30% of households to be your regular customers. The math gets harder as Dollar General reaches more sparsely populated areas. It also explains why many municipalities object to Dollar General stores - because for the math to work out for Dollar General, it requires certain pricing strategies to complete and ultimately reduce local stores' presence.
Share repurchase: DG's total outstanding shares reduced by 35% from 340Mn to 219Mn since 2011 when initiated its share repurchase program, at 3.8% CAGR.
In summary, these 3 levers (7.5% store growth, 7-8% SSS growth, 3.8% share reduction) expand its earning power from EPS $1.04 in FY2009 to over $10 in FY2022, a ~10x over a decade, delivering an astonishing ~20% CAGR.
Now one might ask does that mean Dollar General hasn't leveraged its scale to improve its profit margin?
That is by and large correct. Its operating margin has been around 7-9% since 2011, except for some one-off macro events (e.g. 2021 gov stimulus check), or when fundamentally retooling its business model (e.g. 2008-10 during Dreiling's leadership)
Expectation Model
When there are multiple levers/variables, each with uncertainties yet impactful to the top/bottom line, the DCF model often becomes a 'name a price, I can get there' exercise. Thus I prefer to use the Expectation Model which starts with the current price and arrives at the expectation implied by that price.
Some basic assumptions: I model that Dollar General will continue to execute its Dreiling playbook: that is to continue to provide affordable daily essentials to lower-income households, mostly in rural areas with underprivileged neighborhoods. It continues its capital allocation practice, to have a meaningful % of net income return to shareholders via dividends and share repurchase.
Other assumption includes an 8% discount rate, a 21% tax rate, a 5% interest rate (DG's debts are mostly fixed-term debts issued prior to rate-raising), 20% dividend payout. Debt remains the same, SSS on parity with pre-COVID inflation at ~2.5%, with no shopper volume increases. Store growth follows the trend to continue to decline and reduce to 1.5% by 2030.
I model its profit margin to slowly decline by 120bps in 7 years to 6.6% by 2030, and the stock P/E is valued at 12x then.
These are implied expectations for the current stock price range ($110 - $120)
Company Data (Author Compiled)
* lowered store growth and buyback for 2024, considering management's conservative tone in recent quarters
Dive into the Model
If these implied expectations are all correct (most likely not) if one buys Dollar General today, one will get ~8% CAGR in the next 7 years, acceptable but not exciting.
Among all the levers, I feel most uncertain about store growth, let us zoom in.
We talked about 2014's 25k store target. In the model, the growth will gradually decline from 4% to 1.5%, and reach 24k by 2030. At first look, this seems conservative.
There are a few reasons, a good site selection requires a delicate balance between the population density of a chosen site, nearby competitors, area household income, and site traffic conditions, etc. I rumbled quite a bit, the point is when DG started the journey staring at an under-tapped space, it's intuitive to start with low-hanging fruits. As the store growth progressed, DG is getting closer to the final land grab, and it is for sure harder than earlier bites, thus putting pressure on both the growth pace and, equally important, the operating profit margin. That also explains why I model its profit margin gradually declines.
Here comes the unwelcoming news to DG shareholders - Dreiling (yes, Dreiling the CEO) became Dollar Tree's chairman/CEO in Jan 2023. Its Family Dollar unit is the most direct competitor to Dollar General. It might finally give DG a run for its money.
External Threats
Dreiling, DG's modern-day architect and CEO from 2008 to 2015, became Dollar Tree's CEO earlier this year. As a turnaround CEO does, he started with a fundamental changeover in no time.
Family Dollar and Walmart are two of DG's closest and biggest competitors. DG has been maintaining price parity (usually MSD lower than FDO, and 2-3% higher than WMT) but now might be under pressure, if FDO significantly improves its operating margin, and returns a portion of that value back to its customers.
Something to watch closely.
The other risk is people. Dollar Tree already hired at least 3 senior executives from Dollar General, including Bobby Aflatooni ((IT)), MIke Kindy (Supply Chain), and Larry Gatta (Merchandising) to Dollar Tree's top positions.
Internal Risks
While DG's store growth is capped, and under the leadership of Dreiling, Dollar Tree, esp. its Family Dollar business might finally realize a turnaround, which adds pressure to Dollar General's profit margin, and SSS growth. If both become true, this is the first time in over a decade that key earning drivers face structural headwinds, and how Dollar General management responds to it is unknown.
Will it stick to its tried-and-true yet overplayed playbook, or it might seek some fundamental changes - either way, there is a strategy decision risk in my opinion.
Conclusion
Dollar General's past decade-long compounding growth was built upon uniquely positioned store assets, supported by a well-optimized operating playbook, and executed by a disciplined team.
Despite being an exemplified compounder in the past, it faces threats from both competitors (namely Family Dollar run by Rick Dreiling) and store growth ceiling.
Dollar General is on my watch list. I will closely monitor key levers (SSS growth, store count growth, capital allocation) that drive its business success, and how the above-mentioned concerns evolve.
I use the expectation model mentioned in the article to assess how these key levers and concerns change its intrinsic value. That helps me to continuously evaluate the company and make a swift decision when a more compelling opportunity presents itself.
For further details see:
Dollar General: A Strong Earnings Compounder Facing Growth Ceiling