O - Dollar General: Buy On Rare Pullback
2023-07-11 03:02:39 ET
Summary
- Dollar General checks a lot of boxes that smell like a deal to me.
- The main two troubling items are the capital expenditures well in excess of depreciation and amortization and the negative free cash flow.
- The high return on invested capital is a big plus for me, but decreasing margin trends in the past 3 years offset some of that excitement.
- This is clearly cheaper than Dollar Tree and a rare pullback you might not see again.
- Cautious buy, dollar cost average and increase bets if free cash flow per share gets over the dividend per share.
Headline
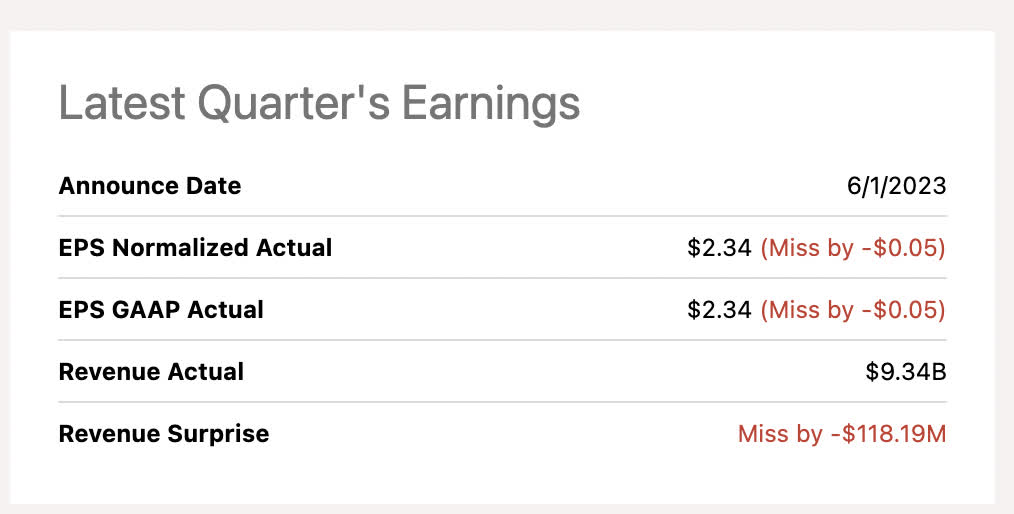
A recent earnings miss coupled with higher-than-normal capital expenditures has sent Dollar General Corporation (DG) plummeting. This is a stock that rarely sees a pull back. The chart since listing on the New York Stock Exchange has been amazing:
This is one of the most violent pullbacks the stock has ever seen. The market is signaling the end of growth for Dollar General, but the numbers tell a mixed story. Is this dip worth buying?
The chart
What a pull back. 35% off the high is bear/crash territory for Dollar General. This stock has been way over priced for some time and this pull back may have been overdue. The overall top-line economics of the company still seems to remain largely intact:
What they do
From the most recent 10K:
We are the largest discount retailer in the United States by number of stores, with 19,147 stores located in 47 U.S. states and Mexico as of March 3, 2023, with the greatest concentration of stores in the southern, southwestern, midwestern and eastern United States. Our first store in Mexico opened in February of 2023. We offer a broad selection of merchandise, including consumable items, seasonal items, home products and apparel.
Our merchandise includes national brands from leading manufacturers, as well as our own private brand selections with prices at substantial discounts to national brands. We offer our customers these national brand and private brand products at everyday low prices (typically $10 or less) in our convenient small-box locations.
The story up to here
E-commerce competition and a focus on areas within MSAs of low population density, and therefore lower competition, might be negatives according to Morningstar . The low price per item also results in a small total basket purchase dollar amount at checkout. Thus customer volume is essential to the business model as enormous amounts of products have to be moved to tally sizable revenue.
That being said, the revenue continues to march upward and Dollar General is making a move away from the over reliance on consumables to a larger mix of consumable/non-consumables. In essence, creating more of a one-stop shopping experience for some shopper customer segments.
Valuation model
This is one of those consistent inflation plus companies that we would want to see growing along with inflation. An owner earnings model is appropriate here. However, CAPEX trends need to normalize in order to make the earnings more predictable.
All numbers in millions courtesy of Seeking Alpha
- TTM Net Income: 2,377
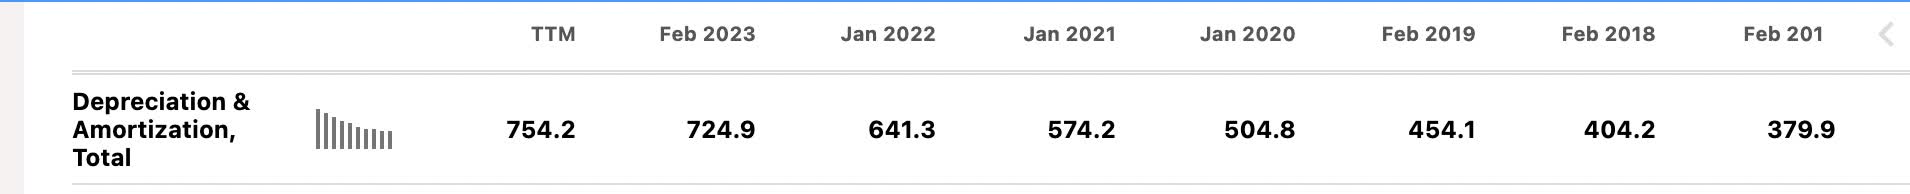
- Plus TTM Depreciation and Amortization: 754.2
- Minus CAPEX: 1,642
- Equals Owner Earnings of: 1,489
- Discounted at 10 Year Treasury Risk Free Rate: 4.02%
- Fair Market Cap: 37,044
- Divided by TTM shares outstanding [219.3]= $168.9
Capex trends
Seeking Alpha
Seeking Alpha
The above observations of Capital Expenditures versus Depreciation and Amortization trend lines are a bit troubling. There was a nice equilibrium up until 2021. Afterward, CAPEX started outpacing D&A almost 2 to 1. This trend has also pushed Dollar General into a negative free cash flow position in some trailing quarters which can threaten dividend increases. Borrowing isn't much of an issue with 13 X EBIT net interest coverage. The question is whether or not Dollar General wants to borrow at today's rates to support dividends, increases, and buybacks.
Compared to Dollar Tree
Using the same valuation logic for Dollar Tree ( DLTR ) reveals a fair price of $90.23. With Dollar Tree currently trading at $144, Dollar General appears to be a much cheaper play if you are looking to get your dollar/discount store fix. That being said, since Dollar General is not a "true" dollar store, but more of a low price, under $10 store, they also compete with Five Below, Inc. ( FIVE ). Five below is at an even greater premium to these two trading at 40 X GAAP.
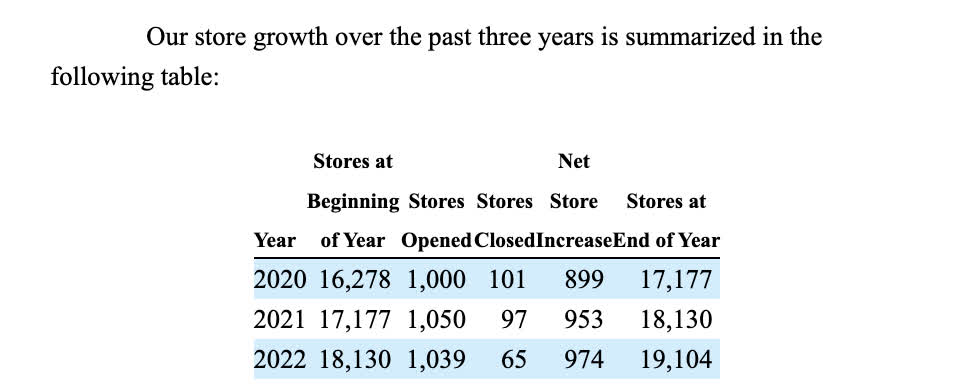
Store growth
DG 10K
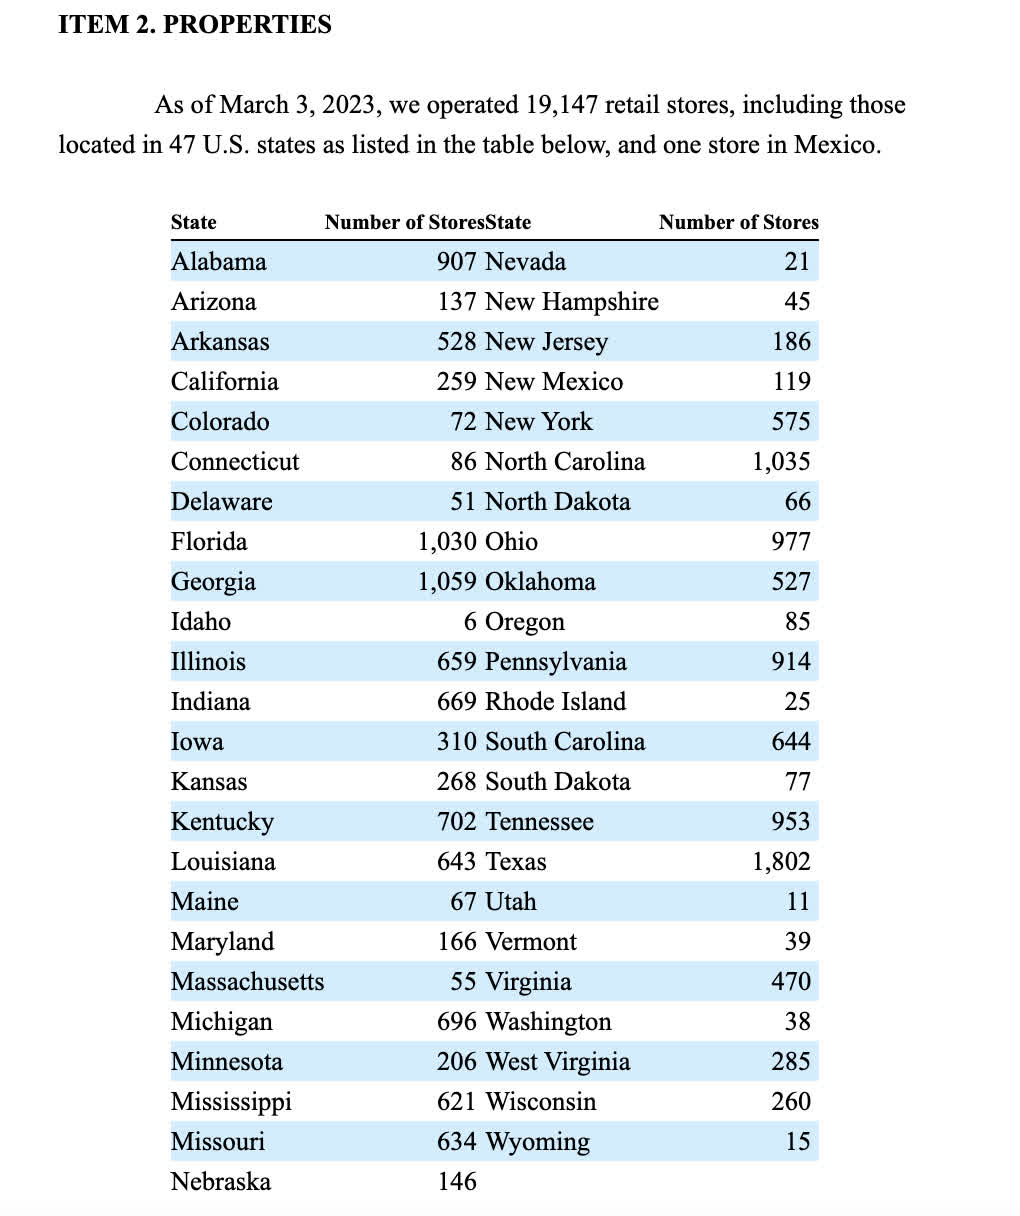
Outfitting new leased properties is expensive. Most of these stores are leased and Dollar General is a large tenant of Realty Income Corporation ( O ). Here is the territorial layout of their footprint
DG 10K
There is an obvious over-emphasis on the Southern region of the United States. The company also owns its own cold storage warehouse distribution network.
ROIC
Nopat (net operating income after taxes)/total LT + ST borrowings + total equity
- Nopat=EBIT X (1- tax rate)= 3,325 X (1-22.5%)= 2,576.87
- TTM total equity= 5,935
- TTM Long term debt + short term borrowings = 7,028 LT + 389 ST= 7,417
- NOPAT/ Invested Capital= 2,576.87/ (5,935 + 7,417)= 19.29%
Management has been effective at investing capital. While this has receded a bit, it's still a higher return on capital than you will find in most brick-and-mortar retail/grocery chains.
Balance sheet trends
Current assets are staying ahead of long term debt. This is definitely a positive, especially when Dollar General has low amounts of short term interest bearing debt.
Buybacks
Amazing buyback trend. Can't say it has been the best use of capital in that the GAAP and Non-GAAP earnings yield has been paltry. However, if you're buying in now that it's beginning to get cheap, this would be a good area for Dollar General to speed up the buybacks and curb the CAPEX.
EBIT to net interest coverage
All numbers in millions courtesy of Seeking Alpha
- TTM EBIT: 3,325
- TTM net interest: (254.6)
- Coverage of 13 X
No threats to Dollar General from an interest payment perspective.
Margin trends
Gross margins remain flat with slightly downward operating and net profit margins. This tells me that Dollar General has a problem with operating efficiency more so than inflationary pressure for the cost of their goods. SG&A crossed double digits in 2023 with an increase of 11.8%. A large addition of employees and increased wages would seem to be the main culprit of margin compression.
The dividend and free cash flow
Seeking Alpha
Free cash flow coverage
- TTM FCF/Share: $.38
- FWD Payout of $2.36
Not covered by free cash flow.
Catalysts
Getting back on the good side of Wall Street will help. The recent earnings miss has sent the stock down quite a bit. Additionally, some grocery chains expressing concern about their strength of the customer base set off alarm bells. I am looking for a return to positive free cash flow as my number one catalyst. That will be my overweight buy signal.
Seeking Alpha
Risks
Seeking Alpha
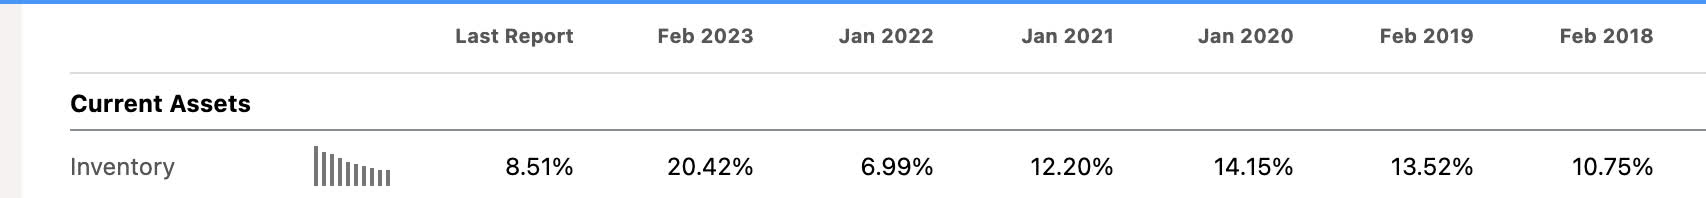
That 20.42% increase for the inventory line under current assets sticks out like a sore thumb. There has not been a 20+% increase year in the past 5. The company started with 18,130 stores at the outset of 2022 and ended up with 19,104 at year end, an increase of 5.3%. The two growth trajectories seem out of line and it appears Dollar General may have over-expanded in conjunction with weakening consumer demand.
Pluses and minuses
| Plus |
| Minus |
| growing revenue |
| negative FCF |
| fair price based on owner earnings |
| too much inventory |
| buy backs |
| flat to decreasing margins |
| current assets > LT debt |
| over expansion of footprint |
| 19.29% ROIC |
| Capex exceeds Depreciation and Amortization by a wide margin |
Conclusion
Dollar General checks a lot of boxes that smell like a deal to me. The main two troubling items are the capital expenditures well in excess of depreciation and amortization and the negative free cash flow. The obvious growth goal of Dollar General is to build lots of stores and increase its footprint rather than drive new consumers to existing stores. The rapid growth and apparent large capital outlays to open new stores every year may have hit a fulcrum of over-expansion.
The high return on invested capital is a big plus for me, but decreasing margin trends in the past 3 years offset some of that excitement. The dividend is not covered by free cash flow, which is another negative. Buybacks have been consistent and helped to improve returns on equity and capital. I see an even amount of plusses and minuses. Morningstar and CFRA both have buys on the stock. This is clearly cheaper than Dollar Tree and Five Below and a rare pullback you might not see again. Cautious buy, dollar cost average and increase bets if free cash flow per share gets over the dividend per share.
For further details see:
Dollar General: Buy On Rare Pullback