SBUX - Dollarama: My Top Brick And Mortar Pick
2024-01-01 09:09:32 ET
Summary
- Dollarama is the leading dollar store operator in Canada and entered the LATAM market in 2019 through the 50.1% stake in Dollarcity.
- Store count and comparable store sales increased every single year throughout the past decade, resulting in 10.5% CAGR top-line growth.
- The Investment in Dollarcity is a success and the expansion into LATAM should drive growth well into the future.
- Dollarama generates returns on capital far above its cost of capital and has plenty reinvestment opportunities.
- A simple DCF calculation leaves me to assume that Dollarama is a bit undervalued at the current price.
Author's Note: Since Dollarama is reporting in Canadian Dollars, all numbers refer to Canadian Dollars (unless stated otherwise).
Introduction
I recently wrote a bearish article on Starbucks (NASDAQ: SBUX ) where I argued that while SBUX has good pricing power, same-store traffic has declined over the years, resulting in margin headwinds. Besides SBUX, the only other retailer I have covered so far was Hermès ( OTCPK:HESAY ) ( OTCPK:HESAF ) which is one of the highest-quality businesses I know.
In this article, I want to expand my coverage in the retail sector by initiating coverage on Dollarama Inc. (TSX: DOL:CA ) (OTCPK: OTCPK:DLMAF ), the leading dollar store operator in Canada. Dollarama's dollar store peers in the U.S., Dollar General (NYSE: DG ) and Dollar Tree (NASDAQ: DLTR ) had a very rough 2023 as can be seen in the following chart:
DG's share price has declined by close to 45% and DLTR is flat YTD. Only Dollarama has been able to keep up with the broader index.
Dollarama has been on my watchlist for over a year. As I recently did with my article on American Financial Group , I want to use this article and the research it takes to write it to get a better understanding of the company and decide whether I want to initiate a starting position or not.
Dollarama Overview
Dollarama is most commonly known for operating dollar stores in Canada. The company currently operates 1,541 stores in Canada. Dollarama differentiates between three product categories: (1) Consumables, (2) General Merchandise and (3) Seasonal Items.
Consumables refer to drinks, snacks, food, beauty, health, pet care, sweets and cleaning supplies. General Merchandise refers to things like electronics (for example batteries), kitchenware, toys and apparel (besides many other things). Seasonal items are things like Christmas decorations, souvenirs, Easter items and so on.
The sales mix consists of 44% Consumables, 41% General Merchandise and 15% Seasonal Items. This will be important later on because Dollarama's sales mix is very different from for example Dollar General.
Dollarama sells items at fixed price points in the range of $0.87-$5.00. The new price point of $5.00 was only introduced in FY23.
One thing that people who are not that familiar with the company might not know is that Dollarama also operates dollar stores in Latin America. Back in 2013, Dollarama entered an agreement with Dollarcity to provide sourcing services and share business knowledge. Dollarama gained the option to acquire a 50,1% interest in Dollarcity later on, which it used on July 2, 2019. Dollarcity currently operates 480 stores in Latin America (El Salvador, Guatemala, Colombia and Peru - more on that later).
So what are the key metrics we should look out for? The same that we have to look at for every retailer: (1) Store count growth, (2) Pricing and (3) Traffic. In this sense, Dollarama is very similar to SBUX. Let's discuss all of these factors separately.
Canada - Store Growth
This part is pretty straightforward. I will start with two charts:
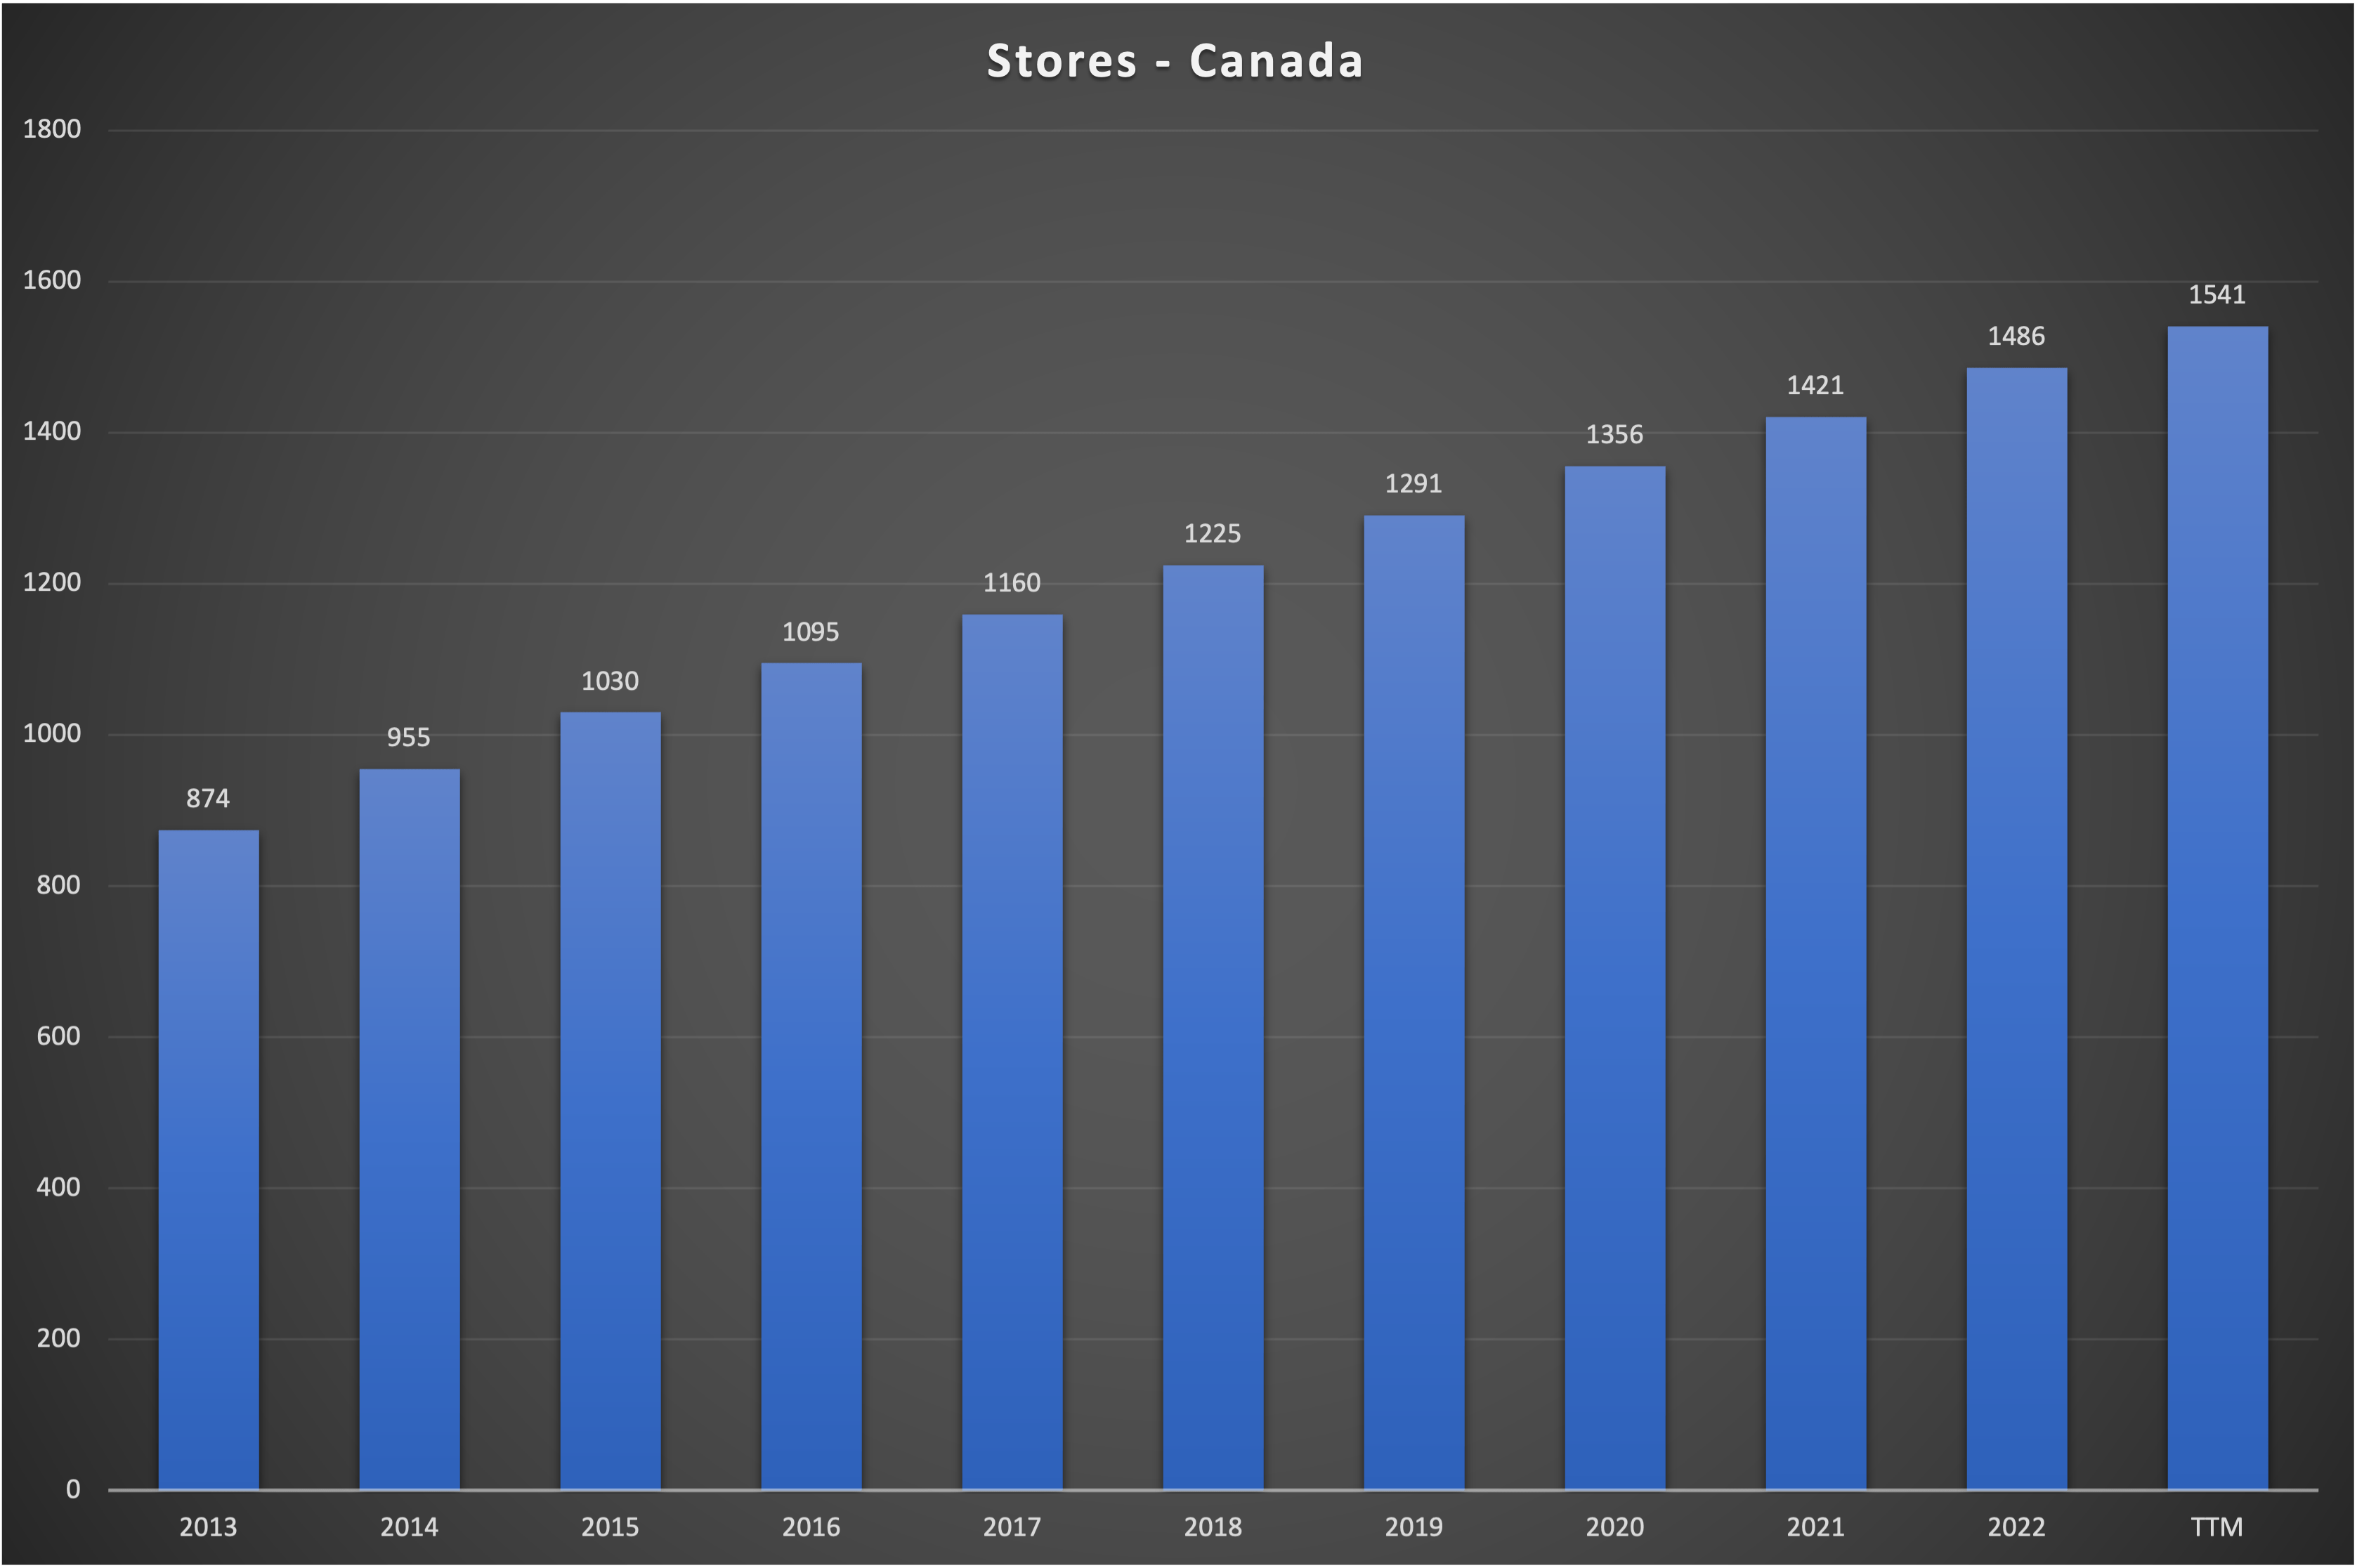
Canada Store Count since 2013 (Company reports)
Dollarama has been able to consistently increase the number of stores in Canada, achieving a CAGR of 5.8% since 2013. Here is the second chart showing YoY growth rates expressed in percentages:
Canada YoY Store Growth (Company reports)
Here we can see that while Dollarama was able to increase the store count, YoY growth rates have been trending down. This is to be expected once a company matures and has fewer locations to open new stores.
Here is a slide from the most recent Q3 24 Earnings Presentation:
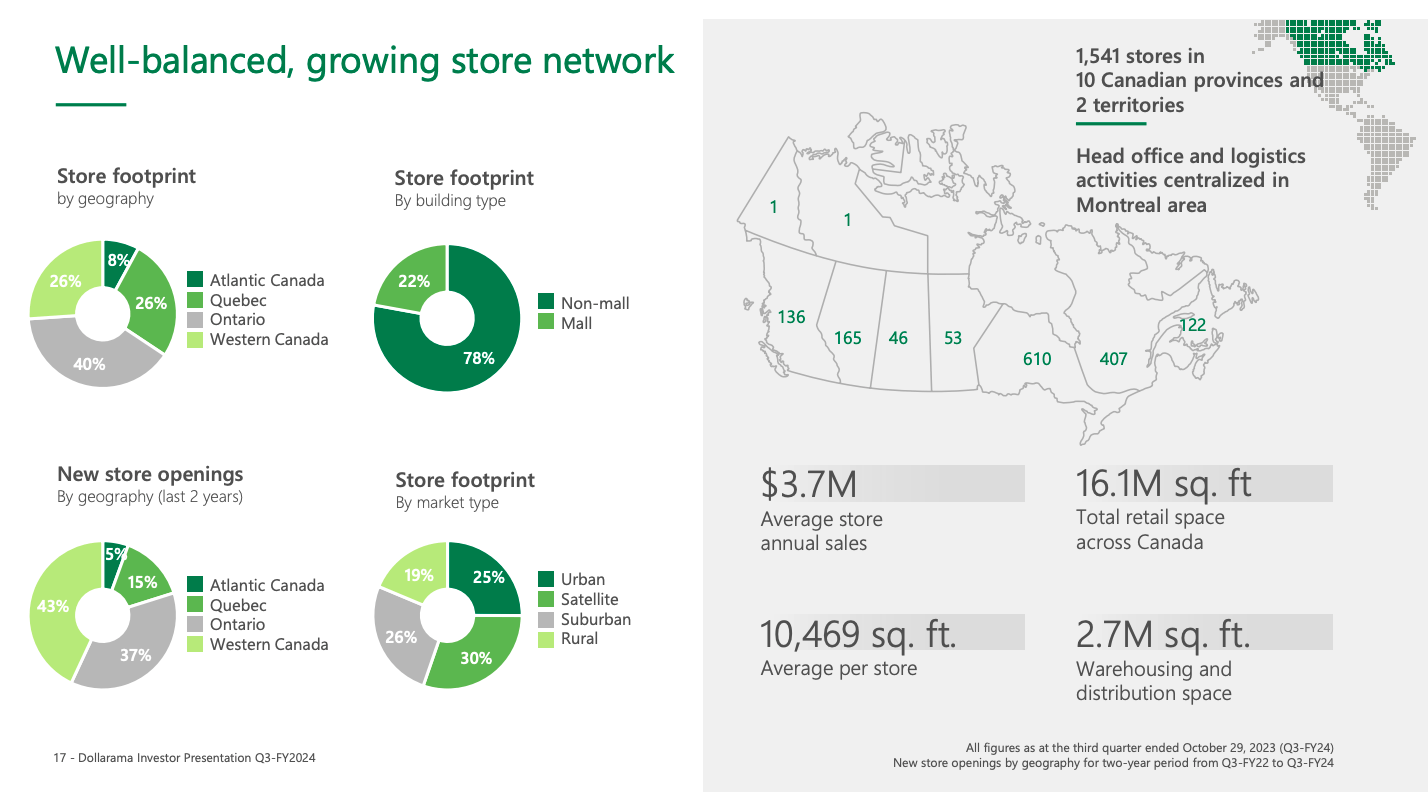
Store Overview - Canada (Q3 24 Earnings Presentation - Slide 17)
Two-thirds of Dollarama's stores are located in Ontario (610 stores) and Quebec (407 stores). According to Dollarama, there are additional growth opportunities in Ontario, Quebec and Atlantic Canada. Dollarama is also underpenetrated in Western Canada. British Columbia has around 5 million inhabitants while Ontario has around 14.5 million, so British Columbia (currently 136 stores) should have room for at least another 65+ stores.
According to the slide above, Dollarama's stores are also very well diversified through market types, with Urban, Rural, Suburban and Satellite making up roughly a quarter of stores each.
Dollarama set a target to reach 2,000 stores in Canada by 2031, indicating a CAGR of 3.2%. This indicates much slower store growth rates than we have seen in the past and looks very conservative. The company has a history of overachieving its store targets, so I think calculating 3.2% store growth in Canada until 2031 is more than reasonable.
Canada - Same Store Sales Growth
Dollarama reports comparable store sales while dividing it into two parts: (1) Number of Transactions and (2) Average Transaction size. The number of Transactions is what I usually describe as "Traffic" and the Average Transaction size is "Pricing". Price Increases and an increasing number of transactions are what drive a store's sales and profitability, so we want both metrics to show a consistent upward trend.
I will start with a chart showing total comparable store sales development:
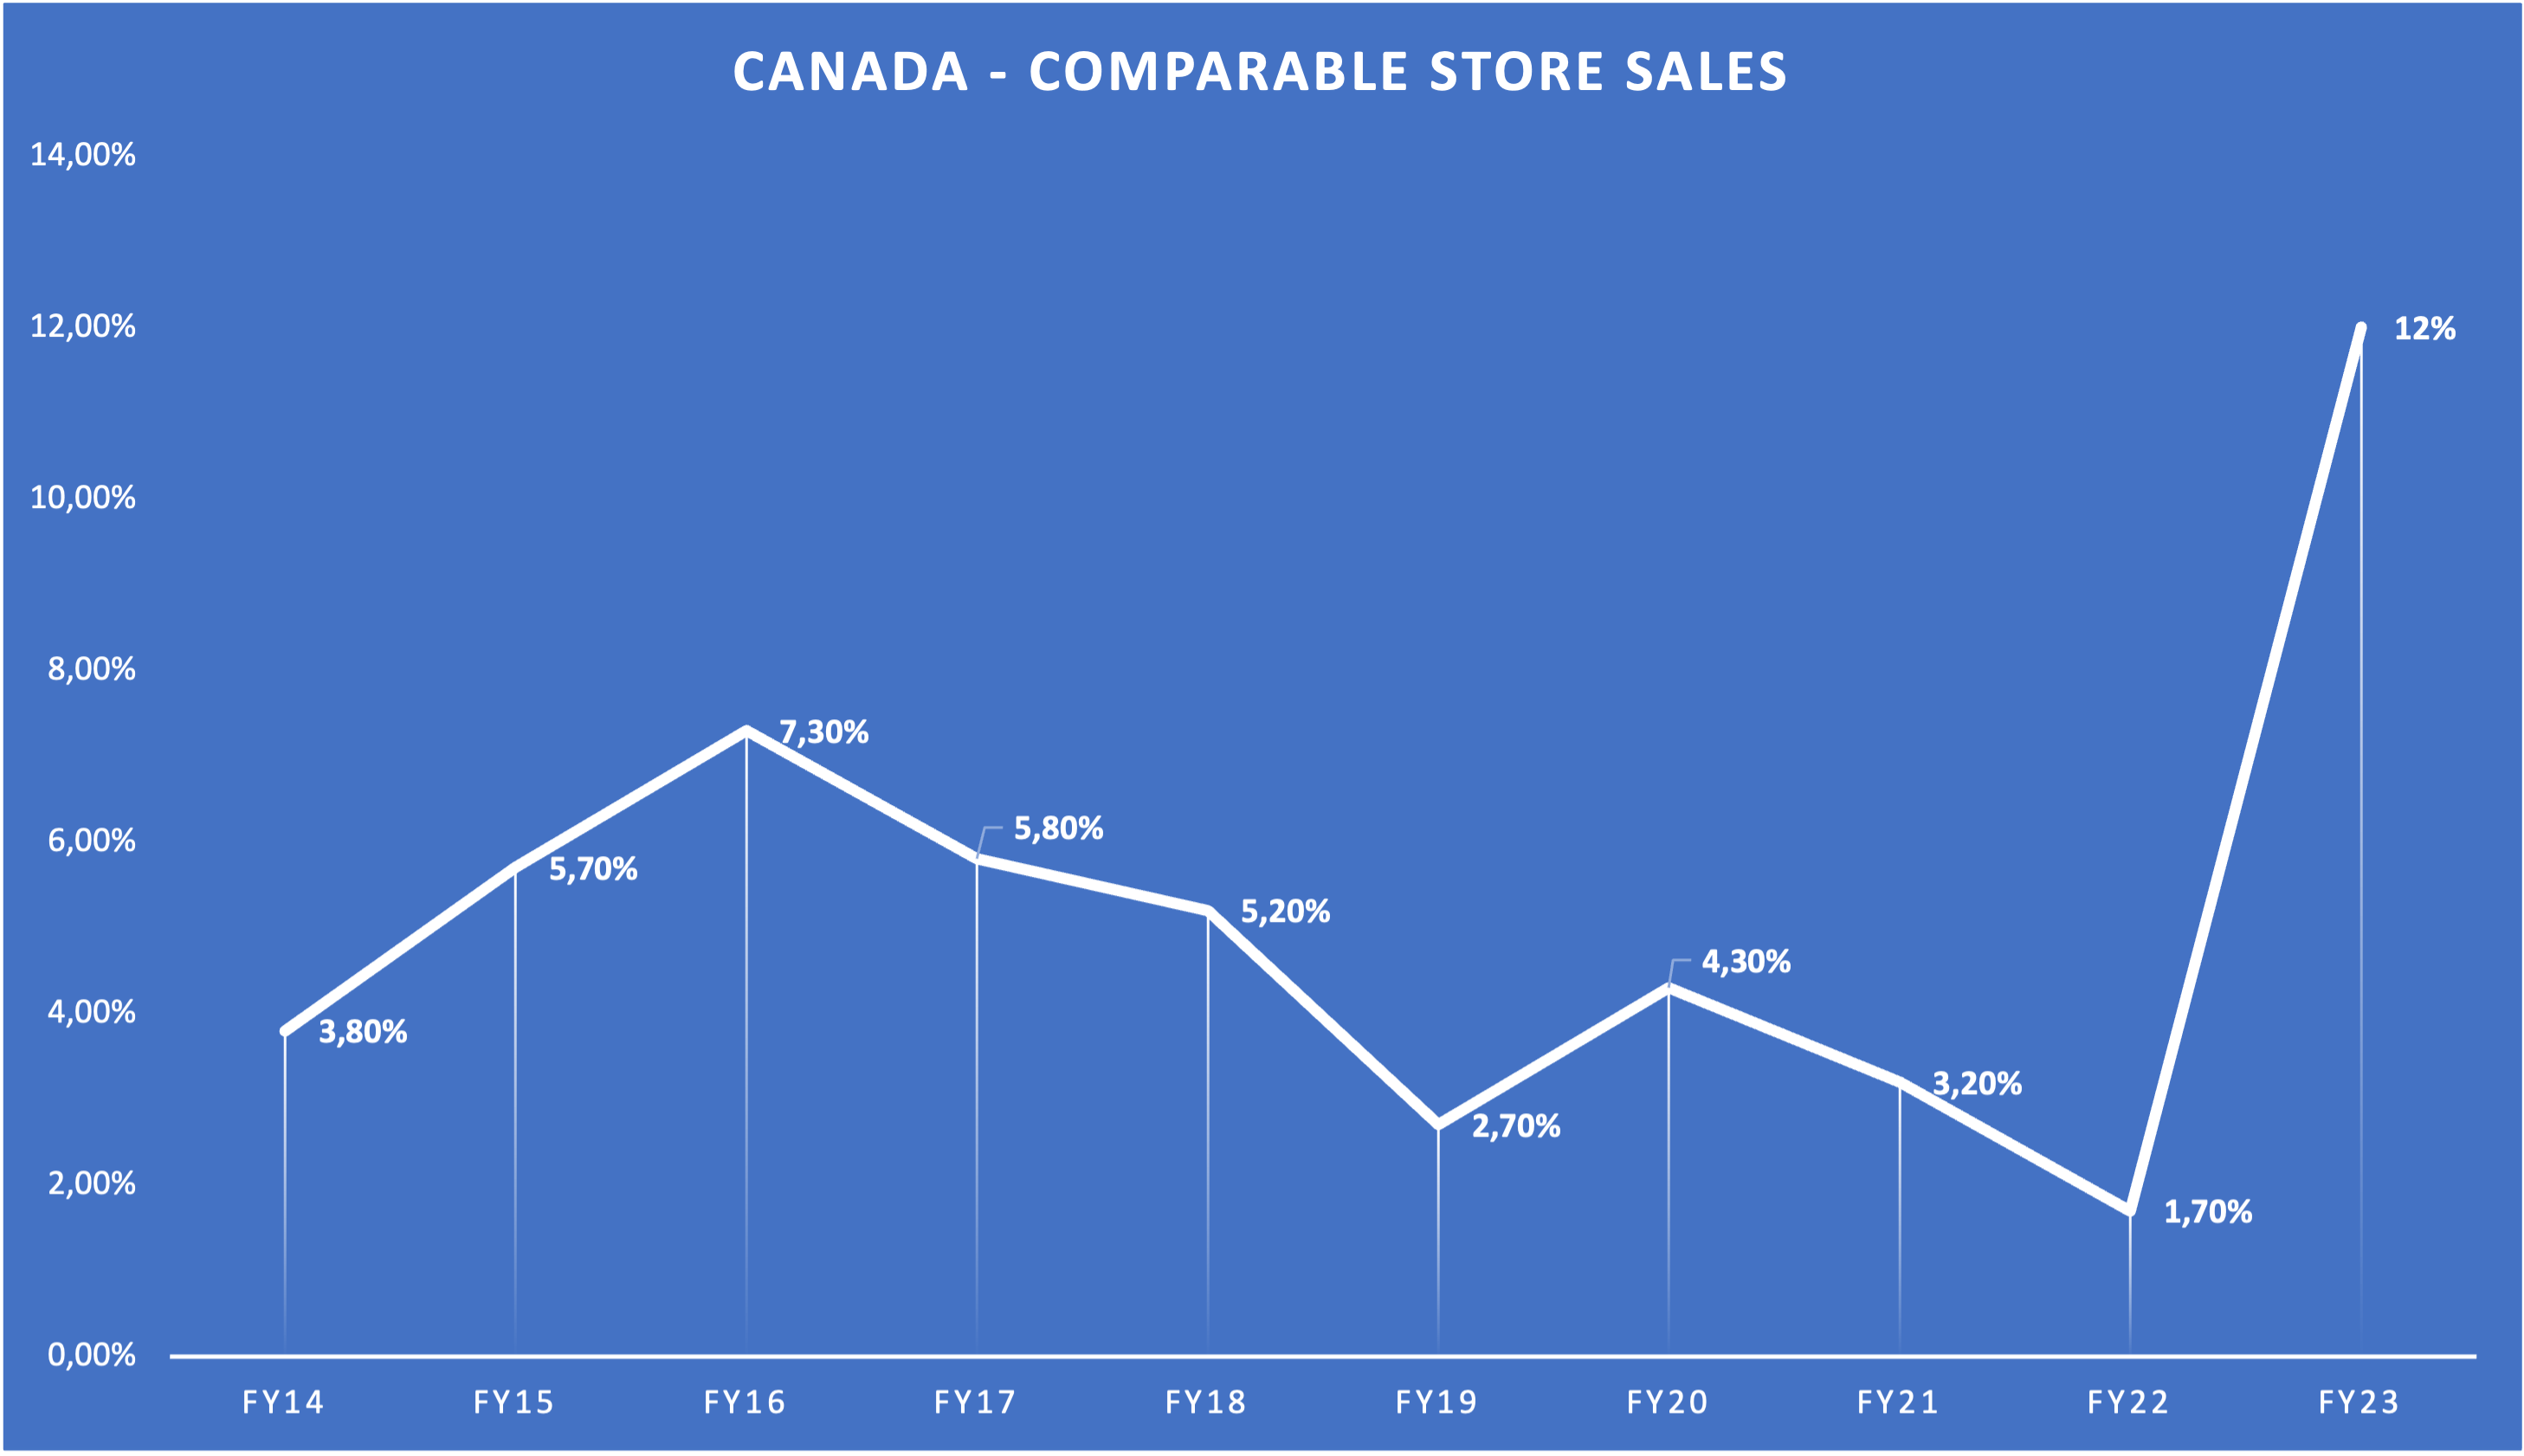
Comparable Store Sales - Canada (Company Reports - Compiled by Author)
Here we can see that comparable store sales increased every single year since FY14. Please note that FY23 is basically CY22 because Dollarama's fiscal year ends in January. The average YoY growth rate was 5.17% while the median growth rate was 4.75%. While looking at this chart, the first thought that comes to mind is that FY23 is an outlier due to high inflation leading to high price increases. Let's see.
Here is a chart showing the YoY change in the number of Transactions or in my words "Traffic":
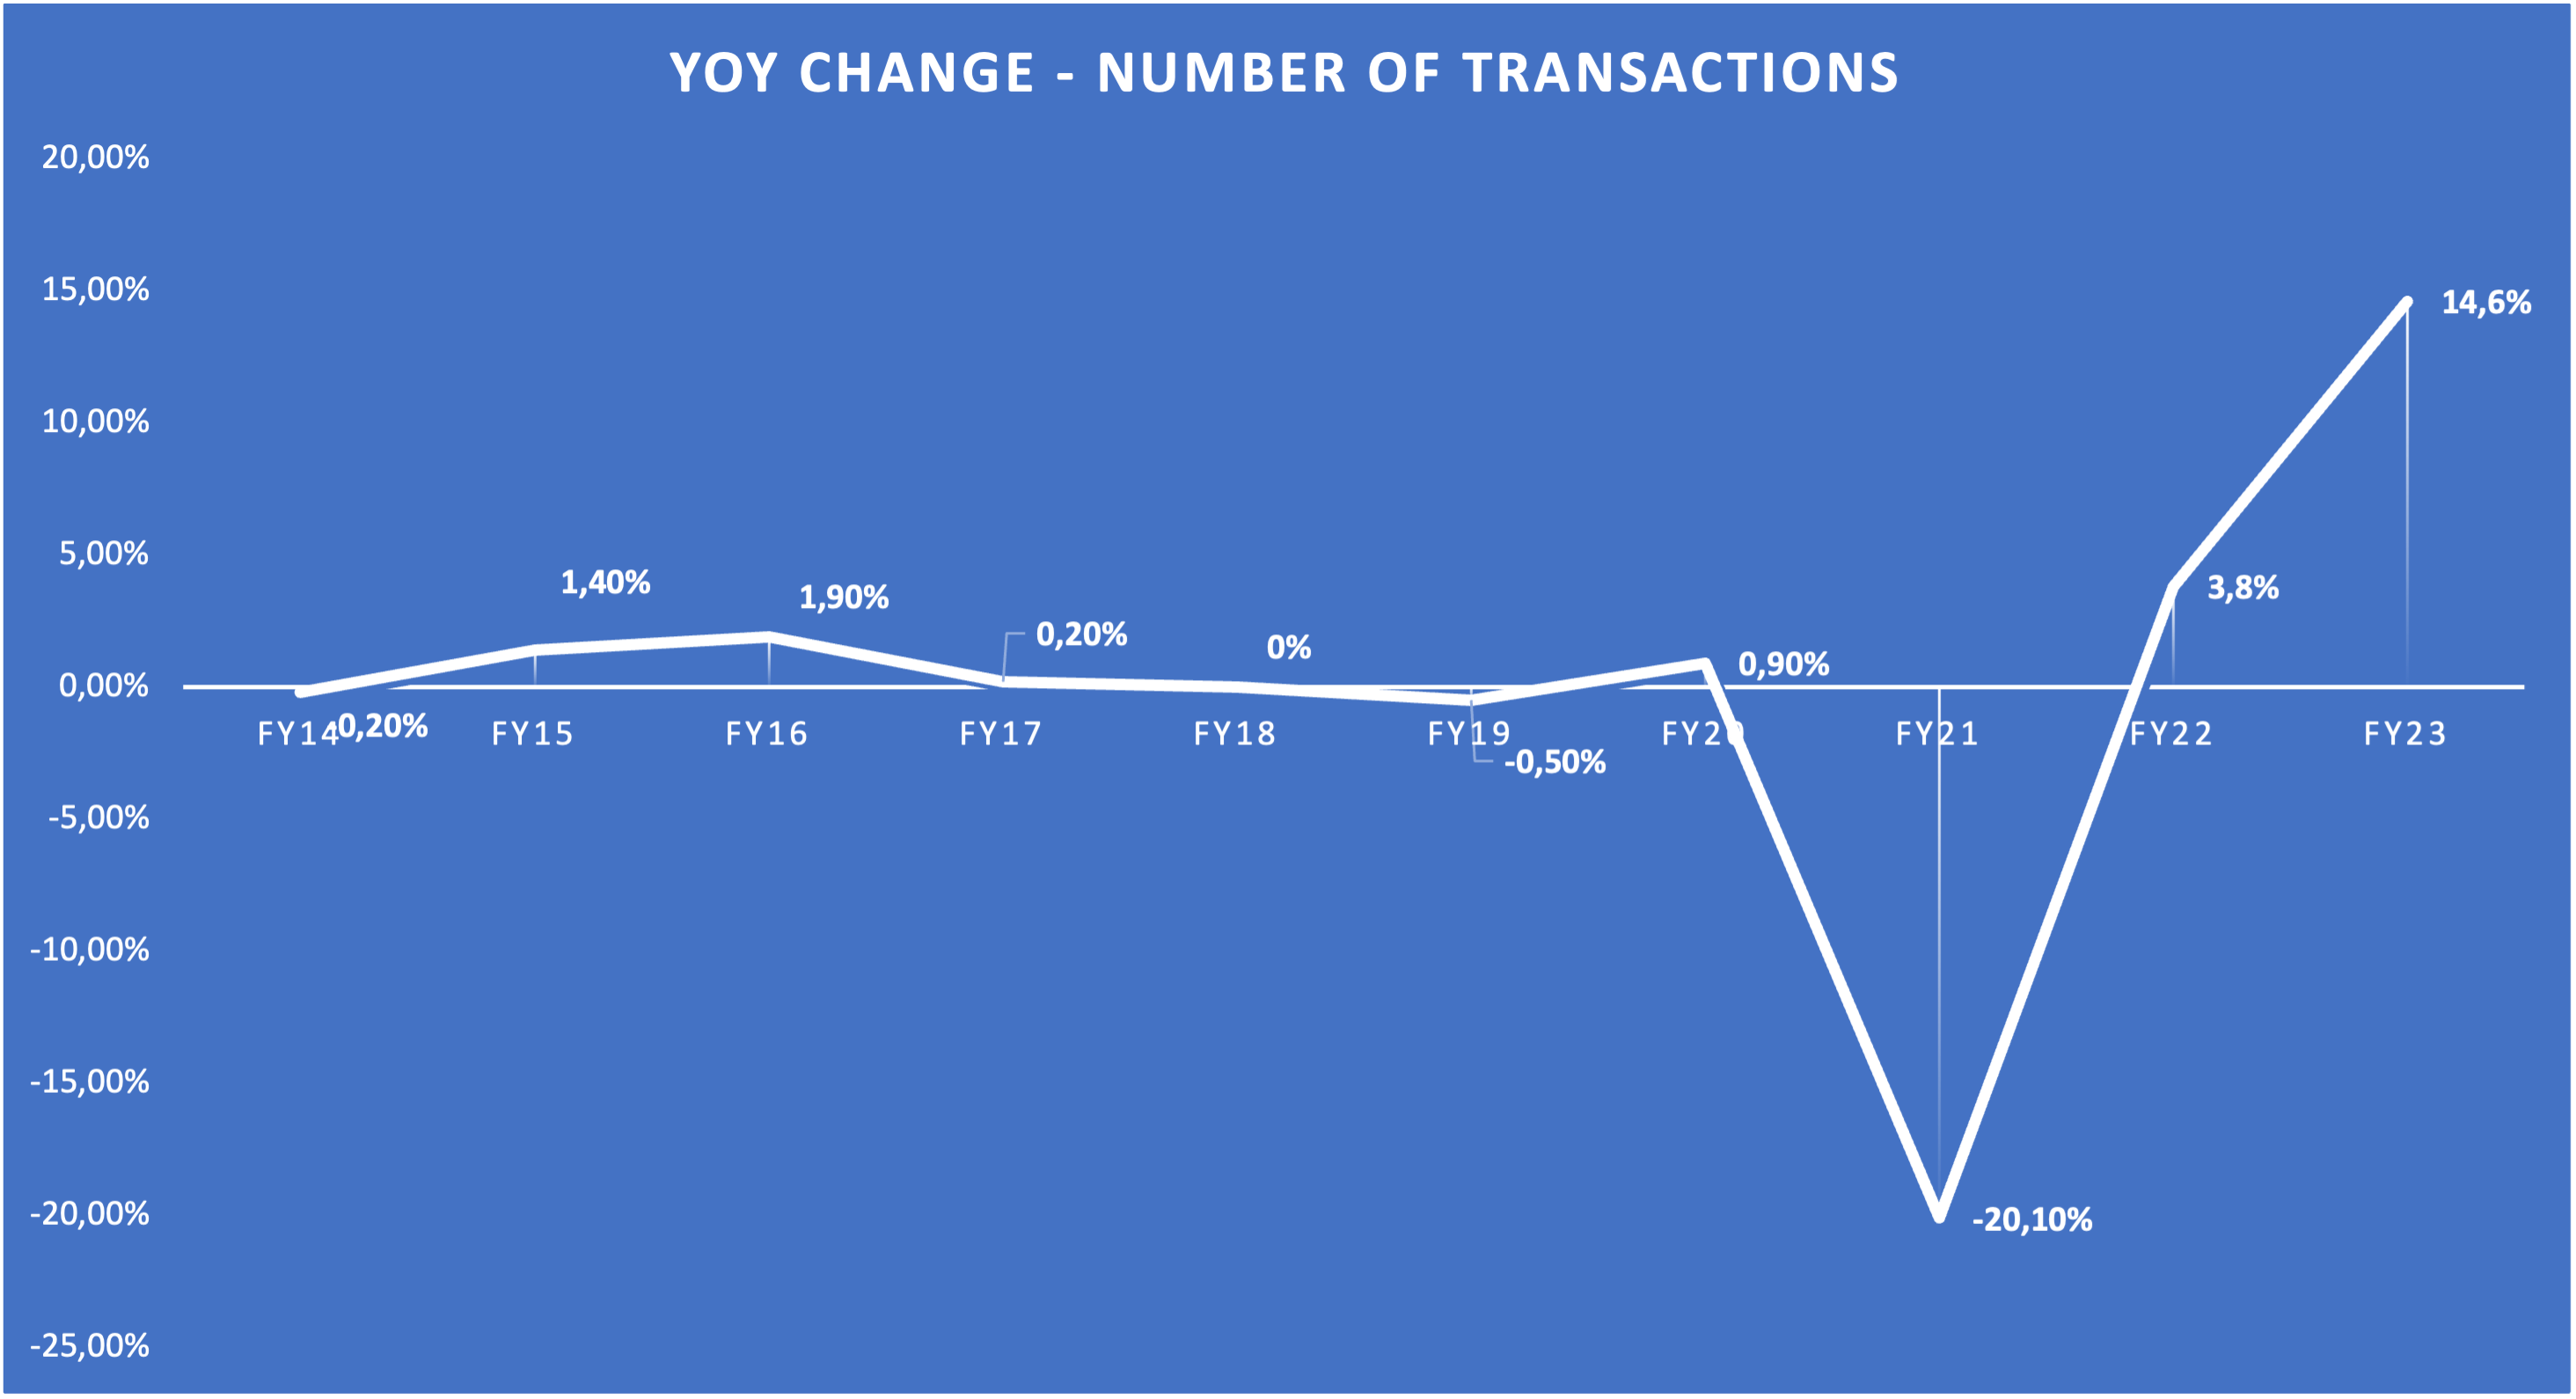
Number of Transactions - Canada (Company Reports - Compiled by Author)
Here we can see that Traffic was pretty much flat in the past (maybe 1% YoY growth) before declining sharply in FY21 due to the pandemic. If I apply these numbers to 1,000 transactions in FY14, FY23 transactions would be 986, similar to what I have seen at SBUX. But there is a difference. Here are the YoY growth rates in numbers of Transactions for the first three quarters of FY24: Q1 = 15.5%, Q2 = 12.9%, Q3 = 10.4%. If I assume 12% YoY Traffic growth in FY24, that would put the above calculation at 1,104 transactions in FY24 (up from 1,000 in FY14), indicating a CAGR of 0.9% which is nearly in line with the 1% Traffic growth I have mentioned earlier. The key takeaway here is that Dollarama's customers have come back since the pandemic restrictions were lifted which is a very good sign. This also shows that the big spike in overall comparable store sales in FY23 was not because of pricing but because of the comeback of traffic that was lost during the pandemic.
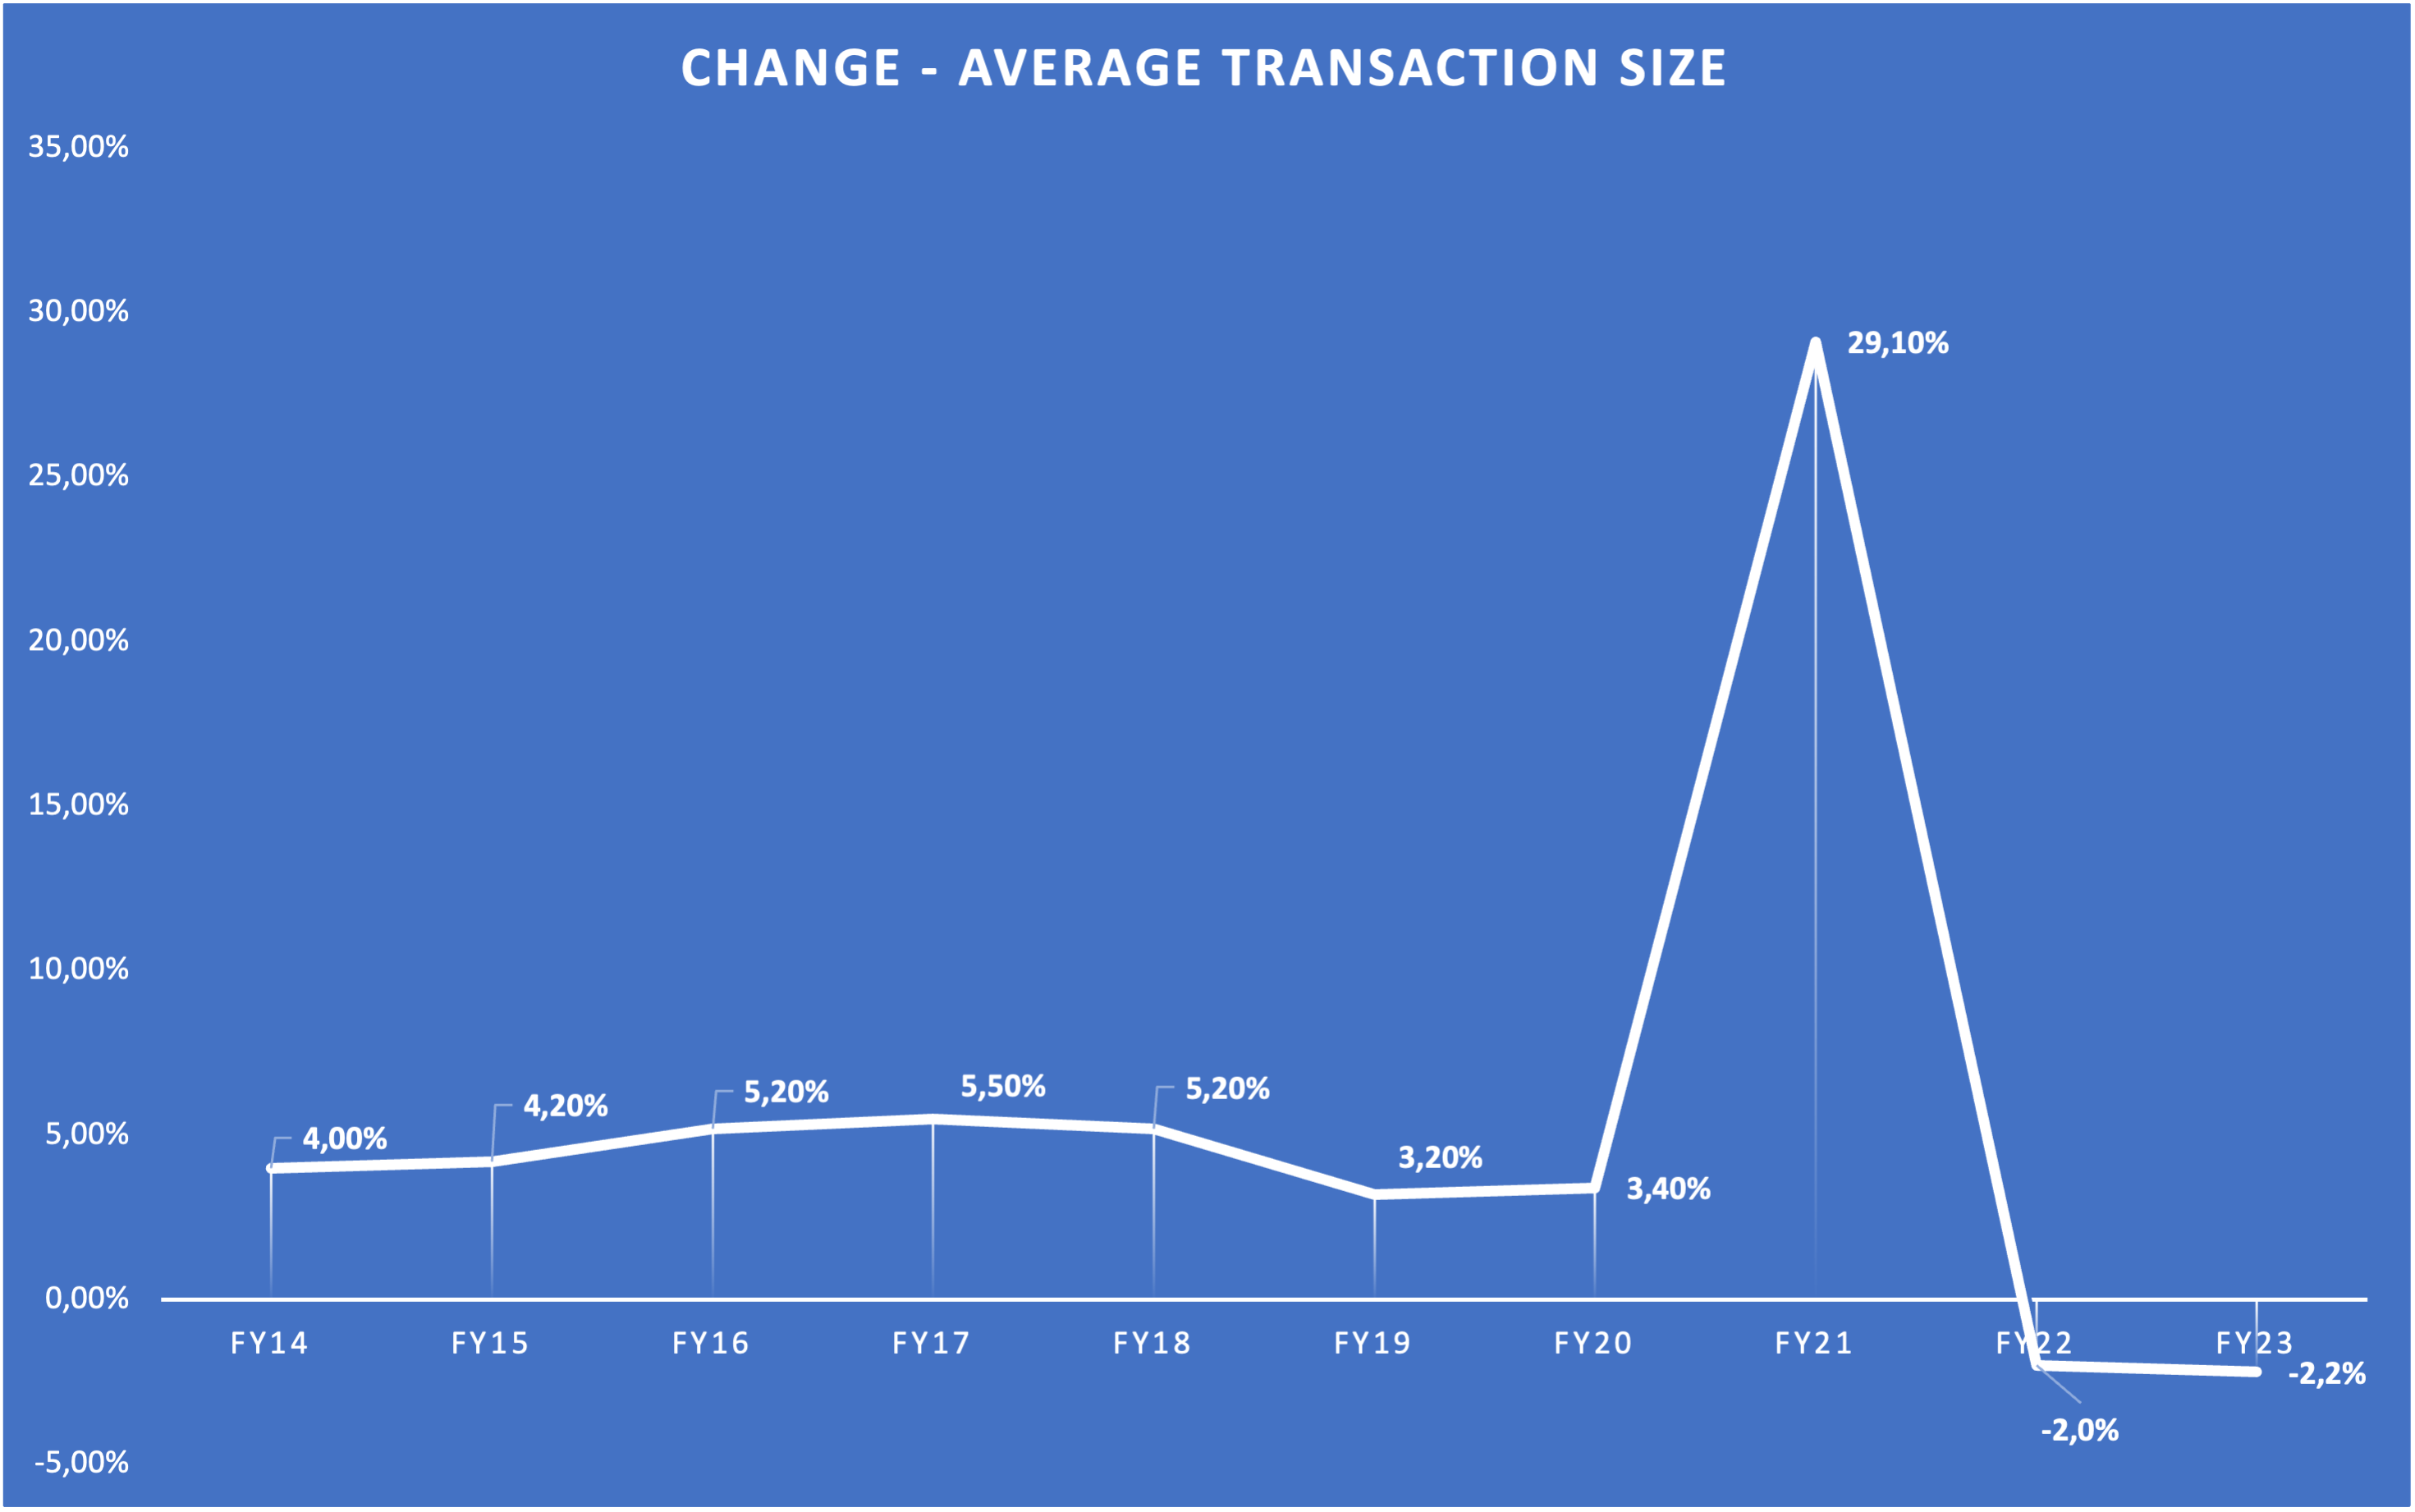
Here is the second chart showing the YoY change in Average Transaction Size or "Pricing":
Average Transaction Size - Canada (Company Reports - Compiled by Author)
Another very interesting chart. Here we can see that until FY20, Dollarama was able to increase prices at around 4-5% per year, well above GDP growth of 2-3%. This is a sign that Dollarama has good pricing power. in FY21, the average transaction size skyrocketed by 29.1% YoY. Since the pandemic restrictions in Canada were quite harsh, people shopped less often but in higher volume. This fits the picture of the sharp decline in FY21 Traffic. Customers bought more but less often. Another interesting thing is that Pricing has been negative in FY22 and FY23. My best guess is that this is also an effect of the increasing Traffic after the pandemic. Customers come more often but purchase less (in more shopping trips). Here are the YoY changes in average transaction size for the first three quarters of FY24: Q1 = 1.4%, Q2 = 2.3%, Q3 = 0.6%. So despite Traffic coming back at high YoY rates, Pricing is already back in positive territory.
So what range of YoY sales growth contribution can we expect from Pricing going forward? My best guess is that Dollarama will be able to increase prices like they did before the pandemic once both Traffic and Pricing normalize. So 3.5-4% seems reasonable.
Dollarcity
I want to spend quite some time talking about Dollarcity because it is one of the most exciting topics. Numbers are scarce but I will work with what Dollarama gives us.
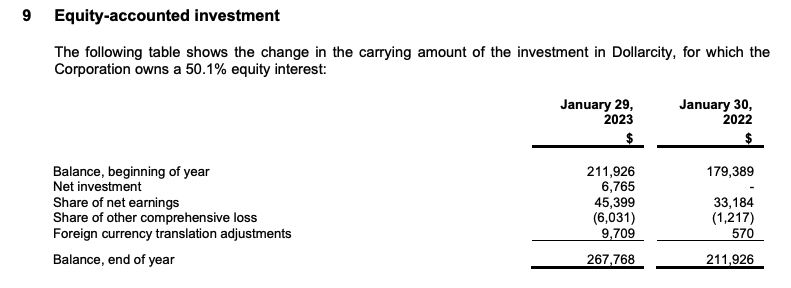
Let's start with accounting. Dollarama treats Dollarcity as an equity investee and accounts for the investment as a joint arrangement using the equity method. Using the equity method, Dollarama includes the carrying amount of the investment in Dollarcity as a non-current asset on the balance sheet. Here is a screenshot of Note 9 from the FY23 Notes to Consolidated Financial Statements:
Note 9 (FY23 Notes to Consolidated Financial Statements)
Here we can see that the FY23 net earnings share for the 50.1% Dollarcity stake amounted to $45.4 million, up around 50% from the $33.2 million in FY22. These $45.4 million are added to the income statement at the step from gross profit to operating income (as one number).
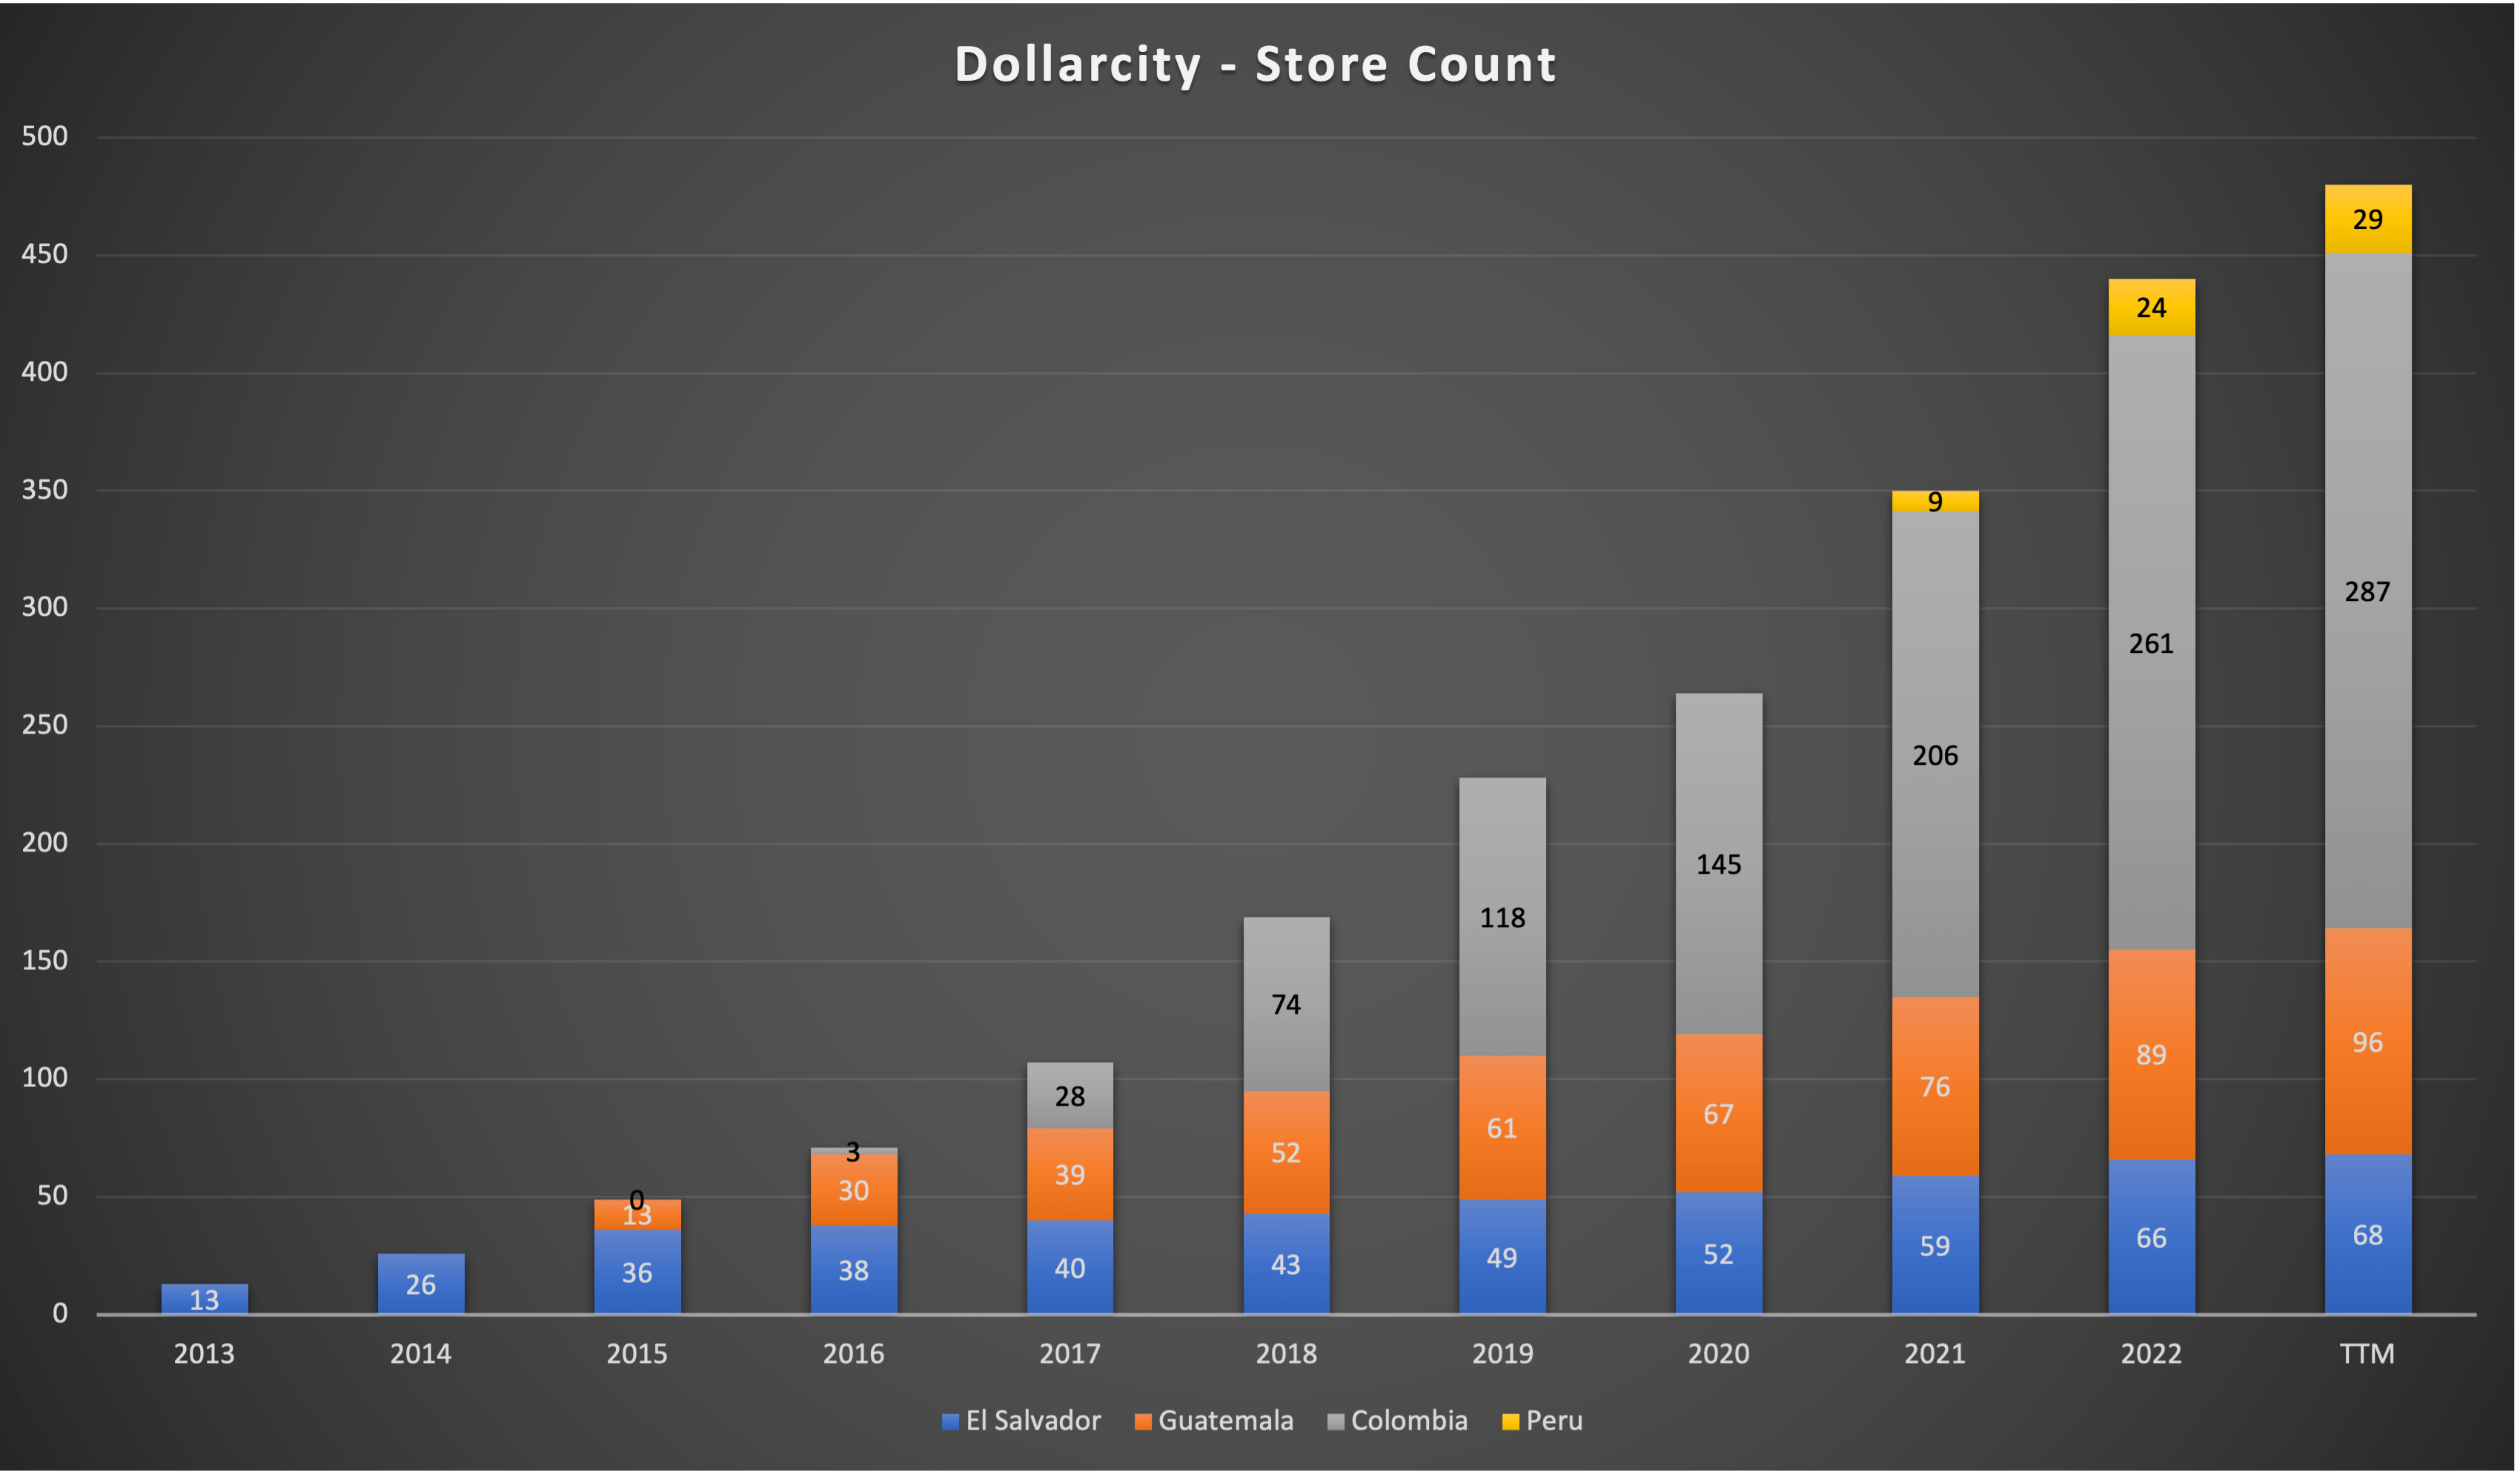
Now let's look at the store count. Here is a chart showing Dollarcity's store count since inception:
Dollarcity Store Count (Company reports - Compiled by Author)
Here we can see that Dollarcity has multiplied the store count by 37x since 2013, an incredible number. Dollarcity currently operates in El Salvador, Guatemala, Colombia and Peru. Dollarcity entered Colombia in 2017 and Peru in 2021. I couldn't find any information on plans to further expand into other countries because Dollarama doesn't disclose many details about the Dollarcity business. My best guess is that Dollarcity will enter more markets like they did in the past, only entering a new country every few years.
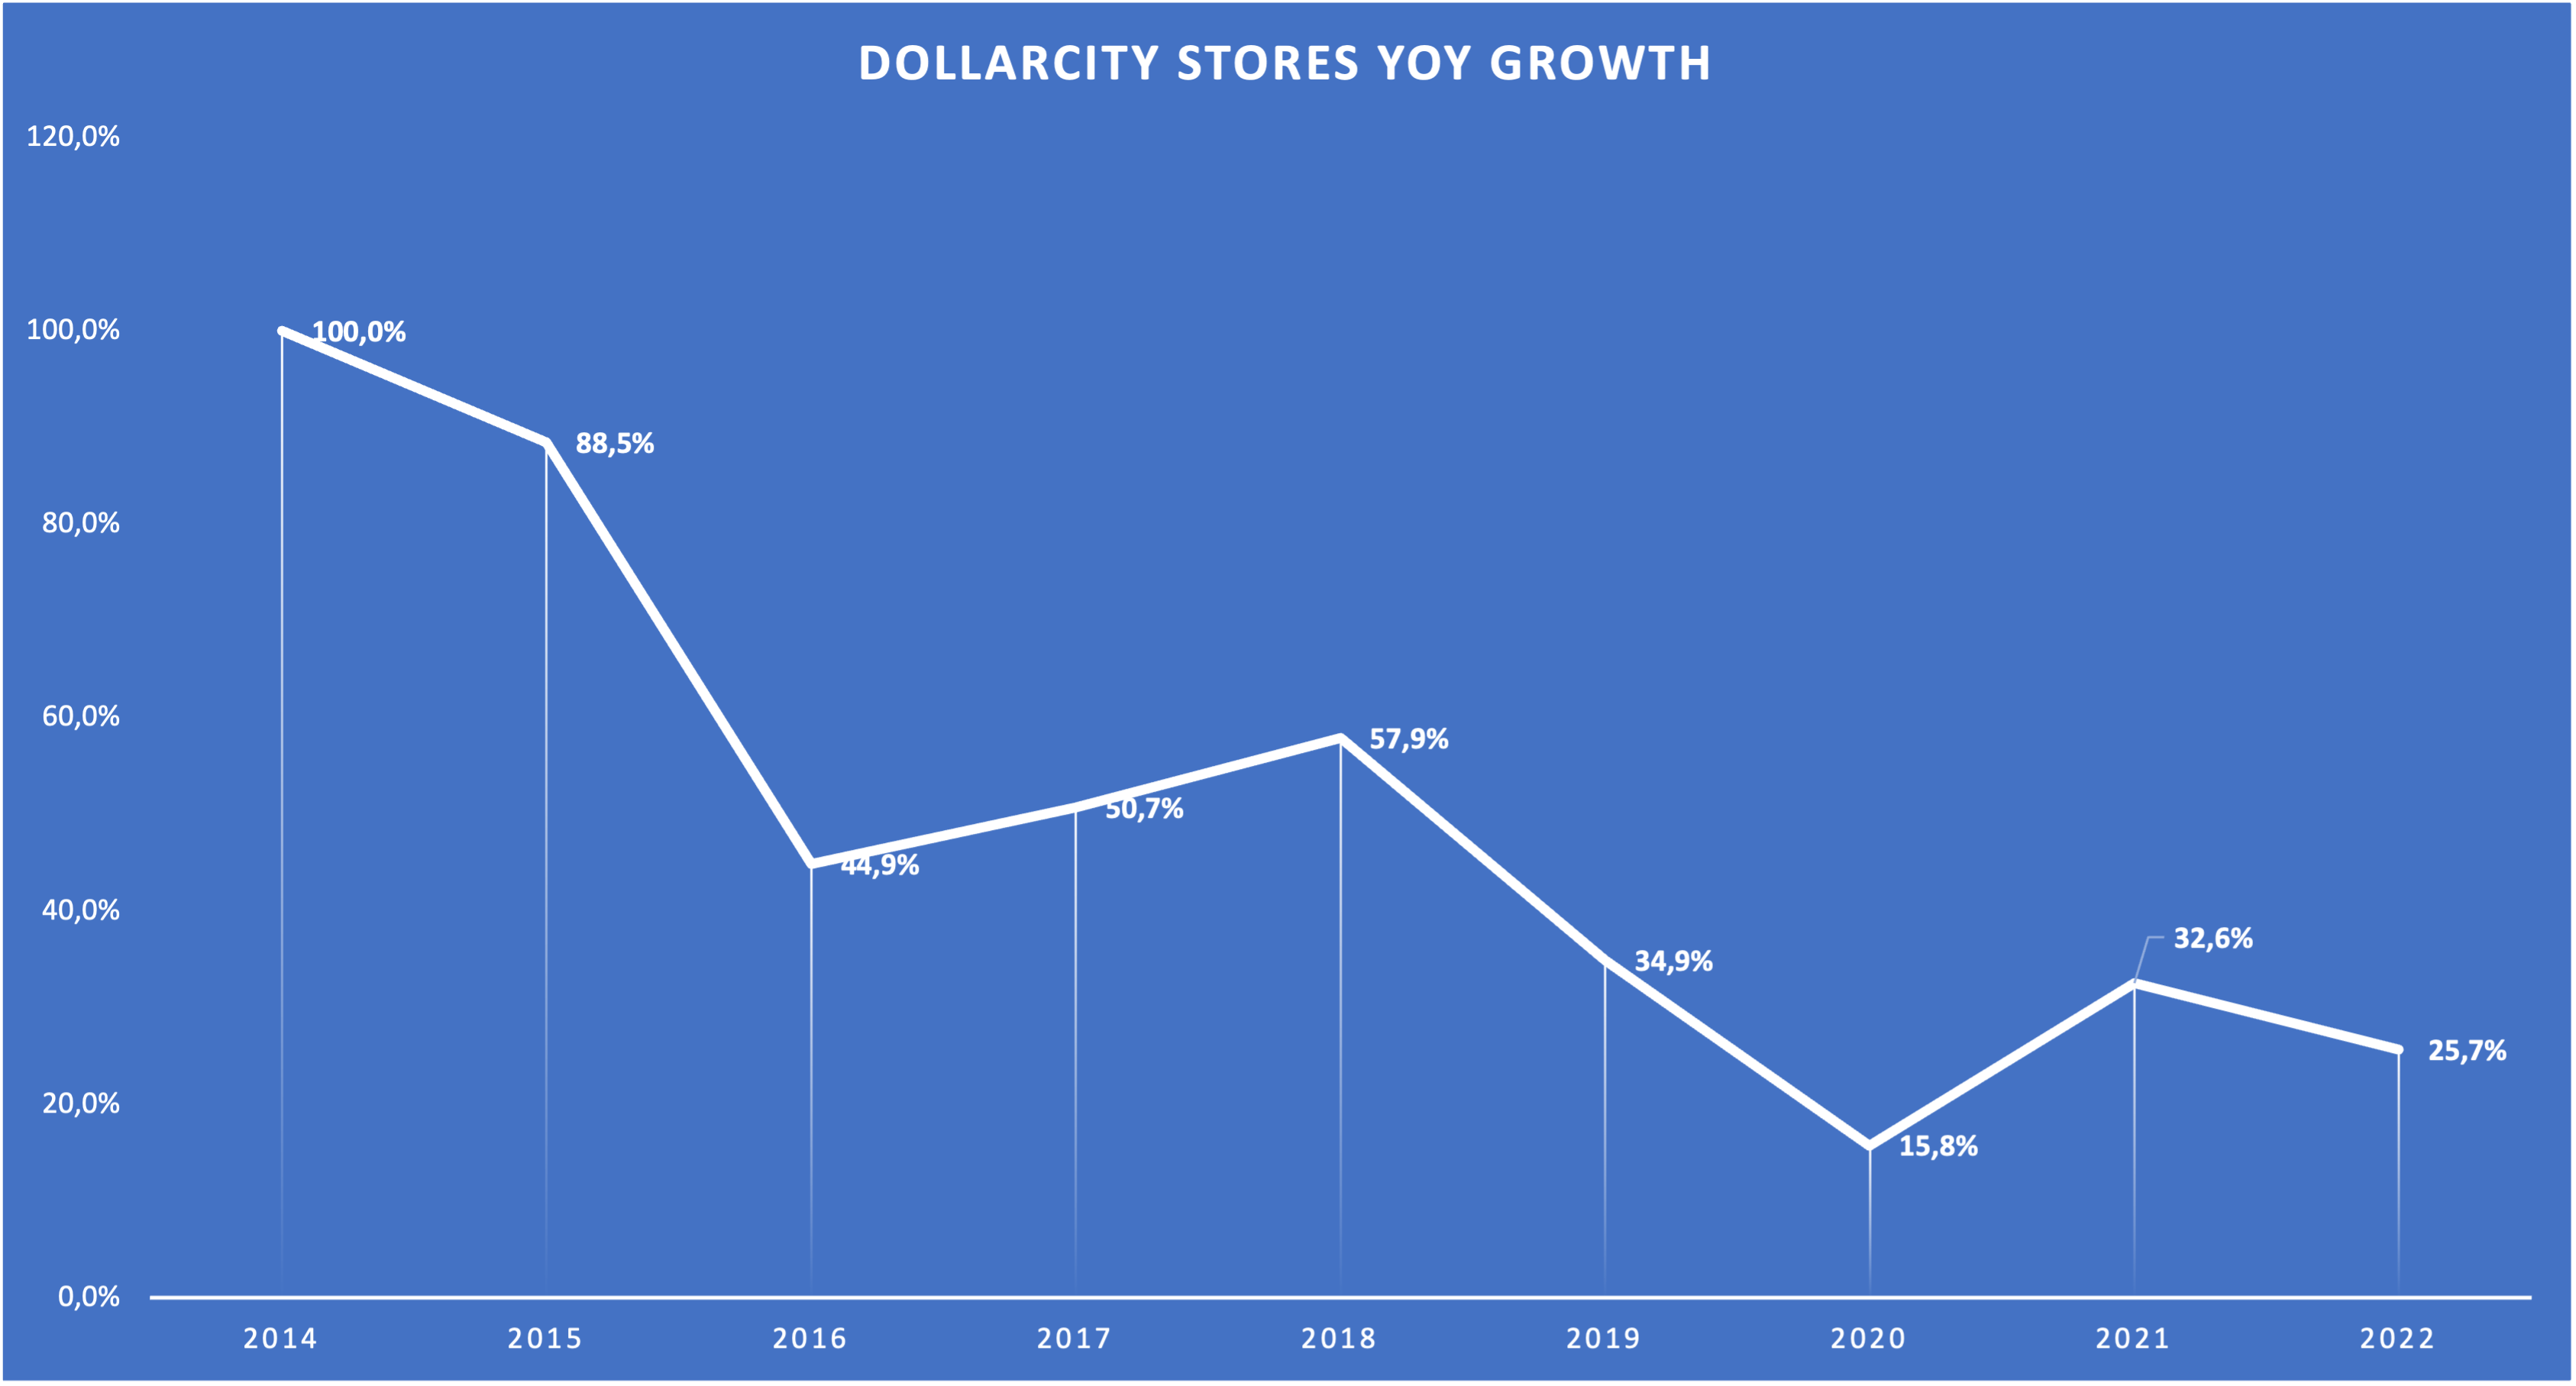
Here is another chart showing the YoY growth rates for Dollarcity's stores:
Dollarcity YoY Store Growth (Company reports - Compiled by Author)
YoY growth rates have been trending down which was to be expected given the very high growth rates in the early years. However, YoY growth rates are still very high. According to the Q3 24 earnings call , Dollarcity recently opened its 500th store. So FY24 YoY store growth for Dollarcity should come in at around 15%. Dollarama targets 850 Dollarcity stores by 2029. Assuming 500 stores at the end of 2023, this implies a CAGR of 9.2%, still a very strong number.
Dollarama doesn't disclose comparable store sales growth for Dollarcity but we can try to gauge it with the numbers Dollarama gives us. Here is a table with Dollarcity's sales (as far as we know) and store count:
| Year |
| 2020 |
| 2021 |
| 2022 |
| Sales in |
| 470.9 |
| 636.6 |
| 960 |
| Sales YoY |
| 35.2% |
| 50.8% |
| Stores |
| 264 |
| 350 |
| 440 |
| Stores YoY |
| 32.6% |
| 25.7% |
We can see that sales growth outpaced store growth. Assuming unchanged YoY comparable store sales, sales in 2021 and 2022 should have been around $624.3 million and $800.3 million respectively (prior year sales multiplied by (1+YoY store growth)). Excess sales growth amounted to $12.3 million in 2021 and $159.7 million in 2022, leading me to assume that comparable store sales grew by 2.6% in 2021 and 25.1% in 2022. If you go back and look at the chart I used in the Canada chapter, the trend is the same. We also saw weak comparable store sales in FY21 (which is 2020, remember that Dollarama's fiscal year ends in January) and strong comparable store sales in FY22 in Canada. So my numbers are probably not precise but they do the job of showcasing that Dollarcity experiences comparable store sales growth just like Dollarama does.
I also want to look at the effect the Dollarcity investment has on Dollarama's income statement. Remember that the 50.1% share of Dollarcity's net earnings is included in Dollarama's income statement. Here is a short table showing the $ amount of net earnings that are included in Dollarama's income statement (in ):
| FY |
| 2021 |
| 2022 |
| 2023 |
| TTM |
| Dollarcity Net Earnings (50.1%) |
| 19.7 |
| 33.2 |
| 45.4 |
| 62.3 |
Here we can see that the share of Net Earnings Dollarama receives from the investment in Dollarcity more than tripled since FY21 (in less than three years). Here is a chart showing the contribution from the Dollarcity investment to total net earnings:
Dollarcity Contribution to Net Earnings (Company reports - Compiled by Author)
Because it grows so fast, the contribution of Dollarcity's earnings to total earnings nearly doubled over the past three years. So as long as Dollarcity grows faster than Dollarama, the share of net earnings from Dollarcity will become more meaningful. Another thing that might act as a tailwind is that Dollarcity's net margins stand at around 10% right now while Dollarama's net margins are in the range of 14-16%. So we might see some margin improvement at Dollarcity as well.
And here is one last table comparing Dollarama's sales to the 50.1% share of Dollarcity sales:
| FY |
| 2021 |
| 2022 |
| 2023 |
| Dollarama Sales |
| 4,026.3 |
| 4,330.8 |
| 5,052.7 |
| Dollarcity Sales (50.1% share) |
| 235.9 |
| 318.9 |
| 481.0 |
| Total Sales |
| 4,262.2 |
| 4,649.7 |
| 5,533.7 |
| Dollarama share |
| 94.5% |
| 93.1% |
| 91.3% |
| Dollarcity share |
| 5.5% |
| 6.9% |
| 8.7% |
Here we can see once again that the Dollarcity investment is becoming more important over time. For FY23, the 50.1% share of Dollarcity's sales already made up 8.7% of total sales (Dollarama and the 50.1% Dollarcity sales combined). With Dollarcity probably growing at a much higher rate than Dollarama in the future, this could lead to higher growth rates for Dollarama on the consolidated level.
Financials
I will start as I always do, by taking a look at the most recent balance sheet:
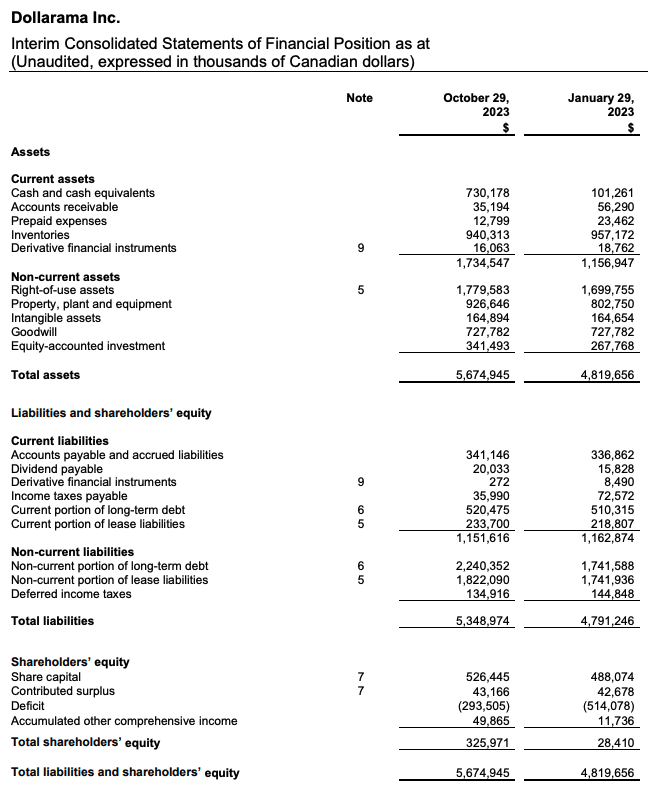
Q3 24 Balance Sheet (Company reports)
Here we can see the Dollarcity investment as an "Equity-accounted investment" of $341.5 million. The Goodwill of $727.8 million is unchanged since FY05 and is related to the acquisition in November 2004 (Private equity group Bain Capital purchased a majority stake in 2004).
Cash and cash equivalents amount to $730 million while total debt (current and non-current portion of long-term debt) stands at $2.76 billion. So the net debt position currently stands at around $2 billion. Net Earnings for the trailing twelve months stand at $948 million, so Dollarama's net debt currently stands at 2x Earnings. This is neither bad nor good.
Now let's look at the relevant earnings metrics and I want to highlight something beforehand. Dollarama makes zero adjustments to their reported earnings. This is something that we don't see that often and is, in my opinion, always a good sign. An example of another excellent company that doesn't make any adjustments to earnings is Costco Wholesale, one of the best businesses I know. I will focus on revenue, EBIT (= Operating Profit) and net earnings because free cash flow ( FCF ) is a bit volatile. Here is a chart showing those three metrics:
Earnings Metrics since FY14 (Company reports - Compiled by Author)
These are the charts we want to see. Except for EBIT dropping 0.8% in FY21 due to the pandemic, Dollarama managed to increase every number every year over the past decade. The 10-year CAGRs from FY14-FY23 were: Revenue 10.5%, EBIT 12.4%, Net Earnings 13.8%. Again, impressive numbers. This shows the efficiency of Dollarama's business model.
So how does Dollarama generate such consistent growth? The answer is simple and I like to repeat it again and again. A company needs to generate strong returns on capital while having plenty of opportunities to reinvest at these rates of return. I always use return on capital employed (ROCE) to calculate returns on capital. Here is a chart showing Dollarama's ROCE over the past few years:
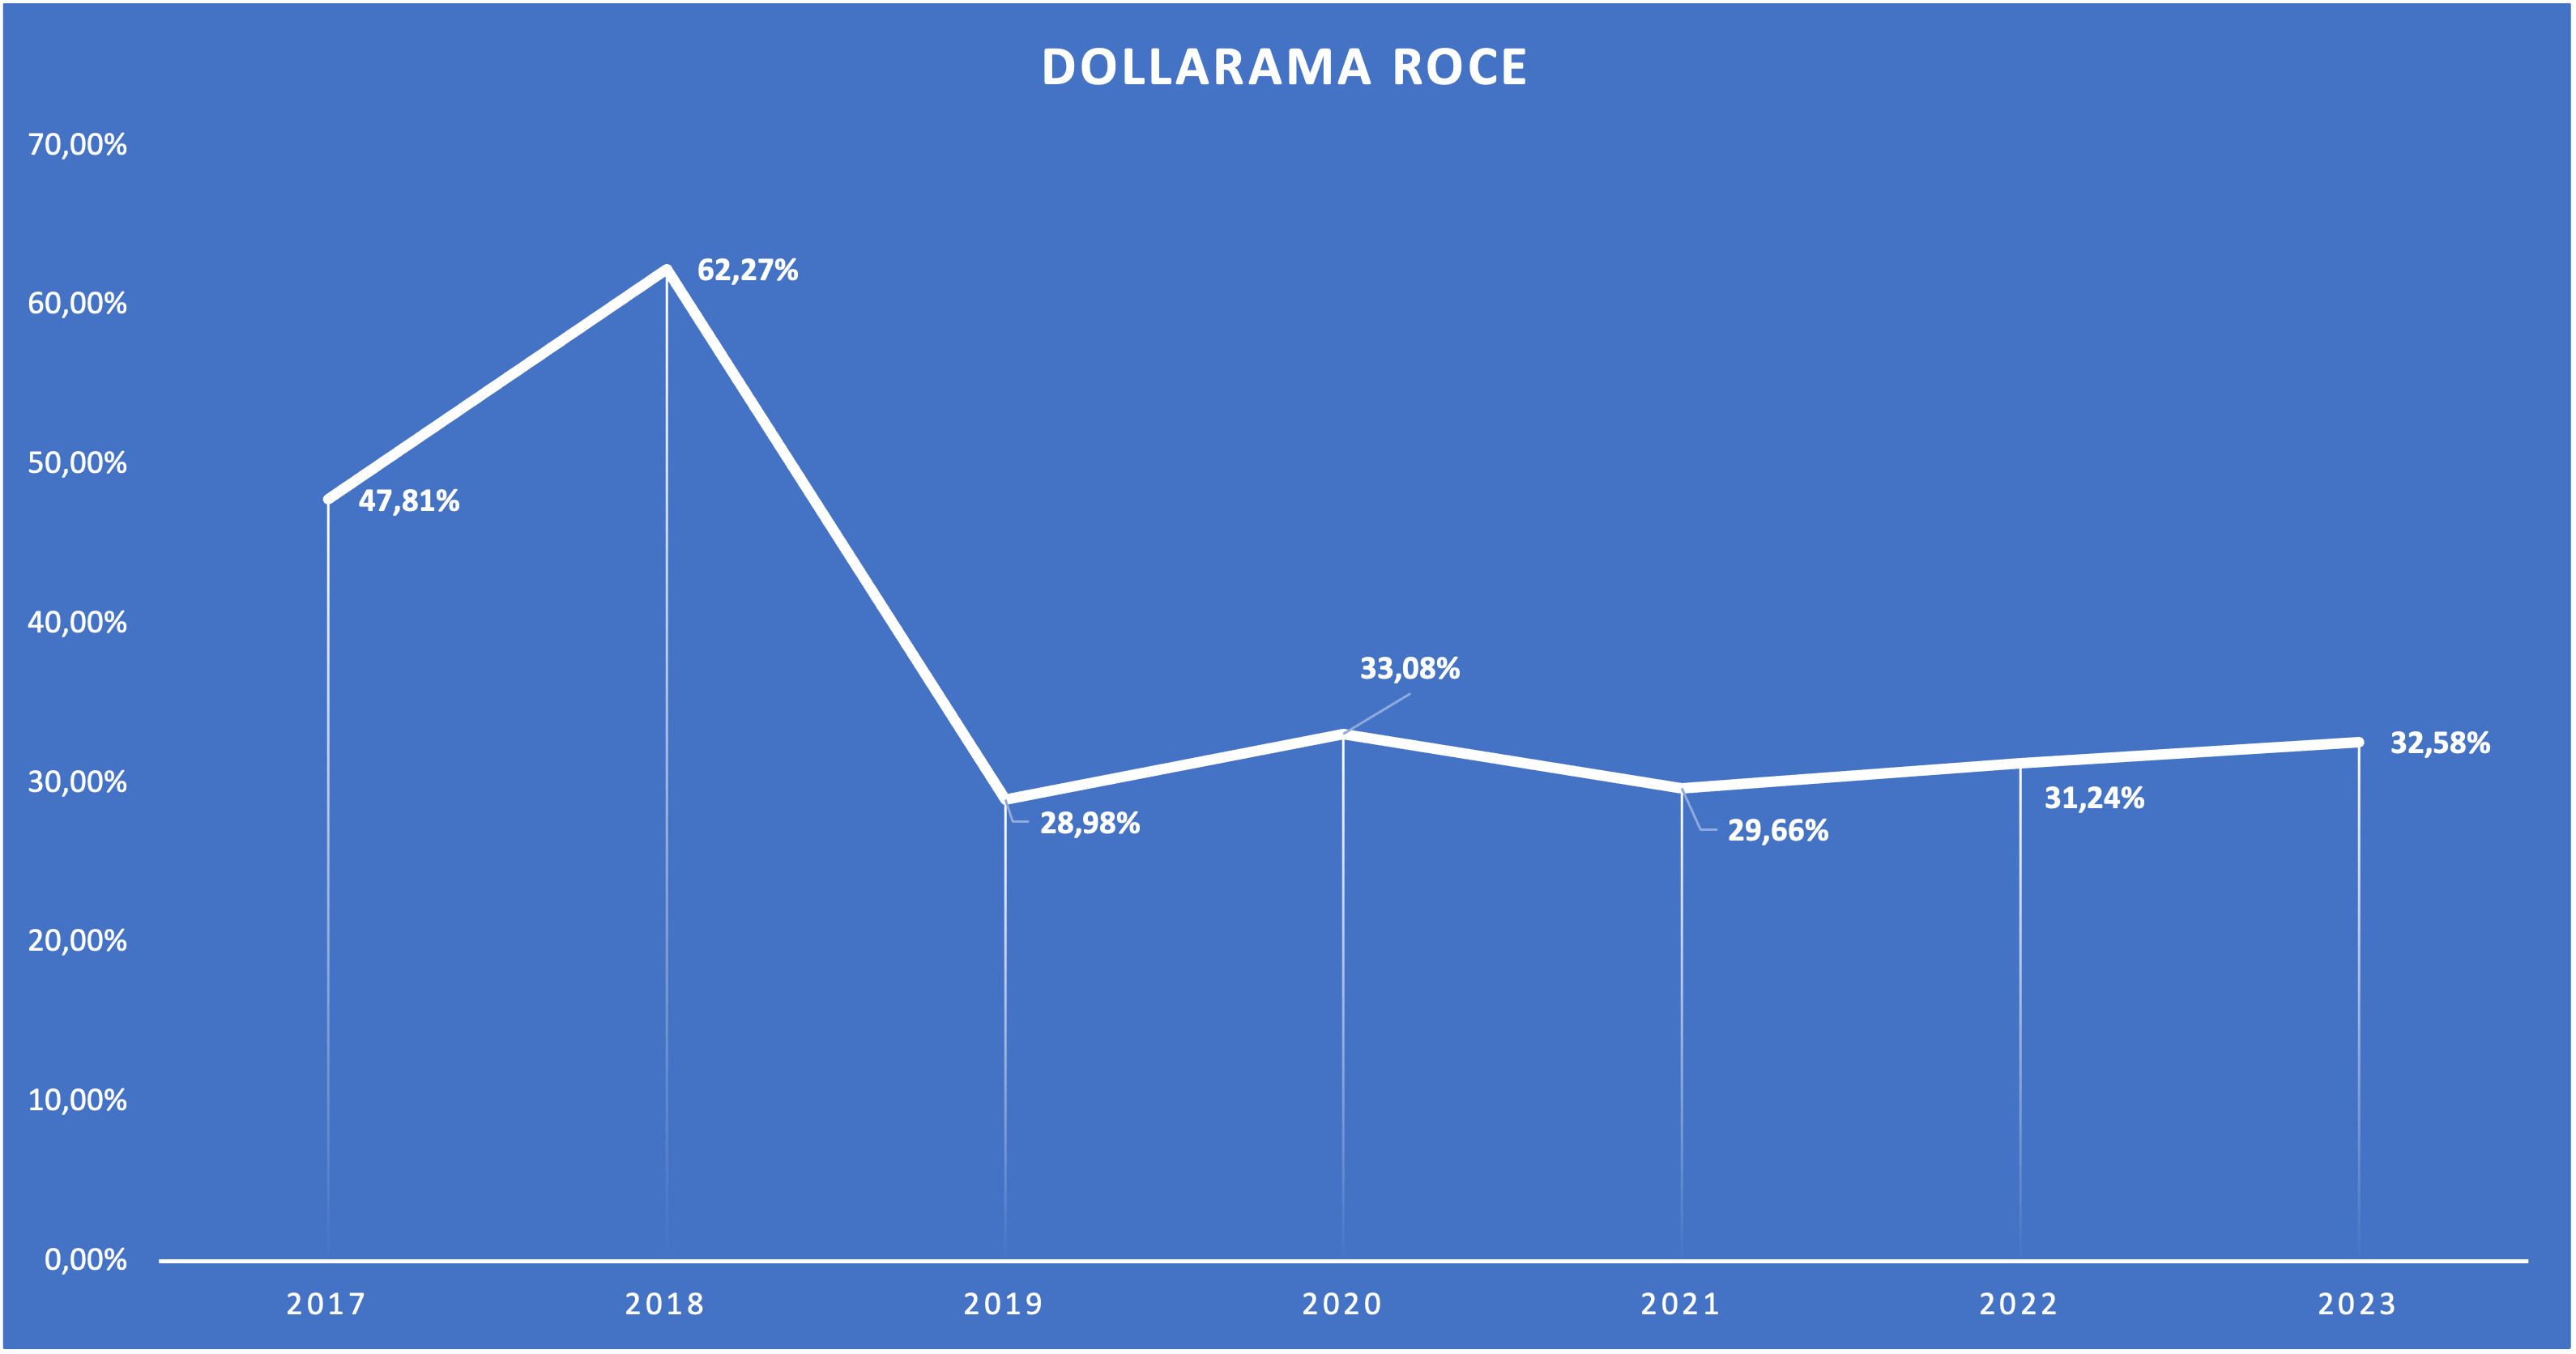
Dollarama ROCE since FY17 (Company reports - Calculations by Author)
I calculate ROCE like this: Operating Profit / Capital Employed where Capital Employed = Shareholders' Equity + Long-term Liabilities - net cash if there is any. This usually yields some reasonable results. We can see that Dollarama has been able to generate returns on capital of around 30% in the past few years, a very good number. Dollarama has grown its capital employed from $1.35 billion in FY17 to $3.65 billion in FY23. This shows again that Dollarama had very good reinvestment opportunities in the past.
High returns on capital coupled with high reinvestment rates should have led to significant total returns, and they did:
Dollarama significantly outperformed the S&P 500 and its U.S. peers Dollar General and Dollar Tree over the past decade.
Another topic that I want to address is Dollarama's margin profile compared to its peers. Here is a chart from Seeking Alpha showing the gross profit margin for Dollarama, Dollar General and Dollar Tree:
Gross Profit Margin Comparison (Seeking Alpha Charting)
Here we can see that Dollarama's gross margins are way higher. Why is that? According to Dollarama, the main differentiator is the product mix. On slide 38 of the most recent Q3 24 Earnings presentation , Dollarama states that Dollar General for example sells 82% Consumables while Dollarama only sells 44%. In the " FY23 Management's Discussion and Analysis ", Dollarama attributes a decline in the gross margin to a change in sales mix with stronger sales of consumable products and higher logistic costs. This indicates that Consumable sales simply have lower margins than the other two categories (General Merchandise and Seasonal). I decided to double-check this. Here is a screenshot from Dollar General's most recent 10-K Filing:
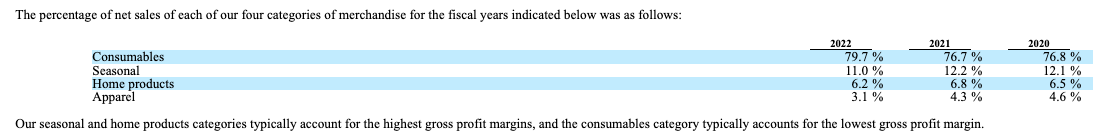
Dollar General on Sales Mix (Dollar General FY22 10-K Filing)
Here we can see that Dollar General tells us the same. Seasonal and home products account for the highest, and consumables for the lowest gross margins. It also states that the share of Consumable sales is close to 80%, in line with what Dollarama told us. In conclusion, the higher margins are simply a result of Dollarama having the best sales mix out of these three.
Lastly, I want to talk a bit about Dollarama's shareholder return policy. Dollarama currently pays a dividend of $0.0708 per quarter (=$0.2832 per year) for a dividend yield of only 0.3%. So Dollarama is not a high-yield stock. Instead, Dollarama allocates the remaining free cash flow after reinvestments toward share repurchases:
Dollarama consistently repurchased shares throughout the past decade, reducing the number of outstanding shares by nearly one-third. In other words: The equity interest of a shareholder who bought 10 years ago is now 50% higher than it was back when he/she purchased the first shares. This comes on top of the already outstanding operational performance of the business.
Valuation
Quick reminder: All numbers are in Canadian Dollars unless stated otherwise. For this valuation section, I will add the U.S. Dollar amounts when needed.
Dollarama currently trades at $94.49 (US$72.03) per share. With 283,595,000 shares outstanding at the end of Q3 24, the market cap amounts to $26.8 billion (US$20.4 billion). TTM net earnings stand at $948 million and TTM free cash flow ( FCF ) at $1,259 million, so Dollarama currently trades at 28x earnings and an FCF yield of 4.7%. Due to the nature of the business (changes in inventory and working capital), FCF is a bit volatile. The cumulative FCF for FY17-FY23 amounted to $4.32 billion while the cumulative net earnings amounted to $4.1 billion. So over the longer term, Dollarama's cash conversion (FCF as a % of net earnings) hovers around 105%.
So in a "normal year", Dollarama's normalized FCF yield would be something around 3.7%, a rather high valuation.
Now we need to make some assumptions about Dollarama's future growth rates. Throughout this article, I assumed the following:
- 1% Traffic growth
- 3.5-4% Pricing growth
- 3.2% Store growth
So the range is 7.7%-8.2%. This seems conservative because (a) Dollarama has a history of outpacing their own store growth targets and (b) this doesn't account for the higher growth rates (store growth and earnings growth) that should come into play due to the higher growth rates at Dollarcity (Remember: Dollarcity targets to grow stores at over 9% CAGR until 2029). This also discards any possibility of margin expansion which we have seen a lot of at Dollarama (between FY14 and FY23, operating margins increased 641 basis points and net margins increased 376 basis points) and should see a lot at Dollarcity.
I think that the long-term return potential for any stock, disregarding valuation changes, is the sum of the FCF yield (what the company can pay out to us) and the FCF growth rate. So in the case of Dollarama (according to my assumptions) 3.7%+8% = 11.7%.
To gauge the possible effects of valuation changes, I will perform a supplemental DCF calculation. We know that the normalized FCF yield is 3.7%, so the normalized FCF per share should be $3.51 (US$2.65). I will assume 8% FCF growth for the next decade (580 basis points lower than what we have seen over the past decade), 6% growth into perpetuity (due to Dollarama's high returns on capital indicating a wide moat and much runway for reinvestment opportunities due to the entry in the LATAM market) and a 10% discount rate. Here is the result:
DCF Calculation (moneychimp.com)
According to my assumptions, Dollarama should be worth $109.20 (US$83.38) per share.
Some of you may say that my assumed perpetual growth rate is too high because it is higher than the GDP growth rate of 2-3%, a valid argument. So let me talk a bit about why I think setting perpetual growth rates at 2-3%, in line with GDP growth, is a mistake. If you have been following me for some time you might have noticed that I used various numbers for perpetual growth rates in the past. The rate I use mainly depends on the quality/moat of the business and the outlook for reinvestment opportunities. Enbridge Inc. was assigned a 2% perpetual growth rate (in line with inflation targets) while Costco was assigned a 6% perpetual growth rate (due to Costco's quality and the fact that it can grow the number of warehouses by around 3% per year as long as we can see).
Assuming perpetual growth rates can't be higher than GDP growth, every company that is trading at a price above 20x free cash flow would be overvalued (assuming 8% growth for a decade, 10% discount rate and 2.5% perpetual growth - this would lead to a fair value at around 20x free cash flow). A lot of companies are trading higher (in some cases a lot higher) because the growth outlook (at least for as long as we can see) isn't limited to GDP growth. Historical inflation is around 2-3%. The inflation target in the U.S. is 2%. This only refers to Pricing and doesn't take into account other ways to create growth. In the case of Dollarama, other ways to create growth are (a) growing the store count and (b) increasing traffic. A 2-3% perpetual growth rate would assume that neither Dollarama nor Dollarcity will open any new stores after the first forecasted decade (very pessimistic) and the traffic at existing stores will be flat forever (which shouldn't be true because of population growth). Thus, a 2% perpetual growth rate would only apply to a company like Dollarama if it has zero room to open new stores, the population growth in the areas where Dollarama's stores are located is zero and the traffic of existing stores remains flat forever.
I would argue that most investors set the perpetual growth rate assumptions for high-quality businesses too low. This is also the reason why the best companies in the world like Costco Wholesale or Hermès trade at very high multiples. High-quality, predictable businesses can grow at mid-single digits for as long as we can see. Dollarama seems like one of these businesses. Pricing growth a bit above the rate of inflation (as they did in the past), 1% same-store Traffic growth and 1-2% store count growth is all Dollarama needs to grow 6% per year for a very long time.
Risks
Risks to my bullish thesis include:
(1) Stagnant or declining same-store traffic.
As I have shown earlier, Dollarama's same-store traffic growth in Canada fluctuated from 0% to 1.9% before the pandemic. I concluded that Dollarama should be able to grow same-store traffic at around 1% per year going forward. This might be too optimistic. Additionally, we don't know anything about the same-store traffic growth numbers at Dollarcity.
(2) Pricing growth only in line with GDP growth
I highlighted that Dollarama was able to grow average transaction size at 4-5% (well above GDP growth of 2-3%) before the pandemic. I partly recognized that this isn't set in stone by calculating 3.5-4% going forward. However, pricing growth might as well come down to the range of 2-3%. This would mean (a) lower longer-term total return potential and (b) a lower valuation multiple, ultimately making Dollarama overvalued at the current price.
Regarding (1) and (2), both metrics should be monitored over the next few years.
(3) Dollarcity and the risks coming with it
I highlighted Dollarcity as the major growth driver going forward without really discussing the risks that come with it. First of all, operations in LATAM have a much higher geographical/political risk than operations in the U.S. or Canada. The same is true for currency risks that come along with doing business in LATAM.
As for the operational structure and governance of Dollarcity: The board of directors consists of 3 Dollarama and 2 Dollarcity (founding group) representatives. So far, so good. However, certain decisions are subject to 100% stockholder approval, so Dollarama does not have unlimited control. These decisions include M&A activities, capital structure, appointments of executives, approval of annual budget/business plan and entry into new countries. While I don't think that Dollarama will face a dispute with the Dollarcity founding group, it can't be ruled out.
Conclusion
Dollarama is the leading dollar store operator in Canada. In 2019, it also expanded into LATAM with a 50.1% investment in Dollarcity. The LATAM operations should be the major growth driver going forward but the Dollarama operations in Canada should also see growth rates in the high single-digits well into the future.
Dollarama has better margins than its U.S. peers Dollar General and Dollar Tree because the sales mix is less reliant on Consumables which produce the lowest profit margins.
The balance sheet isn't strong but sufficient. Every relevant earnings metric has been in a clear upward trend over the past decade and Dollarama generates returns on capital of around 30%, far above the company's cost of capital, creating value for shareholders in the process. This also shows in the total returns the stock delivered throughout the past decade, far outpacing the broader market.
I assume that Dollarama can grow its store count in Canada at 3.2% CAGR (in line with management's expectations), same-store traffic by around 1% per year and prices by 3.5-4% for a total growth rate of 8%. This disregards the faster growth rates at Dollarcity and any possibility of margin expansion. A simple DCF calculation leaves me to assume that Dollarama is undervalued with a fair value of around $109.20 (US$83.38) per share.
Summing it all up, I initiate coverage on Dollarama with a "buy" rating and a price target of $109.20 (US$83.38) per share.
For further details see:
Dollarama: My Top Brick And Mortar Pick