INPAP - DON ETF: Attractive Valuation Average Performance
2023-06-13 18:49:09 ET
Summary
- WisdomTree U.S. MidCap Dividend Fund ETF holds over 300 stocks weighted on total dividends.
- The heaviest sectors are financials and industrials, and it is well-diversified across holdings.
- The DON ETF looks better than a mid-cap benchmark regarding valuation and quality, but historical performance is average.
This article series aims at evaluating ETFs (exchange-traded funds) regarding past performance and portfolio metrics. Reviews with updated data are posted when necessary.
DON strategy and portfolio
WisdomTree U.S. MidCap Dividend Fund ETF ( DON ) started investing operations on 06/16/2006 and tracks the WisdomTree U.S. MidCap Dividend Index. It has a portfolio of 345 stocks, a 12-month distribution yield of 2.97% and an expense ratio of 0.38%. Distributions are paid monthly.
As described in the prospectus by WisdomTree , the underlying index selects companies in the top 75% of the market capitalization of the WisdomTree U.S. Dividend Index after the 300 largest companies have been removed. They are rebalanced annually based on paid dividends (not yields).
The fund invests exclusively in U.S. companies, about 56% mid-caps and 44% small-caps (in Fidelity classification). The heaviest sectors are financials (22.7% of asset value), industrials (17%) and consumer discretionary (11.5%). Other sectors are below 10%. Compared to the SPDR® S&P MIDCAP 400 ETF Trust ( MDY ), DON overweights mostly financials, utilities and energy. It underweights significantly technology, industrials, consumer discretionary, and healthcare.
Sector breakdown (chart: author, data: WisdomTree, SSGA)
The portfolio is well-diversified: the top 10 holdings represent only 9.1% of assets. The largest position weighs 1.12%, so risks related to individual companies are very low.
| Ticker |
| Name |
| Weight% |
| EPS growth %ttm |
| P/E ttm |
| P/E fwd |
| Yield % |
| Chesapeake Energy Corp. |
| 1.12% |
| 2323.40 |
| 1.64 |
| 15.78 |
| 10.07 |
| Packaging Corporation of America |
| 1.02% |
| 6.40 |
| 12.56 |
| 16.03 |
| 3.82 |
| Watsco, Inc. |
| 0.95% |
| 24.95 |
| 23.70 |
| 24.90 |
| 2.74 |
| Snap-On, Inc. |
| 0.89% |
| 12.80 |
| 15.34 |
| 15.05 |
| 2.42 |
| Evergy, Inc. |
| 0.88% |
| -4.85 |
| 17.74 |
| 16.35 |
| 4.12 |
| Franklin Resources, Inc. |
| 0.87% |
| -55.42 |
| 15.90 |
| 11.27 |
| 4.55 |
| International Paper Co. |
| 0.86% |
| 9.96 |
| 6.28 |
| 13.35 |
| 5.90 |
| Interpublic Group of Cos., Inc. |
| 0.85% |
| -9.95 |
| 17.34 |
| 13.63 |
| 3.11 |
| Ares Management Corp. |
| 0.84% |
| -47.13 |
| 85.98 |
| 24.66 |
| 3.31 |
| Paramount Global |
| 0.81% |
| -112.67 |
| N/A |
| 24.94 |
| 1.21 |
Ratios from Portfolio123.
Past performance
Since 7/1/2006, DON has underperformed the benchmark S&P Midcap 400 ((MDY)) ( IJH ) by 63% (see next table). However, the difference in annualized return is not really significant: only 37 bps.
| Since 7/1/2006 |
| Total Return |
| Annual Return |
| Drawdown |
| Sharpe ratio |
| Volatility |
| DON |
| 287.60% |
| 8.32% |
| -61.94% |
| 0.45 |
| 18.77% |
| MDY |
| 310.51% |
| 8.69% |
| -55.33% |
| 0.48 |
| 18.56% |
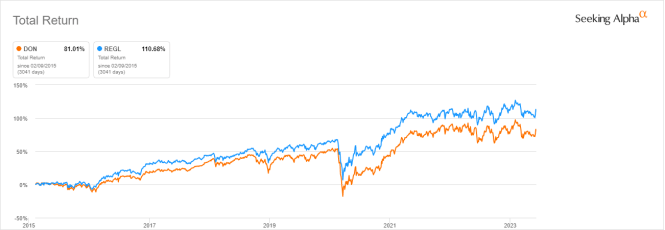
The next chart compares the total returns of DON and one of its closest competitors, ProShares S&P MidCap 400 Dividend Aristocrats ETF ( REGL ), recently reviewed here . The chart starts on 02/09/2015 to match inception dates.
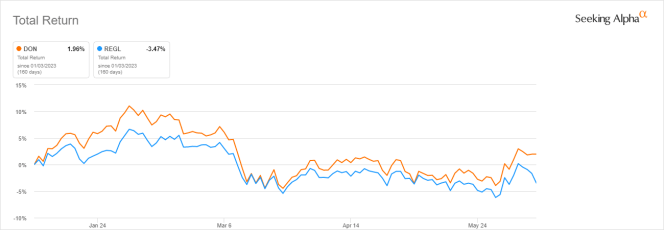
DON has lagged REGL by almost 40%. However, it has been outperforming in 2023 to date:
In previous articles, I have shown how three factors may help cut the risk in a dividend portfolio: Return on Assets , Piotroski F-score , and Altman Z-score .
The next table compares DON with a subset of the S&P 500 (SP500): stocks with an above-average dividend yield, an above-average ROA, a good Altman Z-score, a good Piotroski F-score and a sustainable payout ratio. The subset is rebalanced annually to make it comparable to a passive index.
| Total Return |
| Annual Return |
| Drawdown |
| Sharpe ratio |
| Volatility |
| DON |
| 287.60% |
| 8.32% |
| -61.94% |
| 0.45 |
| 18.77% |
| Reference subset |
| 483.85% |
| 10.97% |
| -43.40% |
| 0.67 |
| 15.57% |
P ast performance is not a guarantee of future returns. Data Source: Portfolio123.
The dividend quality subset outperforms DON by 2.7 percentage points in annualized return and shows a lower risk measured in drawdown and volatility. However, the fund's performance is real, and this subset is simulated. My core portfolio holds 14 stocks selected in this subset (more info at the end of this post).
Distributions have been quarterly until 2012, then monthly. Their annual sum has increased by about 110% between 2007 and 2022 (see next chart). The cumulative inflation has been about 41% in the same time, based on CPI. The annualized dividend growth rate since 2007 is 4.8%.
Distribution history (chart: author; data: WisdomTree)
Valuation and quality
DON is significantly cheaper than MDY regarding the usual valuation ratios, as reported in the next table.
| DON |
| MDY |
| Price/Earnings TTM |
| 9.87 |
| 13.7 |
| Price/Book |
| 1.73 |
| 2.14 |
| Price/Sales |
| 1.07 |
| 1.14 |
| Price/Cash Flow |
| 7.65 |
| 9.96 |
I have scanned holdings with the quality metrics described in the previous paragraph. I consider that risky stocks are companies with at least 2 red flags among: bad Piotroski score, negative ROA, unsustainable payout ratio, bad or dubious Altman Z-score, excluding financials and real estate where these metrics are less relevant. With these assumptions, 33 stocks out of 345 are risky, and they weigh about 12.4% of asset value. This number is not very good, yet still acceptable.
Based on my calculation, DON is superior to the mid-cap benchmark regarding the aggregate return on assets, as reported in the next table. The Piotroski F-score and Altman Z-score are not significantly different. These metrics point to a portfolio quality slightly superior to the mid-cap benchmark.
| DON |
| MDY |
| Altman Z-score |
| 2.83 |
| 3.08 |
| Piotroski F-score |
| 5.61 |
| 5.65 |
| ROA % TTM |
| 7.42 |
| 5.48 |
Takeaway
WisdomTree U.S. MidCap Dividend Fund ETF holds over 300 stocks weighted based on paid dividends. It is well-diversified across holdings. The heaviest sectors are financials and industrials. DON is superior to the benchmark S&P 400 mid-cap index regarding valuation and quality metrics, and it is close behind it in total return since inception. Distributions have outpaced inflation since 2007, but the annualized growth rate is below 5%.
As a conclusion, WisdomTree U.S. MidCap Dividend Fund ETF is not a bad product, but it is just an average mid-cap fund. DON may be used as a long-term investment, or in a tactical allocation strategy, switching between market cap segments.
For further details see:
DON ETF: Attractive Valuation, Average Performance