TJX - Donville Kent Asset Management July 2023 Insights
2023-08-10 10:05:00 ET
Summary
- Donville Kent Asset Management Inc. is a highly specialized asset management firm that manages investments on behalf of individual investors as well as select institutions.
- Small-cap stocks have been overlooked in the market, leading to underperformance, but there has been a recent increase in interest.
- Inflation is falling, with the CPI being influenced by goods deflation and service inflation.
- The stock market reacts differently to inflationary and deflationary environments, and the market is starting to anticipate the actions of the Federal Reserve.
Human Nature
So far in 2023, almost all of the stock market return has been due to a handful of the world's largest stocks. There is a lot more going on under the surface and if we summed up our current small-cap investment landscape in a single sentence it would be:
Record revenues and record profits with historically cheap valuations.
This has been the case since the market bottomed late last year and we have highlighted this point ad nauseam.
So, what has changed?
As a proxy for interest in small cap stocks, one can look at the Toronto Venture Exchange (TSXV) which is composed of Canada's smallest public companies. The last 14 months have seen the volume on the small cap index down roughly 70% versus the last 15-year average. This supports the view that people haven't cared about small caps for the last 2 years. The lack of attention on small caps has led to underperformance across the asset class.
BUT, the last 4-5 weeks have been markedly different from the last two years. The number of inbound calls from other investors and portfolio managers has ratcheted up considerably. These valuations are just too cheap to ignore, and these calls and meetings are about digging into the details of these businesses and truly seeing how cheap they are. With a slight turn in sentiment, we're starting to see articles like Small Caps Are Starting to Work - and we're Likely Still Early by Mauldin Economics. 1
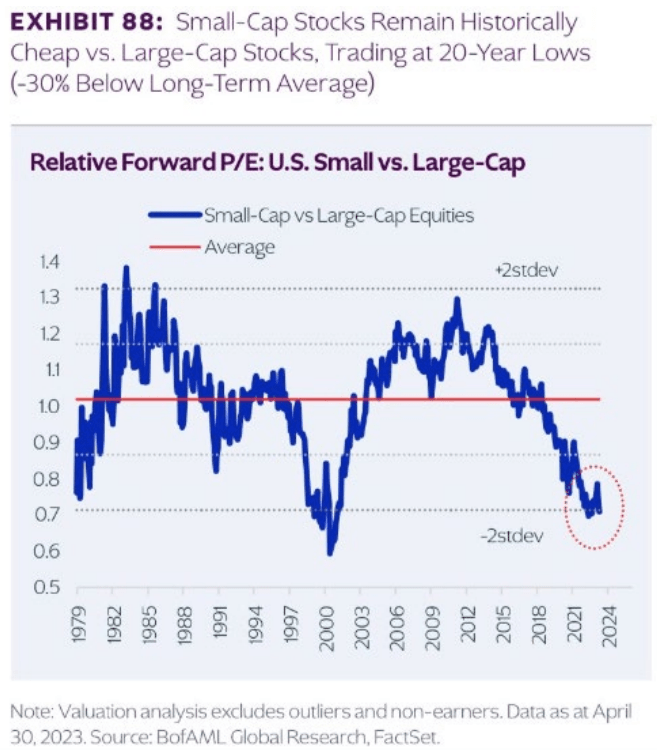
In our November 2022 newsletter, we compared specific stock valuations from 2008/2009 to what we are seeing now. Please revisit that newsletter to understand why we believe we're in a an even more attractive investment situation now than back then. 2 In that newsletter, we used the often repeated phrase "history doesn't repeat itself, but it rhymes." A more accurate saying would be "history doesn't repeat itself, but human nature does." The human nature aspect is why we continually have stock market booms and busts, countries fighting wars, and importantly, growth and innovation. The underlying performance of companies day to day does not have the volatility of the stock market and this is where an investor can be opportunistic and see when the psychological pendulum has swung too far in one direction. The chart below goes back almost 50 years and illustrates the point we have been making recently, that small cap stocks are the cheapest they have been in a very long time. This chart compares small-caps stocks to large-cap stocks and with human nature as a guide, it suggests an upcoming strong rebound and multi-year run for small cap stocks.
Inflation
Chart: headline US inflation is falling fast
We've covered the underlying dynamics of inflation in detail in past notes and newsletters. In this edition, we are highlighting a few updated charts plus a few examples of the delayed nature of data used in the CPI calculation. The first being how fast CPI is falling and how PPI (red line) leads the way and signals a continual fall in CPI.
The main pushback to headline CPI falling so much is the difference in goods deflation and service inflation. On July 6th, the US ISM Services Prices index dropped to the lowest level since March 2020.
Tracking inflation is important because it leads the direction of interest rates which are the base inputs for valuing assets.
One of the most used inflation anecdotes has been the price of eggs. We'reincluding the price of eggs to the right, but the same price jump and decline is true for shipping costs, lumber, coffee beans, etc.
Figure 3 - Historical Price of Eggs4
The last domino to fall or slow down is real estate. Both prices paid, and rents paid have stayed elevated longer than most other components of CPI. The Fed is using real estate data that shows ~+8% inflation year over year right now but all real-time rent and housing data out of the States show a much faster slowdown. 5 These 3 charts by Alpine Macro illustrate how the Case Shiller Home Price index (blue line), leads the CPI real estate number (red line). This suggests that housing, the last major component, is about to rollover as well.
Chart 4: Housing components of CPI are about to head lower.
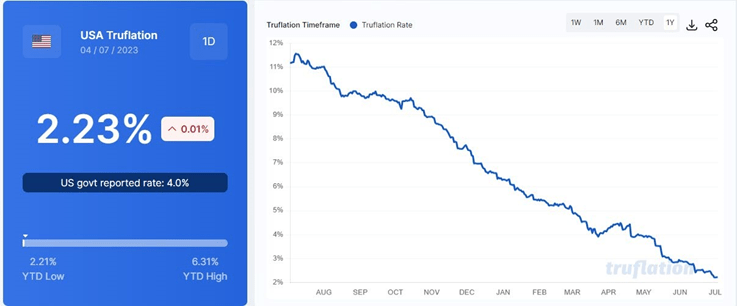
For this reason, we believe reported headline inflation will follow the trend of Truflation but just in a delayed manner. 6
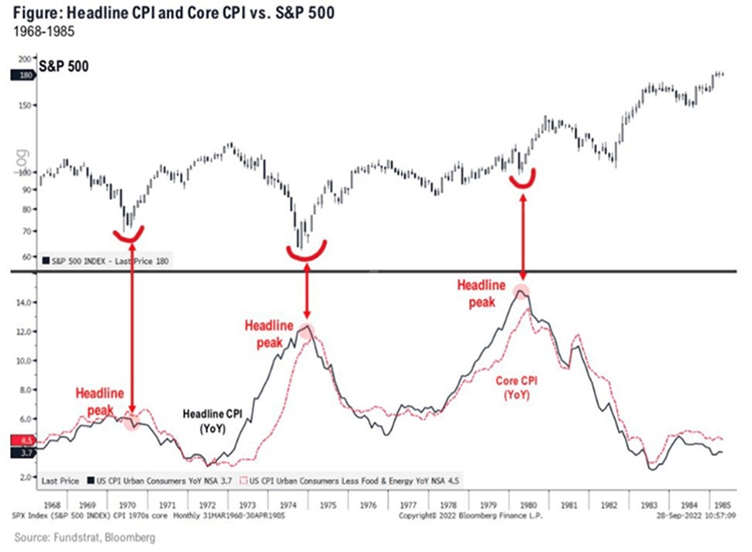
The final important aspect to distinguish regarding inflation, is the type of environment you're in dictates the stock market's reaction. As shown in the graph below, the stock market bottoms when inflation peaks in inflationary environments (60's, 70's, 80's examples). This is different when compared to recent deflationary periods, where interest rates need to peak and rollover for the market to recover. The Fed has a history of being wrong. They are too slow to raise rates, then too slow to pause and lower because they follow outdated sources plus the added political pressure. We believe the market is starting to front-run what the Fed will be doing 6-12 months from now.
The main risk we see in Canada right now is housing supply and affordability. With off the charts population growth combined with politically constrained housing development, the major cities in Canada have become unaffordable. This is different than the market in the US, and something this nation will have to address, ideally with lowering the regulatory red tape. That doesn't mean prices decline, because again the demand is so high, but it leads to millions of people being "house poor", owning or renting a house and not having much, if any, disposable income left over.
Specific Stock Commentary
Reitmans ( RET:CA )
- Reitmans is undergoing a significant change that hasn't yet been recognized by the market.
- Investors are slow to recognize inflection points and the combination of Covid, bankruptcy restructuring, and the death of the CEO, has resulted in new management, new culture, and a new outlook.
- This major turning point has set the company to focus on profitability. Their bonuses are now tied to operating profit and all indications appear for them to be very profitable in their seasonally strongest Q2 & Q3 earnings. They improved margin dollars delivered in the quarter, SG&A as a percent of sales is heading in the right direction and foreign exchange appears to be going from a headwind to tailwind.
- With further research we have lowered our estimated value of their head office to $30m but have kept the value of the distribution center and adjoining land. Our initial estimate was strictly based on price per square foot but the actual building is older and less comparable to market rates.
- •This isn't our base case but for illustrative purposes, if Reitmans traded on the average multiple of the 9 comparable companies below (11.7x earnings) the stock would be $15.00/share (which is a 400% return).
| Retailer |
| Q1 Sales Growth |
| LTM Sales Growth |
| Retailer |
| NTM Valuation |
| Reitmans ( RET:CA ) |
| 7.30% |
| 16.90% |
| Reitmans |
| 2.2x |
| TJX (Winners) |
| 3.30% |
| 0.90% |
| TJX (Winners) |
| 22.8x |
| Abercrombie ( ANF ) |
| 2.90% |
| -0.60% |
| Abercrombie |
| 17.0x |
| American Eagle ( AEO ) |
| 2.50% |
| -0.30% |
| American Eagle |
| 11.7x |
| Dillard's ( DDS ) |
| -1.80% |
| 0.80% |
| Dillard's |
| 10.2x |
| Roots ( RROTF ) |
| -3.70% |
| 1.40% |
| Roots |
| 14.1x |
| Guess ( GES ) |
| -4.00% |
| -0.10% |
| Guess |
| 7.5x |
| The Gap ( GPS ) |
| -5.80% |
| -4.60% |
| The Gap |
| 16.3x |
| Macy's ( M ) |
| -7.00% |
| -4.00% |
| Macy's |
| 4.9x |
| Nordstrom ( JWN ) |
| -10.90% |
| -1.40% |
| Nordstrom |
| 10.4x |
| Average |
| -1.72% |
| 0.90% |
| Average |
| 11.7x |
- We're not saying that it is currently worth that much but the margin of safety is considerable, especially considering we're not factoring in cash and land value.
- We continue to add to our investment in Reitmans while hedging the retail consumer exposure by shorting more expensive competitors with stretched balance sheets.
- Management seems to be on board to uplist to the TSX and their next two quarters are their seasonally most profitable which should show the ability to be consistently profitable each year. These should be the catalysts needed to rerate the stock much higher.
Tucows ( TCX )
- We published our report on Tucows in our April newsletter and the stock is up ~75% off the bottom that month. 7 That being said, it is currently trading around $40/share and we strongly believe it is worth $100/share.
- The stock actually declined ~14% in June and has since recovered most of that decline. The reason for the temporary downturn seems to be the US Government announcing their $42.5B BEAD program.
- "The federal government has allocated nearly $42.5 billion to expand broadband connectivity across the United States, a move that could spell a windfall for broadband equipment and service providers."
- Tucows will be able to participate in these funding programs and it appears like the stock sold off on the headline of this program with people not understanding the full extent of what it meant.
- We recommend reading the article posted by SDX Central, which can be found in the footnotes. 8
Sangoma ( SANG )
- We recently had a call with Sangoma's Chairman and Interim CEO.
- In their most recent quarter, they reported 18% revenue growth with service revenue growing 37% and EBITDA margins of 19.4%. Their SaaS revenue grew 10% organically and now represents 81% of revenue.
- They are well along the path of bringing on a new CEO who should be able to improve communication to the market plus have the experience of running a business at a much more significant scale than where Sangoma is now.
- Their team and market data confirm that growth and margins should remain strong. They don't see erosion from a margin perspective going forward and they aim for 10% organic growth but most likely can do better than that.
- The stock is currently trading on 3x EBITDA, roughly 4x cash earnings, and seems to have bottomed around the $5/share level. 9
Hammond Power ( HMDPF )
- Hammond Power is a new investment in the fund. They design and manufacture transformers (enables electrification) and they have been in business for over 100 years and now have 1,400 employees in 21 global locations.
- Sales have currently hit an inflection point because the electrical grid worldwide is not even close to being able to handle the demand that new technology is demanding from the grid.
- Transformers are essential in all electrical grids and are used in generation; transmission; distribution; and within commercial, industrial and residential settings.
- Hammond has 25% market share in North America with a good backlog, strong free cashflow and high ROI expansion opportunities in Guelph, Ontario, and Mexico. 10
- The stock should re-rate higher as margins and free cash flow continue to expand.
Decisive Dividend ( DE:CA )
- Decisive Dividend is a new investment in the fund and the stock has been very strong as of late but still appears cheap and we believe it should trade well over $10/share.
- The company acquires small profitable industrial companies like wood burning stove businesses and varying metal & plastic fabrication shops.
- DE is currently the best stock we can find that balances both growth and yield.
- DE has a dividend yield of 6.9% with expected EPS growth of +40% this year and +30% in 2024. 9
- They increased their monthly dividend by 14% in June after increasing it by 17% just a few months before.
- We think they will continue to increase the dividend regularly as they have now shown a strong ability to buy and integrate. The stock should trade at a much higher multiple and we think it will close the gap as investors realize the company is a compounder versus an industrial yield play.
Closing Remarks
The last two years have been especially hard on small caps. From a timing perspective, inflation appears to have peaked and all major price indicators appear to have slowed and turned over in real time. With rates peaking and the decline of the last two years leaving small-cap stocks historically cheap, we believe the set-up from here for these cheap, profitable, growing businesses is the strongest we have found. The current setup is very similar to past bottoms that turned higher and started renewed multi year cycles higher.
Feel free to reach out questions or comments,
J.P. Donville & Jesse Gamble
| All estimates, projections, and calculations have been generated by DKAM. This does not constitute advice for personal investments but rather a breakdown of how Donville Kent approaches stock analysis. 1 Article can be found at XXX 2 November newsletter can be found at the following link 3 Chart from XXX 4 Prices per USDA Egg Market Report - Large Eggs Delivered to Store - Midwest US - Cents/Dozen 5 CPI data found at the following link 6 Our latest monthly commentary gives more insight on Truflation, and can be found at the following link . Additionally, more information can be found on their site at Independent, economic & financial data in real time on-chain . 7 April newsletter can be found at the following link . 8 Article can be found at the following link . 9 Per DKAM internal estimates 10 Per Hammond Power's May Q1 2023 Investor Presentations DISCLAIMER Readers are advised that the material herein should be used solely for informational purposes. Donville Kent Asset Management Inc. ((DKAM)) does not purport to tell or suggest which investment securities members or readers should buy or sell for themselves. Readers should always conduct their own research and due diligence and obtain professional advice before making any investment decision. DKAM will not be liable for any loss or damage caused by a reader's reliance on information obtained in any of our newsletters, presentations, special reports, email correspondence, or on our website. Our readers are solely responsible for their own investment decisions. The information contained herein does not constitute a representation by the publisher or a solicitation for the purchase or sale of securities. Our opinions and analyses are based on sources believed to be reliable and are written in good faith, but no representation or warranty, expressed or implied, is made as to their accuracy or completeness. All information contained in our newsletters, presentations or on our website should be independently verified with the companies mentioned. The editor and publisher are not responsible for errors or omissions. Past performance does not guarantee future results. Unit value and investment returns will fluctuate and there is no assurance that a fund can maintain a specific net asset value. The fund is available to investors eligible to invest under a prospectus exemption, such as accredited investors. Prospective investors should rely solely on the Fund's offering documentation, which outlines the risk factors in making a decision to invest. The S&P/TSX Composite Total Return Index, the S&P 500 Total Return Index, and the Russell 2000 Total Return Index ("the indexes") are similar to the DKAM Capital Ideas Fund LP ("the fund") in that all include publicly traded North American equities of various market capitalizations across several industries, and reflect both movements in the stock prices as well as reinvestment of dividend income. However, there are several differences between the fund and the indexes, as the fund can invest both long and short, can utilize leverage, can take concentrated positions in single equities, and may invest in companies that have smaller market capitalizations than those that are included in the indexes. In addition, the indexes do not include any fees or expenses whereas the fund data presented is net of all fees and expenses. The source of the indexes' data is Bloomberg. DKAM receives no compensation of any kind from any companies that are mentioned in our newsletters or on our website. Any opinions expressed are subject to change without notice. The DKAM Capital Ideas Fund, employees, writers, and other related parties may hold positions in the securities that are discussed in our newsletters, presentations or on our website. |
For further details see:
Donville Kent Asset Management July 2023 Insights