LTH - Donville Kent - Reitmans: Poised For A Massive Re-Rating In 2023
Summary
- Covid lockdowns proved to be a decisive moment for Reitmans.
- Reitmans strategically entered CCAA protection and restructured their business.
- We think the stock will see a massive re-rating in 2023.
The following segment was excerpted from this fund letter .
Reitmans ( RET:CA ): Executive Summary
| Company |
| REITMANS (CANADA) LTD-A |
| Ticker Voting Shares |
| RET CN |
| Ticker Non-Voting |
| RET/A CN |
| Stock Price 3 |
| $2.99 |
| Market Cap 3 |
| $146,112,330 |
| Enterprise Value |
| $79,031,330 |
| Yield |
| 0.0% |
| 2023E PE 1 |
| 1.9x |
| 2023E FCF Yield 1 |
| 45% |
| 52 Week High 3 |
| 3.03 |
| 52 Week Low 3 |
| 0.75 |
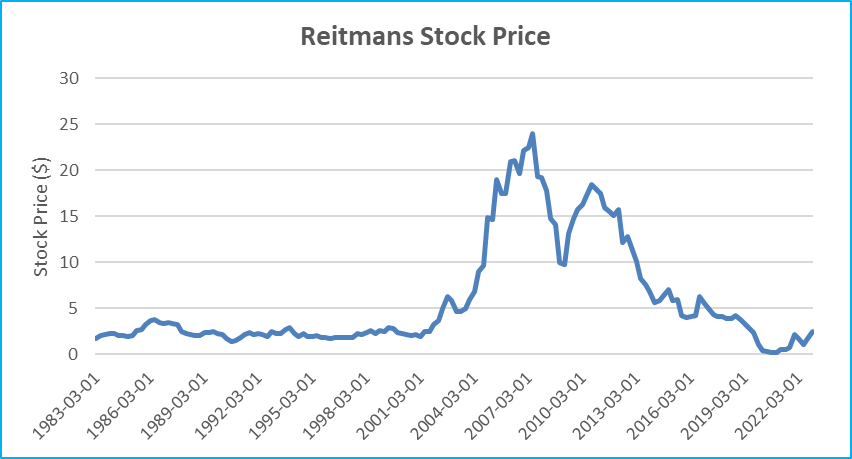
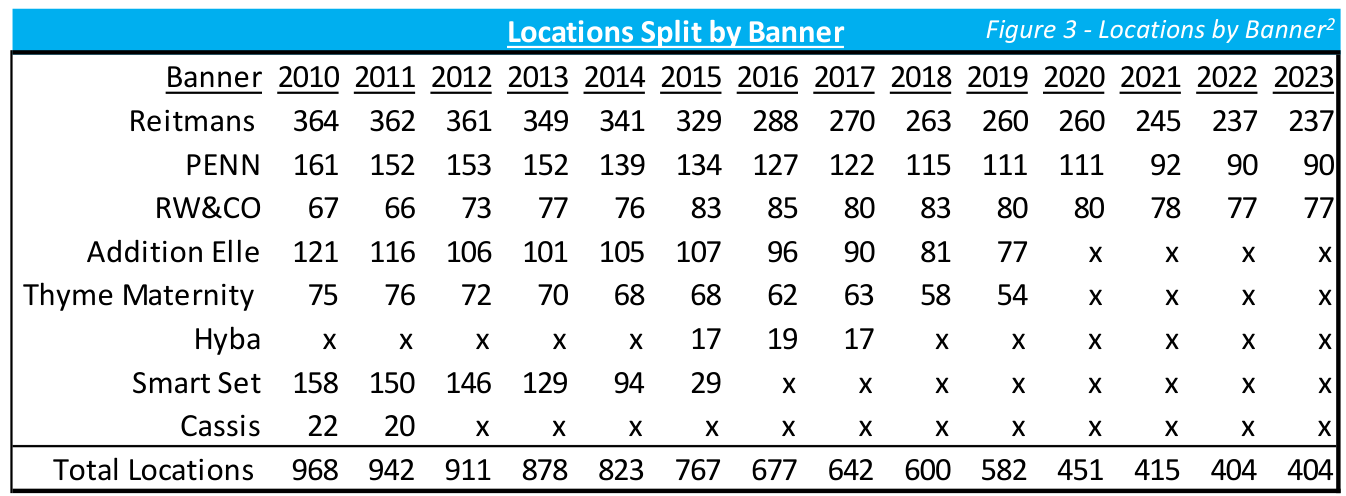
Covid lockdowns proved to be a decisive moment for Reitmans. Due to government forced store closures, Reitmans strategically entered CCAA protection and restructured their business. They exited this process in 2022 after closing over 30% of their stores, consolidating their banners from 5 to 3, laying off 1,600 employees, and paying 50 cents on the dollar to settle debt and liabilities. This process gave them cover, and a cheaper way to close unprofitable stores and renegotiate retail leases at an opportune time. We estimate they saved 10% on lease costs across their high-tier locations, and over 60% on their second-tier locations.
Now the business carries $68m of cash, no debt, has reported Net Income of ~$60m in the last 12 months, owns roughly $240m of real estate in Montreal 1 , all while trading at a $146m market cap. Add in a quickly growing e- commerce segment, now representing 25% of sales, positive online search trends, increasing revenue per square foot, and decreasing cost per square foot, we think the profitability is sustainable.
In past recessions, like 2001/2002 and 2008/2009, the business remained profitable, as they are a value brand, plus they are one of the few retailers with a growing customer base. We estimate their target market is growing 3.3% per year. We think the stock will see a massive re-rating in 2023 as it gets back onto investors’ radars and reinstates dividends & buybacks, plus gets a push to monetize real estate.
The Company
Reitmans is a publicly-owned, family-controlled business that operates women’s apparel retail stores under the Reitmans, Penningtons, and RW&Co names. Its stores are located in malls and retail power centers throughout Canada and offer affordable fashion to consumers. The company has marketed under the slogans “Affordable, stylish fashions designed to fit everybody and every body”, and “Inspired by role models, not supermodels”.
The Reitmans banner, operating stores averaging 4,700 sq. ft., is one of Canada’s largest women’s apparel specialty chains.
The Penningtons banner, is a leader in the Canadian plus-size market, offering trend-right style and affordable quality for plus-size fashion sizes 12-32. Penningtons operates stores averaging 6,000 sq. ft. in power centres across Canada.
The RW&CO banner operates stores averaging 4,500 sq. ft. in premium locations in major shopping malls, catering to a customer with an urban mindset by offering fashions for men and women.
Reitmans History
Summary of Reitmans History 1926 - 2022
- 1926 - The Reitman’s Dry Good General Store was opened in 1926 by Herman & Sarah on St. Lawrence Blvd in Montreal
- 1929 - Reitmans operated 4 stores in Montreal and restricted its offering to hosiery, lingerie & gloves
- 1936 – First store was opened in Ottawa
- 1939 – First store was opened in Toronto, bringing the total of the chain to 22
- 1941 - Herman ran the company until his death in 1941 and then his son Jack took over
- 1947 - Went public on the Montreal Stock exchange in April 1947
- 1958 – Opened first Western Canadian store in Calgary, Alberta
- 1959 – Opened first Eastern Canadian store in Halifax, Nova Scotia (total chain at 104 stores)
- 1960’s – Evolution of the shopping mall increased total store count to 222 by 1969
- 1965 – Moved main office to 250 Sauve Street West in Montreal (still own and operate in this office building)
- 1967 – Added an additional 4th floor (+40,000 sq. ft)
- 1972 – Added an additional 5th floor (+40,000 sq. ft)
- 1976 – Added an additional 140,000 sq. ft. (385,000 sq. ft total)
- 1970’s – store count grows to 589 by 1979
- 1980’s – Open sourcing office in South Korea
- 1992 – Close South Korea office and open Hong Kong sourcing office (100 employees in Hong Kong by 2006)
- 1995 - Acquired Penningtons banner
- 1996 - Jack Reitman passes away
- 1995 – Acquired 21% interest in NetStar Communications ( TSN ) ~$40m
- 1996 - Acquired Dalmys (Dalmys, Antels, Cactus)
- *Tax Loss Strategy – closed the stores over the next 4 years
- 1999 - Sold 17% Interest in NetStar Communications for ~$94m
- 2000 – Launched RW&Co (588 total combined stores)
- 2001 – Construction starts on new Distribution Centre in Montreal
- 2002 - Reitmans acquired publicly traded Shirmax for $85m
- Upon closing, the combined entity operated 800 retail stores under 7 banners
- Reitmans, Smart Set/Dalmys, Penningtons, RW&Co, Addition Elle, A/E Sports Co & Lingerie for Addition Elle
- 2003 – Opens new 566,000 sq. ft distribution facility
- 2005 – Open sourcing office in Shanghai, China
- 2006 – Acquire their Sauve Street office/facility for $8,169,000
- 2007 – Launched their e-commerce websites for Penningtons & Addition Elle
- 2008/2009 – Reitmans sales remained flat & maintained profitability during the recession
- 2019 – Chairman & CEO Jeremy Reitman passes away (Succeeded by COO & brother Stephen Reitman)
- 2020 – Temporarily Closes all 587 stores due to Covid restrictions & layoff 90% of retail employees
- 2020 – Announces intentions to restructure operations (Companies’ Creditors Arrangement Act)
- 2020 – Shares delisted from TSX (July) & relisted on TSV (September)
- 2021 – Reitmans announces the results of the CCAA Process
- 2020/2021 – Permanently reduces retail headcount by 1,100 and head office by 300 employees
- 2020/2021 – Full closures of 178 stores (leaving 404 total stores)
- 2022 – Rebrands Penningtons & announces the planned launch of RCL Market
Covid and CCAA Restructuring
As one might expect, Covid lockdowns were especially hard on retailers. For Reitmans, all retail locations were closed effective March 17, 2020. In connection with the store closures, the company laid off 90% of their retail workforce and 30% of head office employees starting March 29 th and 30 th . Reitmans stores span across the country and each province had varying Covid lockdown policies. As of fiscal Q4 2021, 58% of Reitmans stores were still closed, partial shutdowns continued into fiscal Q1 2022 and even through fiscal Q1 2023, there were still store capacity constraints in place. As of July 31, 2021, all stores were fully re-opened, and all restrictions were lifted at the end of fiscal Q1 2023.
With all the stores closed, China factory shutdowns limiting the supply of goods, and debt/lease liabilities on the balance sheet, Reitmans announced entering CCAA protection on May 19 th , 2020. During this process, they closed all Thyme Maternity & Addition Elle stores and laid off 1,600 employees (closed about 131 stores total). In 2020 those brands accounted for $164m in revenue, 49% gross margins and lost $1.1m (-1% net margins). During the CCAA process the stock was delisted July 29 th , 2020 and relisted on the Venture September 3 rd , 2020. In 2020, they also announced they would be promoting then President & COO Stephen Reitman to CEO (CEO Jeremy Reitman passed away December 28 th , 2019). In addition, they revamped the leadership team and appointed new board members.
The total liability claims were $195m with the largest creditors listed below. After negotiations, Reitmans settled the $195m in liabilities for a total cost of $95m. They emerged from bankruptcy proceedings on January 12 th , 2022.
| CCAA Proceedings - Sample List of Creditors |
| Landlords (Rent)) |
| $39,729k |
| Supplemental Executive Retirement Plan |
| $20,936k |
| Employees |
| $12,281k |
| Talentex Limited |
| $6,960k |
| Buttress International Trading |
| $5,229k |
| Postes Canada |
| $3,954k |
| Jiangsu Sainty Techowear |
| $3,797k |
| Tainan Enterprises |
| $3,395k |
| RCL Asia |
| $3,344k |
| Defined benefit pension plan |
| $3,225k |
| *Total Claims |
| $192,656,167 |
| *Over about ~1,700 claims CCAA Process had them pay $95m to cover the +$190m |
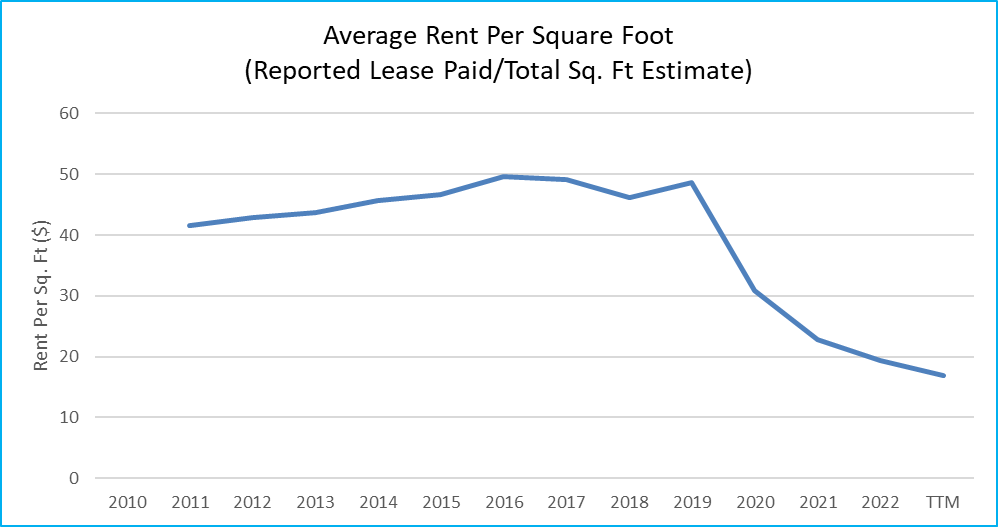
One of the most important aspects of the process was lease negotiations. With over 400 retail locations across the country, rent costs are a major expense.
Reitmans hasn’t released specifics surrounding the lease negotiations for the remaining stores during CCAA but there are a few data points to follow. For starters, negotiating during Covid gave Reitmans the upper hand considering the market became one of the best “renter’s markets” in recent memory. One of their Landlords, SmartCenter (SRU-U), is known as being one of the strictest in the industry. On page 59 of the Q3 MD&A they disclose gross rent and leased area by client. Over the last four quarters, Reitmans is
paying 10% less per square foot versus the preceding four quarters at SmartCenter locations. This represents about 15% of all Reitmans locations. As the graph to the right depicts, it appears like Reitmans was able to negotiate much better lease terms. Based on disclosed ‘lease payment’ and estimated total square feet, we estimate other landlords in less attractive locations negotiated much higher discounts for Reitmans.
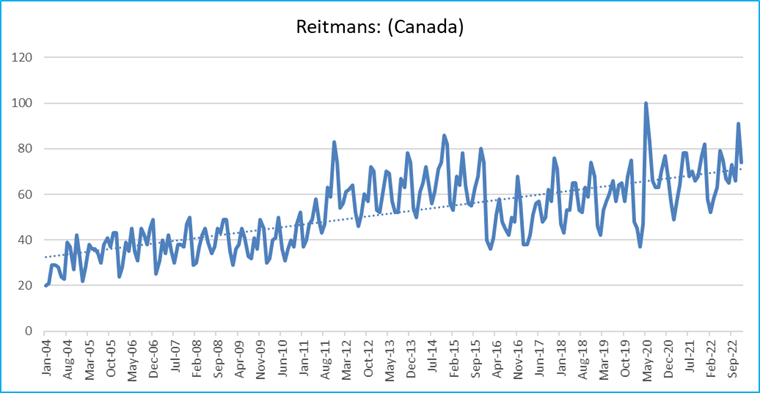
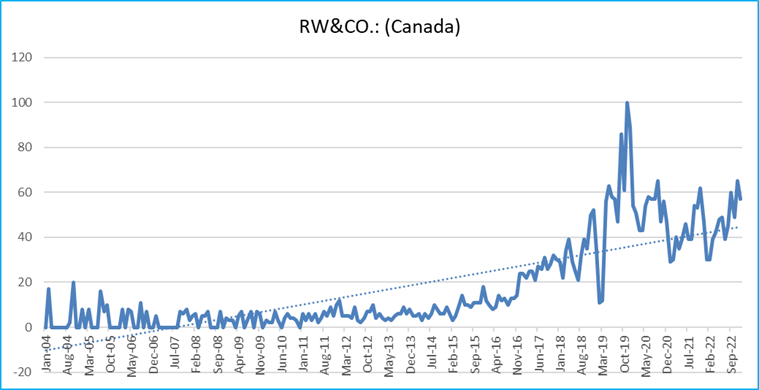
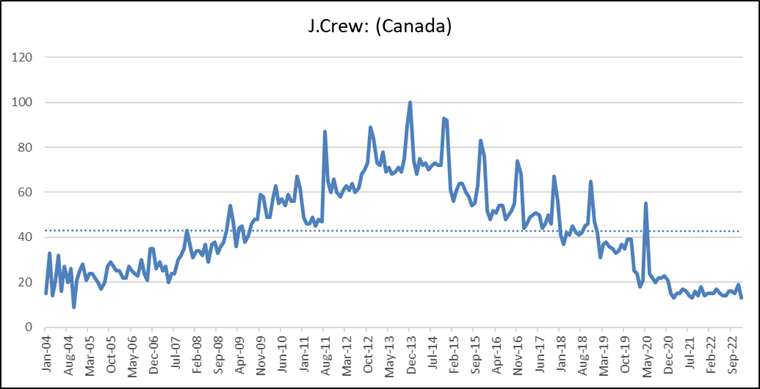
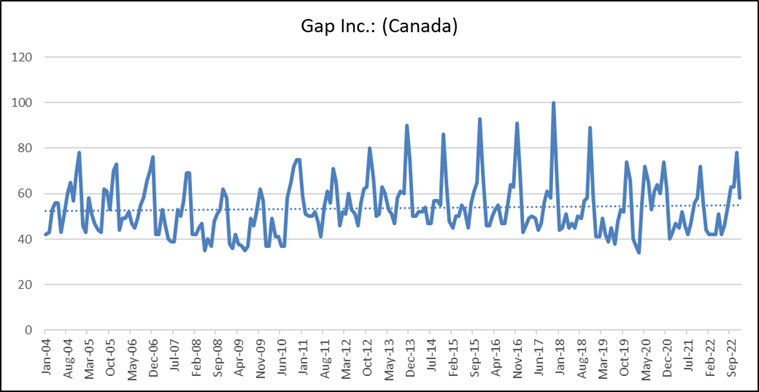
Online Search Trends
Retail can be hard to analyze because there are overarching macro factors that have an impact across the entire industry, but there are a lot of individual nuances that vary from company to company. These unsystematic risks include decisions relating to fashion choices, marketing strategy, product value, customer experience, etc.
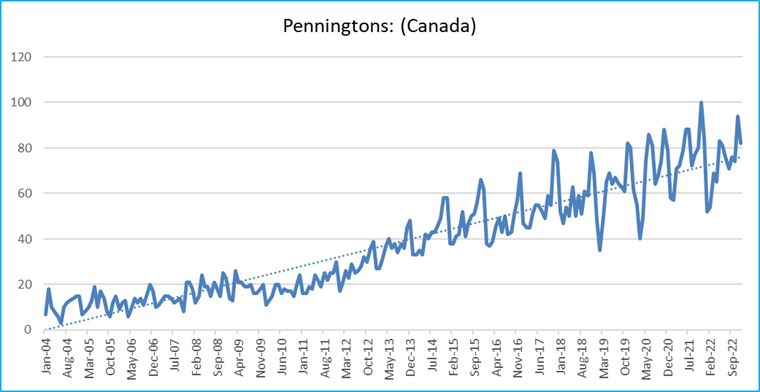
In order to gauge how well Reitmans has been performing relative to its competitors, we have included over the next three pages the online Google search trends for Reitmans’ 3 banners compared to some of their competitors during the same timespan. As one can see, the trendlines for each of their banners have been trending in a positive direction for a long time. What makes this more impressive however, is the relative performance versus many of their competitors. Based on our analysis, we believe Reitmans has been connecting with the consumer based on fashion, marketing, value, and experience while many competitors have stagnated and fell behind. Penningtons specifically has been most impressive, and we think a lot of the success has to do with lack of competition in a segment that has underlying demographic growth. Refer to Appendix 1 and 2 for information regarding competition per women’s size bracket plus demographic growth. Penningtons is the one banner Reitmans plans on growing in calendar 2023, adding 10 locations overall.
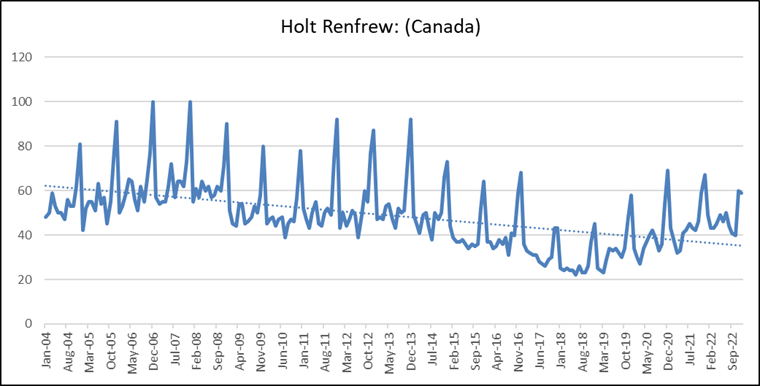
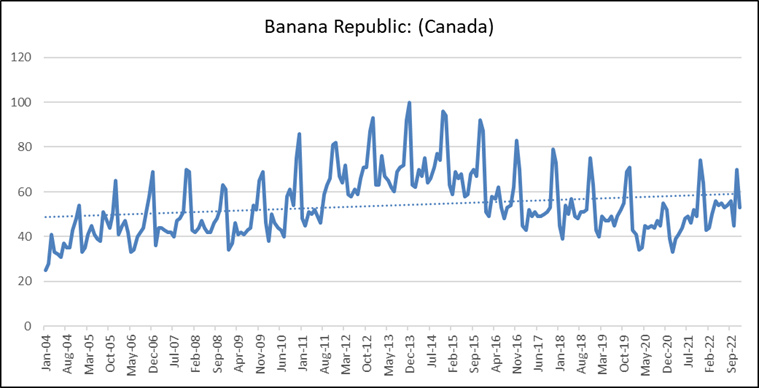
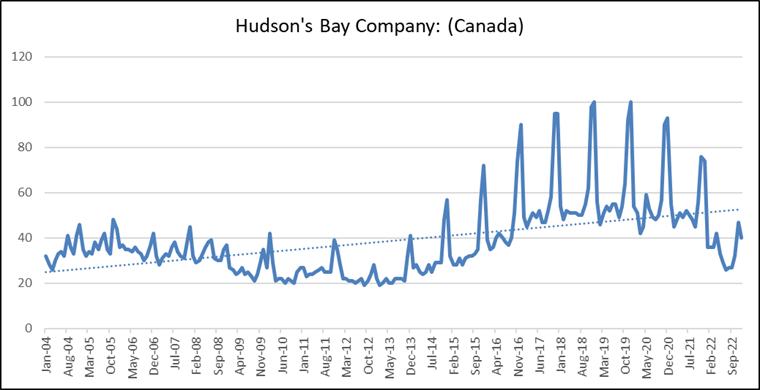
E-Commerce
Reitmans launched their inaugural websites in 2007. From fiscal 2015 to 2018 they disclosed e-commerce sales growth:
| Fiscal Year |
| E-Commerce Sales Growth |
| 2015 |
| 63.5% |
| 2016 |
| 69.1% |
| 2017 |
| 50.7% |
| 2018 |
| 38.2% |
Part of the reason many of their financial metrics have been improving as of late is due to the success of their omni-channel strategy. E-commerce sales now account for 25% of all sales. Over the past few months, we have experimented with buying from each site, shipping to multiple locations, and returning items. What we have found is a top tier online experience.
In our experiments, we experienced the following with the various aspects of the process:
- Online Ordering: immediate email confirmations
- Shipping: shipping confirmations and tracking numbers provided the same day as order
- Delivery: delivered next day for urban addresses, and within two days for rural
- Returns: ‘Returns’ button within order confirmation allows one to print return labels; notification received when it was delivered and refunded
Much of the growth and margin improvement can be tied to their e-commerce abilities. Overall, the quality and growth of their e-commerce offering is one of the main drivers of their operating success.
Buybacks and Dividends
Reitmans’ management has a propensity for buybacks and dividends, and we believe this trend, plus their current cash levels and valuation 1 , set up an ideal scenario for the company to renew their buyback and dividend policies. However, we expect management to be conservative in the short-term considering the macro environment.
When asked about capital allocation, management has stated they are focused on profitability at the moment. In the past, the company’s stated objective was to payout 50-80% of sustainable earnings per share. Considering the amount of free cash generation, cash on the balance sheet will build quickly. Considering the current valuation 1 , stock buybacks are extremely accretive for shareholders, and we expect management will continue to be pushed into initiating a NCIB.
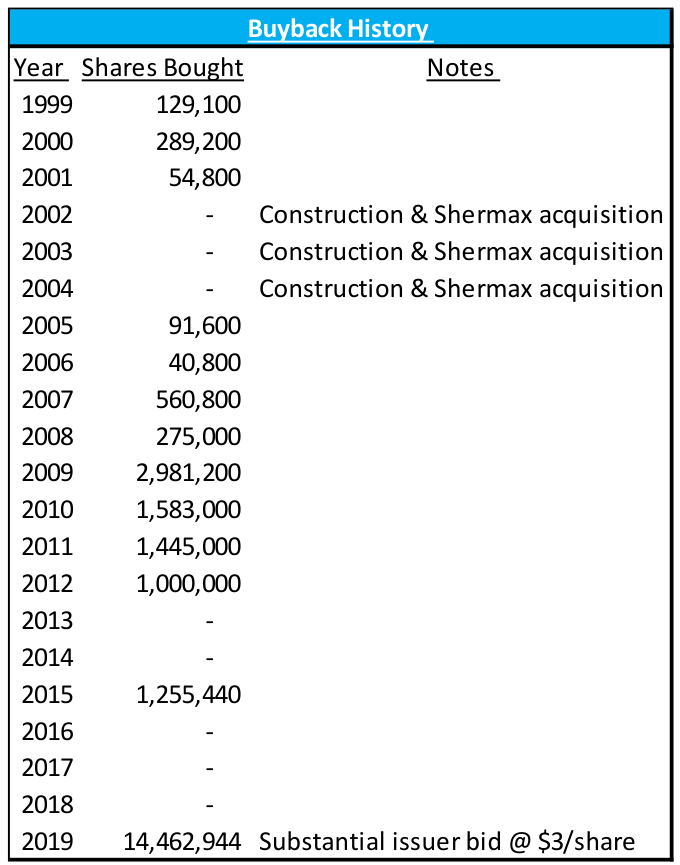
Financial Outlook
With the company exiting their Covid issues with a much cleaner balance sheet and streamlined operations, the profitability metrics have improved considerably. The growth of their e-commerce business and past store rationalizations have helped improve their profitability metrics for over a decade (See Figures 14 and 15 below).
As shown below, using square foot estimates from Appendix 3, revenue per location and revenue per square foot (not adjusted for online sales), has been steadily improving.
The most important aspect of this investment in our view, is assessing the reliability of earnings going forward. Below we weigh secular growth, gross margin inputs, cost savings, incentives, and company history to come to the conclusion that Reitmans’ earnings will be much more resilient than what is currently priced into the stock.
Revenue Growth
- Reitmans is one of the only retailers with favourable demographics. With a focus on mature women, with specific banners and brands servicing plus size women, we estimate their target population is growing 3.3% per year (See Appendix 2).
- Reitmans has now completed their store rationalizations and plan on growing the Penningtons banner by 10 stores, representing roughly 3% growth in Reitmans overall square footage.
- According to Mastercard SpendingPulse, Canadian Apparel Spending was up 3.2% in November 2022 vs. 2021. This is the most recent data available on the industry in general. More specifically, retail spending on apparel was up 6.6% YoY on Black Friday (November 25 th , 2022). Both data points suggest a fairly stable retail environment.
- Based on the above factors, and being conservative and factoring in an economic slowdown for 2023 (recession), we’re projecting 3.1% revenue growth in Fiscal 2024 (February 2023-January 2024).
Gross Margins
- Gross margins are most impacted by foreign exchange, followed by promotional activity, input costs, and shipping. Reitmans margins faced headwinds in 2020-2022 that we think have now subsided and the outlook is for gross margins to return to +60% like they were from 2011-2015.
- Foreign Exchange – Merchandise payments are settled in USD (80% of products from China). In the past they have used derivative instruments to hedge this exposure. The USD is down to start 2023 but was strong in the second half of 2022. Depending on time of orders, the strength in the USD could hurt gross margin in Q4 and Q1.
- Promotional Activity – The amount of promotional activity in any given season can vary widely from retailer to retailer. In order to get a sense of promotional activity this year versus prior years we used Waybackmachine.com to monitor the 3 banners online and compare their discounts from 2019-2023. As you can see below, the 2022 holiday period seems to have needed less promotional activity across all three banners. We view online ads plus in store visits quite favourably for 2022.
Annual Forex Rates
| USD/CAD 3 |
| Current |
| $ 1.35 |
| 2022 Average |
| $ 1.30 |
| 2021 Average |
| $ 1.25 |
| 2020 Average |
| $ 1.34 |
| 2019 average |
| $ 1.33 |
Online Deals
| Comparing Discounts 2019-2023 |
| Reitmans |
| 12/29/2022 |
| 12/29/2021 |
| 12/25/2020 |
| 12/31/2019 |
| Headline Deal |
| Up to 70% off sale items *Extra 20% |
| Up to 70% off sale items *Extra 30% |
| Up to 70% off sale items *Extra 30% |
| 40% off everything |
| Other |
| 25% off new arrivals |
| 25% off new arrivals |
| 25% off new arrivals |
| Up to 70% off sale styles |
| Subscriber Rebate |
| 15% off code |
| 20% off code |
| 20% off code |
| 20% off code |
| Penningtons |
| 1/5/2023 |
| 1/20/2022 |
| 1/19/2021 |
| 12/24/2019 |
| Headline Deal |
| 30% of Active Zone |
| 30% off (almost) everything |
| Extra 60% off sale items |
| Extra 50% off sale styles |
| Other |
| - |
| - |
| - |
| - |
| Subscriber Rebate |
| - |
| - |
| - |
| - |
| RW&CO |
| 1/6/2023 |
| 1/20/2022 |
| 1/19/2021 |
| 12/31/2019 |
| Headline Deal |
| 30% off regualr priced items |
| 25% off outerwear |
| Up to 70% off |
| Up to 70% off sale items *Extra 20% |
| Other |
| Up to 60% off sale items *Extra 30% |
| Up to 60% off sale items *Extra 30% |
| - |
| - |
| Subscriber Rebate |
| 10% off code |
| 10% off code |
| 10% off code |
| 10% off code |
| Cost of Cotton 3 |
| Current |
| $ 83.39 |
| 2022 Average |
| $ 112.62 |
| 2021 Average |
| $ 93.53 |
| 2020 Average |
| $ 64.15 |
| 2019 average |
| $ 67.19 |
| Cost of Shanghai Export Container 3 |
| Current |
| $ 1,031 |
| 2022 Average |
| $ 3,345 |
| 2021 Average |
| $ 3,818 |
| 2020 Average |
| $ 1,261 |
| 2019 average |
| $ 811 |
- Input Costs – The main input cost for Reitmans is the cost of cotton. The price of cotton spike at the beginning of 2022 but has since dropped 46% from the highs in May. The current price is back to 2018 levels and we see this is as a positive for gross margins for calendar 2023.
- Shipping Costs – The most drastic price jump was shipping costs. 2020 saw an increase but nothing like 2021 and 2022. At its peak, the cost of shipping from China increased +400% from 2019 to 2022 3 . The price has since dropped 80% from its peak and it back to 2018-2019 levels which should help boost margins going forward.
- Seasonality – Fiscal Q1 is by far the weakest, where the company historically operates around breakeven and makes a majority of their earnings in Fiscal Q2 & Q4
- Overall, these factors are lining up well for improved gross margins in Fiscal Q4 2023 and Fiscal 2024.
Cost Savings
- Debt Costs – Reitmans paid off all existing interesting-bearing debt in fiscal Q2 2023. They paid off the remaining $34.4m of debt using cash and cash flow.
- Lease Payments – As referenced in Figure 2, the CCAA process allowed Reitmans to negotiate much better terms on leases. The overall cost savings is hard to estimate but Smart Centre (SRU-U) is known as one of the strictest landlords, and in their Q3 MD&A they disclose a 10% decrease in cost per square foot for Reitmans. Based on disclosed ‘lease payments’ and estimated total square feet, we estimate other landlords in less attractive locations negotiated much higher discounts for Reitmans.
- Head Office Rationalization – During CCAA proceedings, Reitmans laid off 1,600 employees. Most of these employees worked at Thyme Maternity or Addition Elle, but we estimate 10-15% of the 1,600 were head office employees. The Thyme Maternity & Addition Elle brands were losing money and a drag on the business. The restructuring process allowed them to close the stores and layoff employees is a more beneficial way for the company.
Incentives
During the CCAA process, the company put a new bonus structure in place. The bonuses are tied to operating profit per store less direct overhead. A minimum is established, and bonuses are paid on exceeding such minimum. Incentives in this case are directly tied to store profits and mesh with management’s recent comments that their focus is on company profitability. However, these bonuses are a risk because the company is under Reitman family control. There is a possibility of excessive bonuses and unaligned economics. The bonuses were fairly large over the past two reported quarters. That being said, the company overall was still extremely profitable after this expense.
History
The fact that Reitmans has been in business for almost 100 years offers some insight into relative performance during economic slowdowns. For example, during the economic downturn in Canada in 2002, Reitmans had their best retail operating results in their history. They have resilience due to the fact that their banners are perceived as “value stores” versus leisure, luxury, or specialty. In 2008, during the financial crisis, Reitmans’ total revenue declined 0.6% and they maintained 8.2% profit margins ($86m in profits). As the recession continued into 2009, Reitmans’ revenue increased 0.5% with 6.4% net margins ($67m in profits).
Valuation
Reitmans’ valuation is the most compelling aspect of the story from an investment standpoint. We believe the stock is as cheap as it is mainly due to the complexity and confusion of the CCAA proceedings. In addition, there is no analyst coverage, and many institutional investors cannot invest on the TSX Venture, especially not in something that’s currently this small ($146m market cap).
From 2010-2019, the stock traded on an average price to cashflow of 7.7x, and we currently estimate it is trading on 2-2.5x cashflow. Plus, the company is currently sitting on $68m of cash and no debt as of last quarter, and has about $240m of real estate assets. 1
Equity
- Over the trailing 9 months, Reitmans has reported over $60m in operating cash flow
- Based on costs savings and resilient revenue described above, we believe the business can conservatively generate $57-$62m in cash flow over the next 12 months.
- Factoring interest rates, we believe the equity value of the stock should trade on at least a 7x cashflow. 1
- This values the operating business at $8.16-$8.88 per share. 1
Cash
- In Reitmans’ most recent quarter they reported $68m of cash.
- Their quarter ending January 31 st , 2023 should increase this amount by roughly $90m. 1 This accounts for approximately $1.84 per share but we highly discount this amount in our value because management is known to be conservative and maintain large sums of cash on the balance sheet.
- A portion of cash should be used for a stock buyback which would be significantly accretive at a 40% cash- flow yield.
Real Estate
- As referenced in the history timeline, Reitmans moved into their current office building in 1965, added two floors plus additional space.
- We estimate the building is currently worth
For further details see:
Donville Kent - Reitmans: Poised For A Massive Re-Rating In 2023