THRM - Dorman Products: Not A Great Play Just Yet
2023-03-06 05:41:49 ET
Summary
- Dorman Products has had something of a lumpy operating history, but sales have done incredibly well in recent years.
- Current guidance is very bullish and could lead to some upside, but it's still too early to know if the company can deliver on it.
- At present, DORM shares look to be more or less fairly valued and likely have less upside as a result.
With 290 million vehicles on the road in the US alone, not to mention other specialty vehicles, it stands to reason that there would be a large market associated with the replacement and upgrade of parts necessary for said vehicles’ operation. One company that operates in this space that is fairly small but which warrants attention is Dorman Products ( DORM ). Over the past few years, this prospect has done well to grow its top line. Bottom line results have been a bit more mixed. But on the whole, the company seems to be quite healthy. Management is forecasting attractive growth throughout the 2023 fiscal year, even in light of broader economic concerns. And if that does come to fruition, then the long-term outlook for the company will probably also shape up to be quite positive. Given where shares are priced at the moment, however, both on an absolute basis and relative to similar firms, I do think it would be appropriate to rate the business a ‘hold’ to reflect my view that shares should generate upside that more or less matches the broader market moving forward.
A niche auto play
According to the management team at Dorman Products, the company operates as one of the leading suppliers of replacement and upgrade parts in the motor vehicle aftermarket industry. The list of vehicles that it provides parts for consists of passenger cars, trucks of all sizes, specialty vehicles like utility terrain vehicles and all-terrain vehicles, and more. The company provides these parts to a variety of purchasers that, in turn, supply individual consumers and professional installers with its products. The purchasers in question often include dealers and warehouse distributors, as well as website operators.
As you will see shortly, management has done well to grow the company's revenue over the past few years. This growth has been made possible in part by a rise in the number of distinct parts that the company markets. This number, as of the end of the 2022 fiscal year, totaled 129,000. That's up from the 118,000 reported one year earlier. It's worth noting that this number excludes private-label stock-keeping units and Variations in how the company markets individual parts. What's really impressive is that about 75% of all the products the company sells are sold under brands that it owns, with the rest being sold for resale under the private labels of other firms.
The largest chunk of the sales the company generates involves chassis. The products under this category include control arms, ball joints, brake hardware and hydraulics, wheel and axle hardware, suspension arms, bushings, and more. 37% of its revenue comes from powertrain products like intake and exhaust manifolds, cooling products, harmonic balancers, fluid lines, fluid reservoirs, 4-wheel drive components and axles, and more. 18% of sales are related to motor vehicle body products such as door handles and hinges, window lift motors, window regulators, wiper components, and more. And the final 4% of sales is attributable to hardware products like threaded bolts, auto body fasteners, automotive and home electrical wiring components, and more.
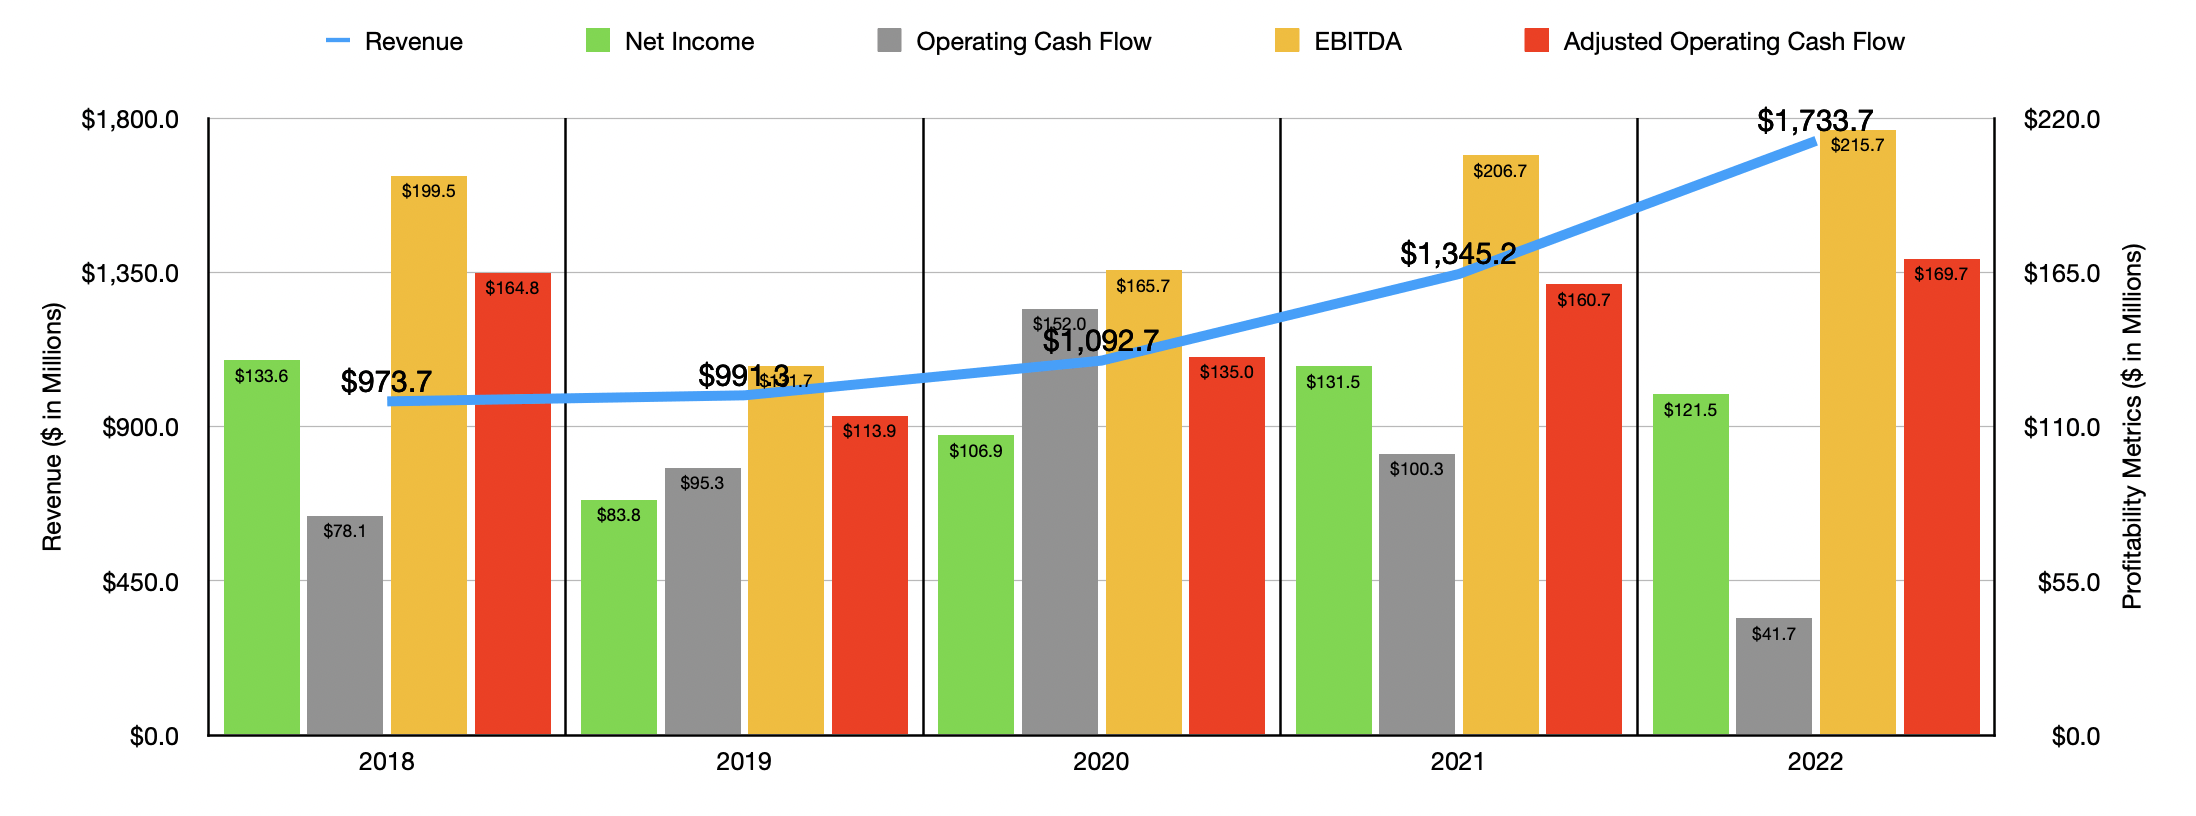
Over the past five years, sales achieved by the company have been quite positive. Revenue increased in each of the past five years, climbing from $973.7 million in 2018 to $1.73 billion in 2022. The largest increase was the 28.9% rise from 2021 to 2022. A good portion of this sales increase was driven by the company's acquisition of Dayton Parts back in August of 2021. For the 2021 fiscal year, obviously, the firm received revenue from the acquired enterprise only from the date of acquisition through the end of the year. It also benefited by an unspecified amount from the acquisition of SuperATV that took place in October of last year. Excluding these acquisitions, sales would have grown by 13.8%.
It's great to see revenue increase like this. However, bottom line results have not been as great. After seeing that income drop from $133.6 million in 2018 to $83.8 million in 2019, it began a consistent incline year after year until hitting $131.5 million in 2021. Then, in 2022, profits dropped to $121.5 million. One of the major contributors to this decline was a drop in the company's gross profit margin from 34.4% to 32.6%. This, in turn, was caused by cost pressures associated with global supply chain issues, as well as inflationary costs that the company was not able to entirely pass on to its customers. The company also saw its selling, general, and administrative costs rise from 21.7% of sales to 22.7%. Management attributed this mostly to higher interest rates on customer accounts receivable factoring programs and higher amortization associated with intangible assets from the aforementioned acquisitions.
Other profitability metrics were also a bit lumpy during this time. Operating cash flow, for instance, rose consistently between 2018 and 2020. This number increased from $78.1 million to $152 million. Then, in 2021, it dropped to $100.3 million before plunging to $41.7 million in 2022. If we adjust for changes in working capital, however, we would see some positive trend develop. After falling from $164.8 million in 2018 to $113.9 million in 2019, the metric began a consistent incline year after year, eventually hitting $169.7 million in 2022. A very similar relationship can be seen when looking at EBITDA, with the metric climbing from a low point of $131.7 million in 2019 to $215.7 million in 2022.
For the 2023 fiscal year, management said that sales should come in at between $1.95 billion and $2 billion. This would translate to a year-over-year increase of between 12.5% and 15.4%. Earnings per share, meanwhile, should be between $4.35 and $4.55. Management is also forecasting adjusted earnings per share of between $5.15 and $5.35. When I analyze any company, I always am careful to not use adjusted earnings unless I think it's appropriate. Given that the vast majority of the adjustment management is estimating has to do with acquisitions the company recently made, I believe it's appropriate to use the adjusted figures in question. At the midpoint, that would translate to net income for the company of $165.3 million for the year. No guidance was given when it came to other profitability metrics. But if we assume that they will increase at the same rate that earnings should, then we should anticipate adjusted operating cash flow of $230.9 million and EBITDA of $293.5 million.
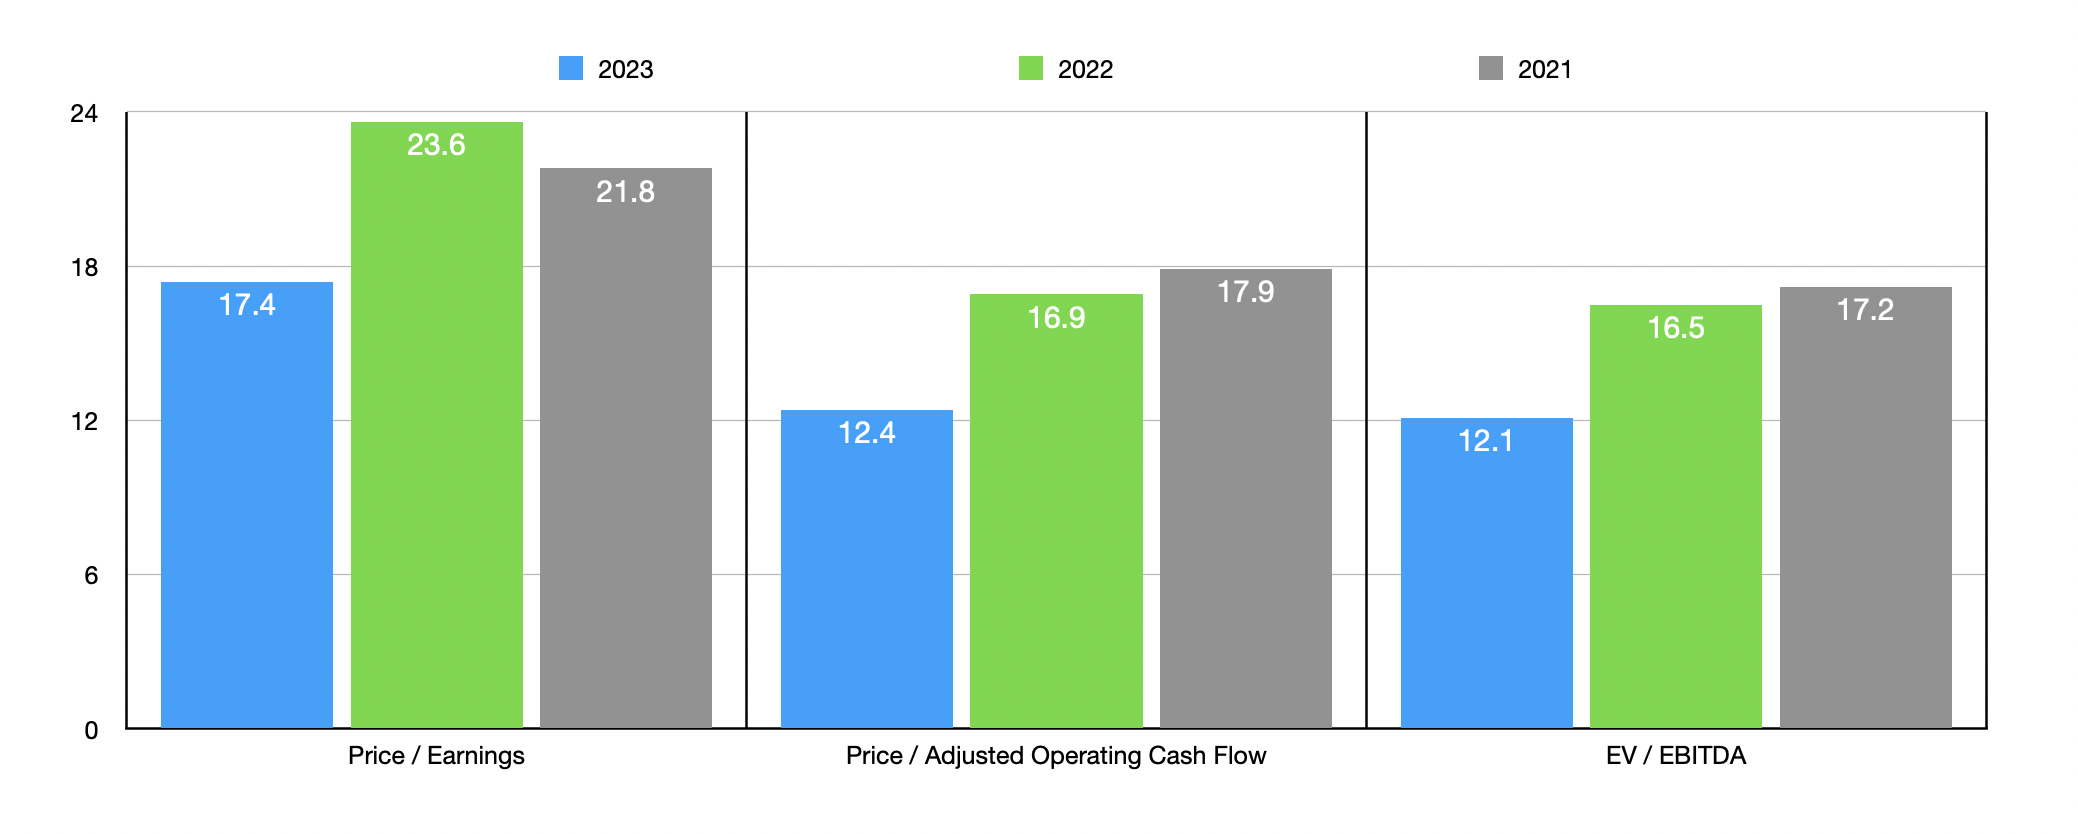
Based on these figures, Dorman Products is trading at a forward price-to-earnings multiple of 17.4. The forward price to adjusted operating cash flow multiple should be 12.4, while the forward EV to EBITDA multiple should come in at 12.1. By comparison, if we use data from 2022, these multiples are a bit higher at 23.6, 16.9, and 16.5, respectively. As part of my analysis, I decided to compare the company to five similar firms. On a price-to-earnings basis, these companies ranged from a low of 7.4 to a high of 93.5. Using the EV to EBITDA approach, we end up with a range of between 4.8 and 23.9. In both cases, four of the five companies were cheaper than Dorman Products. Meanwhile, using the price to operating cash flow approach, the range we get is between 2.4 and 150.7. In this case, three of the five companies are cheaper than our target.
| Company |
| Price / Earnings |
| Price / Operating Cash Flow |
| EV / EBITDA |
| Dorman Products |
| 23.6 |
| 16.9 |
| 16.5 |
| LCI Industries ( LCII ) |
| 7.4 |
| 4.9 |
| 5.8 |
| Modine Manufacturing Company ( MOD ) |
| 19.7 |
| 19.5 |
| 9.5 |
| Dana Inc. ( DAN ) |
| 16.7 |
| 3.6 |
| 9.3 |
| Gentherm Inc. ( THRM ) |
| 93.5 |
| 150.7 |
| 23.9 |
| American Axle & Manufacturing Holdings ( AXL ) |
| 18.2 |
| 2.4 |
| 4.8 |
Takeaway
Based on the data provided, I must say that I am impressed by the sales growth that Dorman Products has achieved in recent years. Long term, I suspect that the company will be just fine and, if my estimates for 2023 are correct, the firm does not look like a horrible prospect by any means. At present, however, shares are a bit lofty relative to similar firms and they look more or less fairly valued on an absolute basis. So until we actually see the estimates for 2023 play out, I do think that the company makes for a more reasonable ‘hold’ candidate at this time than anything else.
For further details see:
Dorman Products: Not A Great Play Just Yet