CHMI - Double-Digit Dividend Yield Dropped
Summary
- We closed out one of our double-digit yielding positions.
- This isn't admitting a mistake. We earned a solid 16.7% in about two months.
- We'll share the entire trade alert we sent to our members.
Get ready for charts, images, and tables because they are better than words. The ratings and outlooks we highlight here come after Scott Kennedy’s weekly updates in the REIT Forum. Your continued feedback is greatly appreciated, so please leave a comment with suggestions.
In this article I'm going to share a recent trade alert from The REIT Forum . This was sent out on Friday, so it's still fresh. For transparency, I'm copying the entire article directly below:
Trade Alert: TPVG
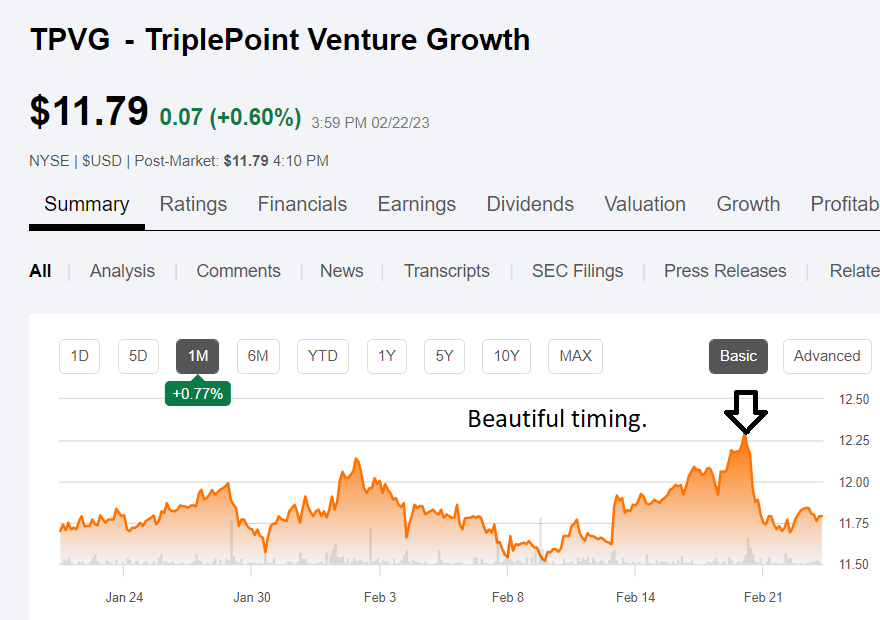
- Shares are up 16.77% including dividends since our purchase in late December.
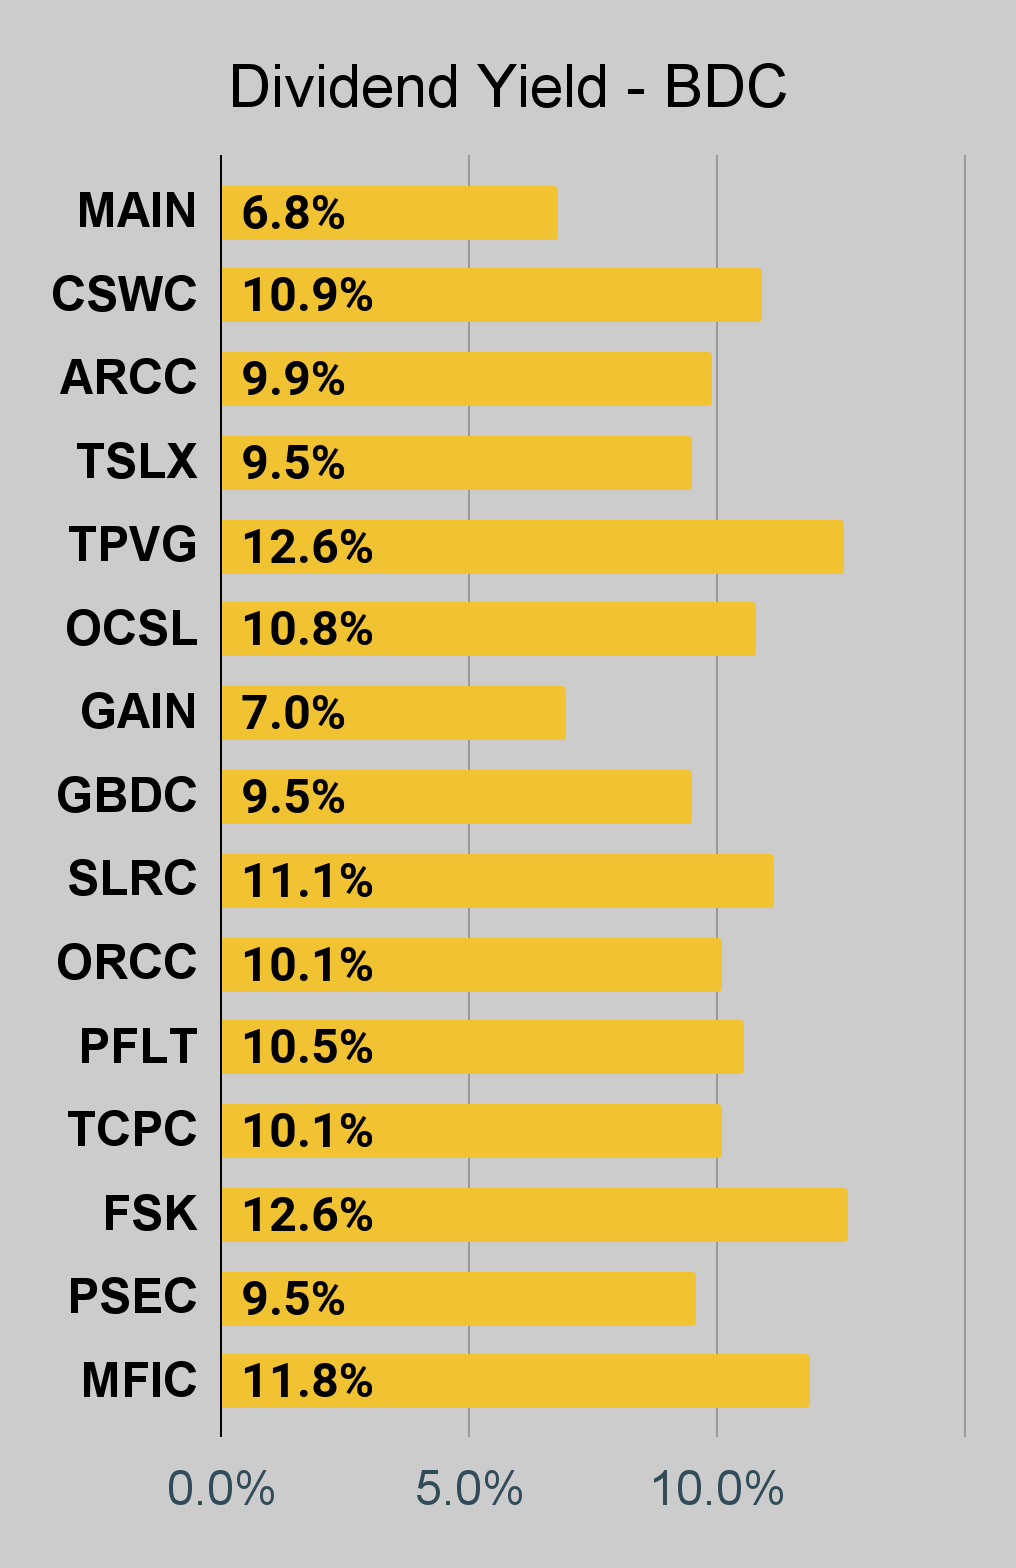
- That's a great return for less than two months and it is tied for the best among the BDCs covered by The REIT Forum.
- The rally presented a reasonable opportunity to start replenishing my cash position. Shares are currently just over halfway between the target "buy under" and "overpriced" levels.
Trades Placed
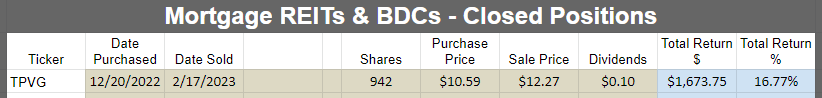
- Sold 942 shares of TriplePoint Venture Growth ( TPVG ) at $12.2701 per share.
Account
Shares were in one of our tax-advantaged accounts. From the start, we classified this as a trading position and our goal was to collect a short-term capital gain. If the capital gain was slow to occur, we would still collect a nice yield while waiting. It turns out that the gain was pretty quick.
We previously provided a brief guide on utilizing tax-advantaged accounts .
Execution
The trade went through Schwab:
Fidelity
Returns for Closed Positions
The REIT Forum
It only took two months to earn 16.77%. Great deal.
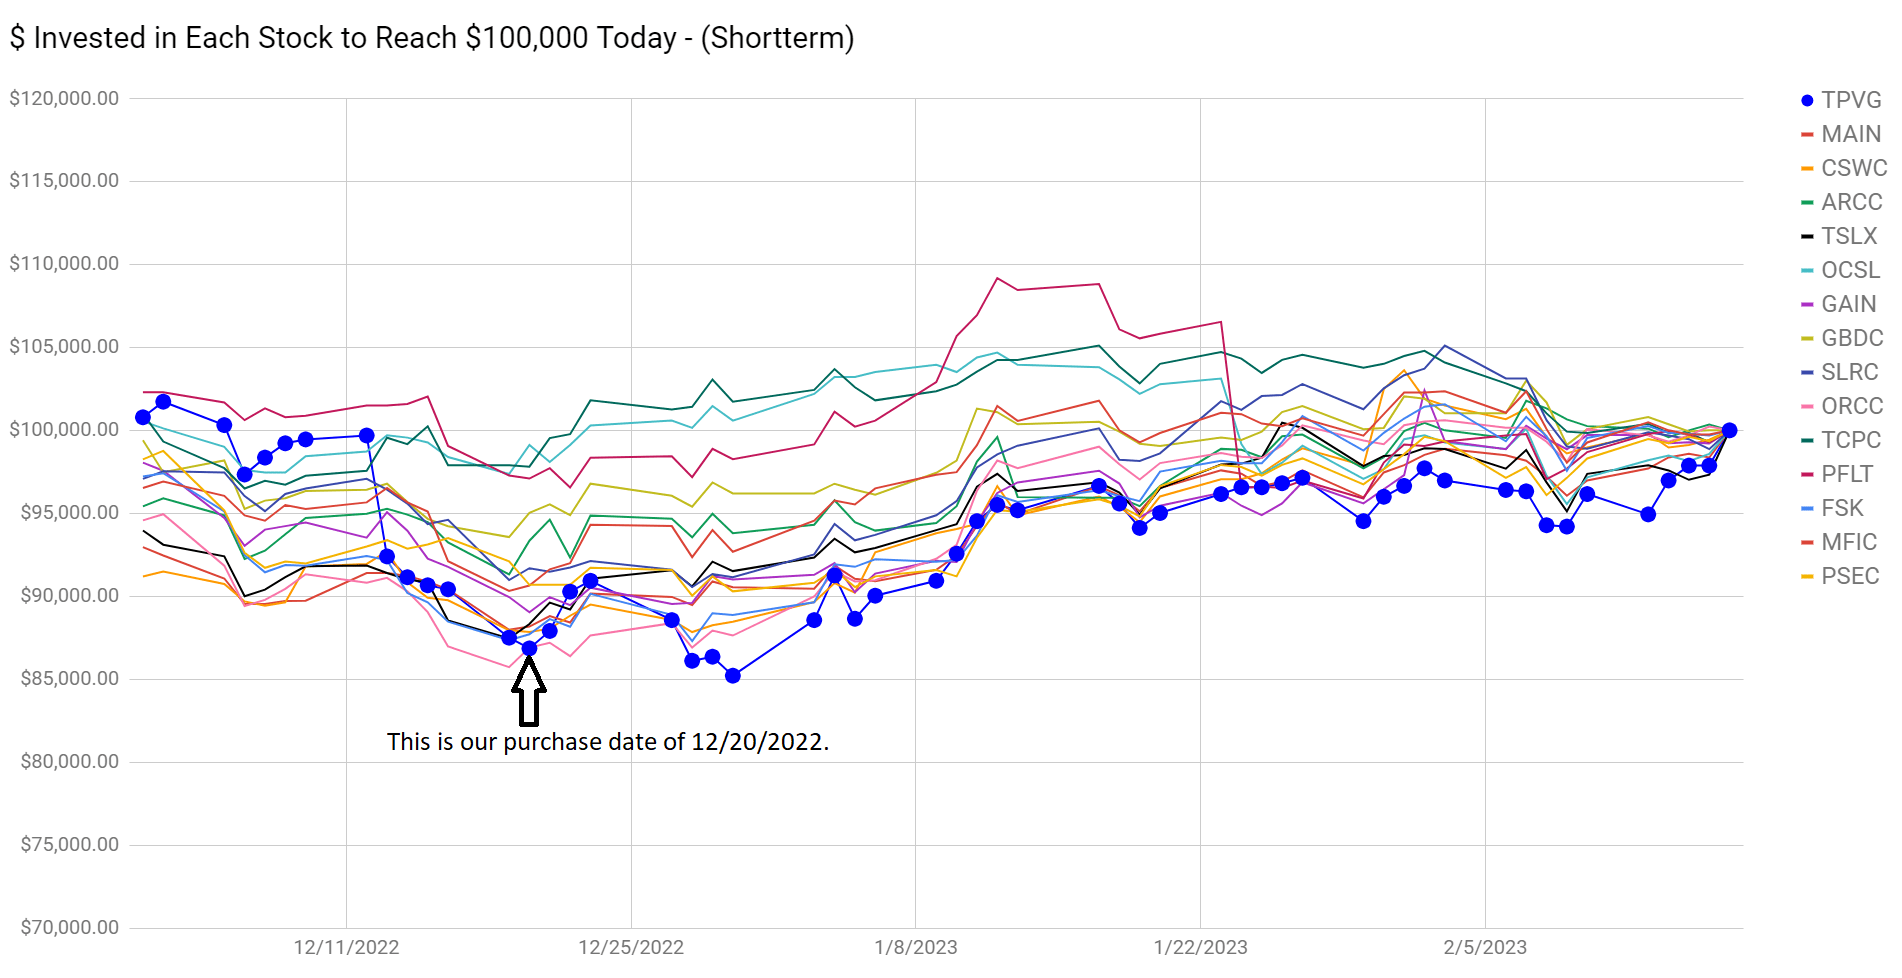
$100k Chart
TPVG and ORCC were the best two performing BDCs during that time period:
The REIT Forum
Conclusion
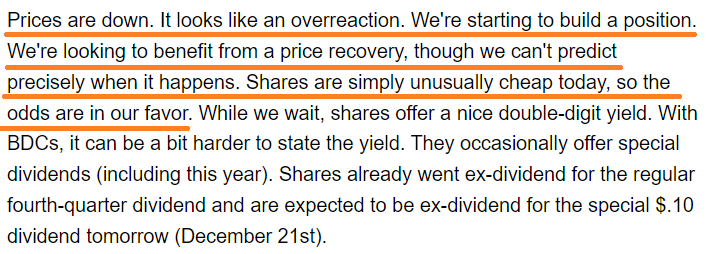
In our initial alert , we wrote:
The REIT Forum
The trade played out as expected. The odds were in our favor, and we saw a healthy recovery in the share price. As it stands today, shares of TPVG at $12.27 are just over halfway between the targets for “buy under” (at $11.65) and “overpriced” (at $12.80). Given our small cash allocation, I felt ready to take some of our gains off the table.
Our thanks to Scott for once again finding such a great entry opportunity. This trade was profitable precisely because we had such good information on what prices would represent a bargain for opening our position.
End of Trade Alert
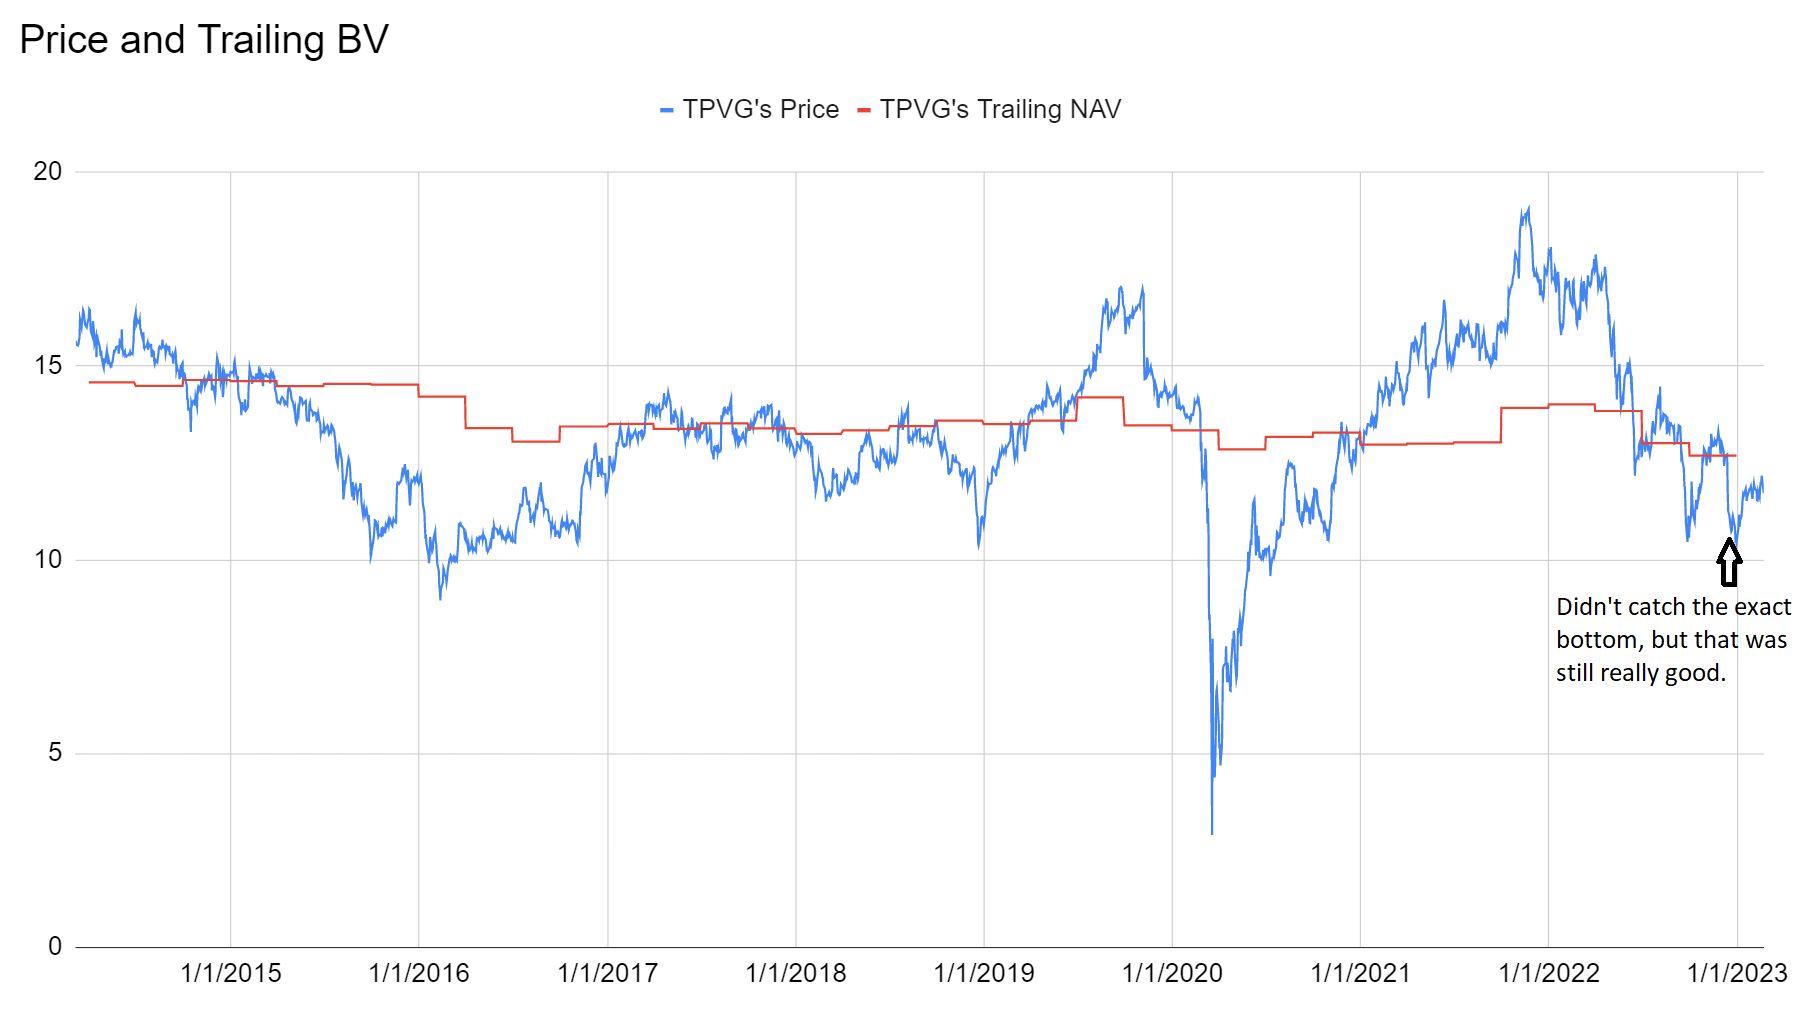
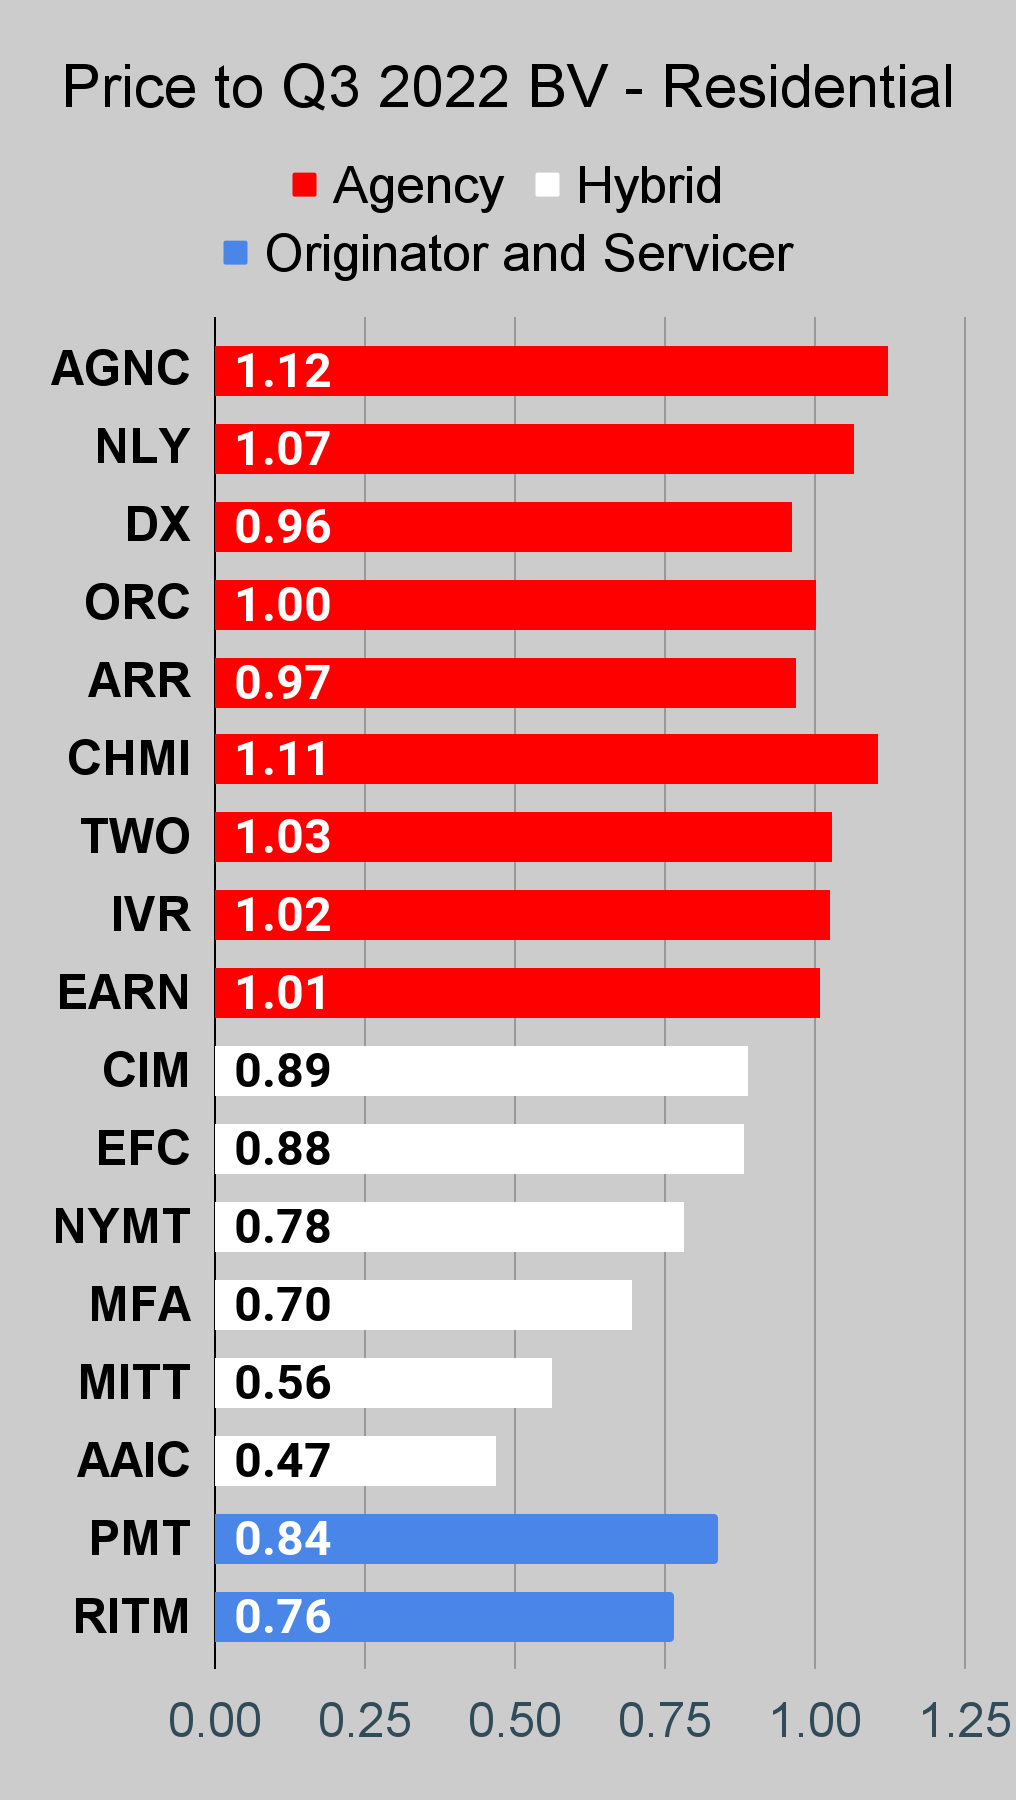
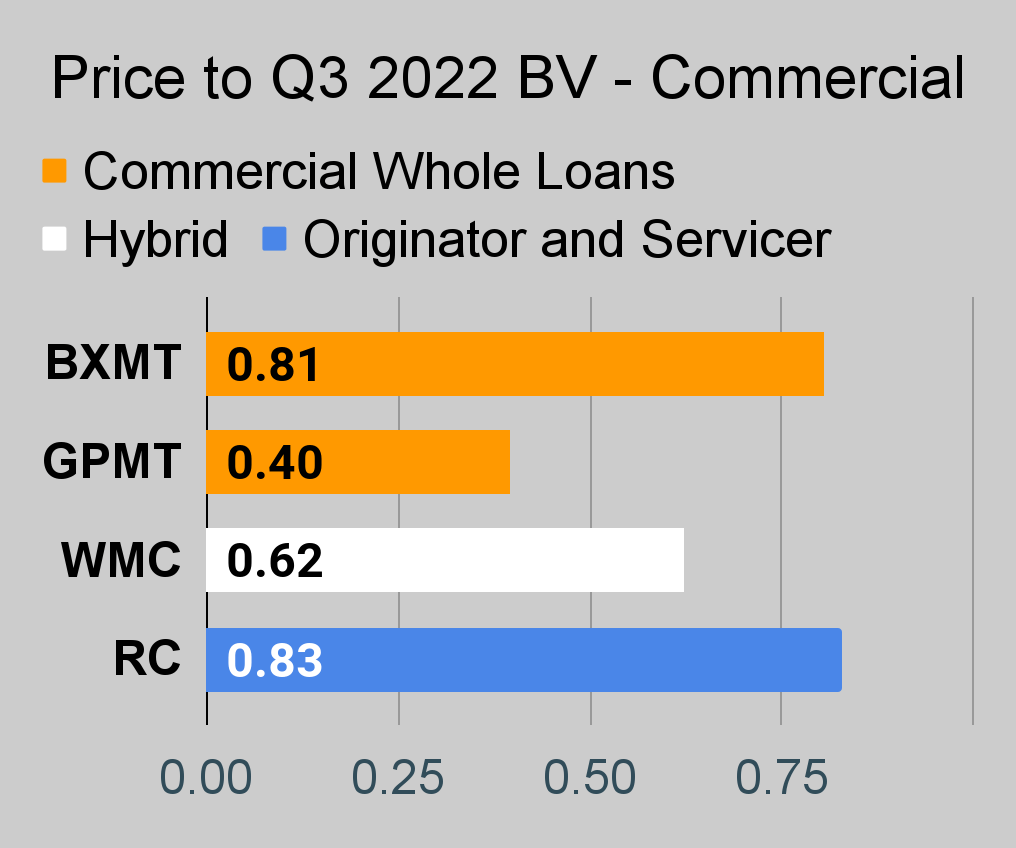
Trade alerts are usually pretty short. We didn't go over the thesis much, but it was built around price-to-book recovering to a more typical level:
The REIT Forum
This isn't the pandemic. We haven't seen discounts that large often outside the pandemic. Scott had already predicted and reviewed the news that was driving prices down, so we entered a trading position.
I'm not calling for a disaster. We're not going to a bearish view. But we got the "easy money." For investors who are used to getting cut by falling knives, it may seem absurd to call that the "easy money," but we've built our reputation by catching falling knives in the mREITs and occasionally BDCs.
That was a great entry and a nice exit.
Seeking Alpha
However, I can't take full credit for this timing. A few members of The REIT Forum noticed the rapid outperformance of TPVG over the week leading up to the sale. They called it out in our chat room and I simply looked through our tools and confirmed that it was a reasonable time to take profits.
Other Notes
I'll run through a few other notes on the sector.
AGNC still trades at a material premium to tangible book value. I think the market is focusing too much on short-term core EPS. Book value is generally more important. The portfolio is structured to produce high Core EPS, but that doesn't mean it produces more wealth for shareholders per dollar of book value.
NLY trades below projected book value. We saw it get awfully cheap a few months ago, then it rallied too hard. Now it's less remarkable. The spread in price to tangible book value between NLY and AGNC is pretty large now. This is unusual. Many investors may be scared by the knowledge that NLY plans to announce a dividend cut.
On a relative basis, I think over the next six months NLY (from $21.24) will perform better than AGNC (from 11.25) . Not vastly better. But probably a bit better because of the difference in starting valuations.
CHMI is at $6.69 per share. Laughable. Don't pay a premium for CHMI. Pick blindly and you'll probably get a better deal. I'm certainly not one to endorse using ETFs for this sector, but I think CHMI will perform worse than the ETFs. So hey, that's something. I'm going to take the opportunity to reiterate a bearish view on CHMI. This is easily competing for the worst deal in the sector . Dump it before it corrects.
BXMT at $21.90 is trading at a pretty low price-to-book ratio. This is worth some attention as it is very rare to see such a discount. They had a premium valuation back in August 2022. In only six months they fell from over $30 to $22. No dividend cut. Dividend coverage is looking good. What's the issue? Office exposure. Office real estate stinks. BXMT has a reasonable loan-to-value ratio on that real estate, but they're still preparing for some significant losses on some of the loans. Some positive and negative factors here. I may go into more depth in another article.
Stock Table
We will close out the rest of the article with the tables and charts we provide for readers to help them track the sector for both common shares and preferred shares.
We’re including a quick table for the common shares that will be shown in our tables:
| Type of REIT or BDC |
| Residential Agency |
| Residential Hybrid |
| Residential Originator and Servicer |
| Commercial |
| BDC |
Let the images begin!
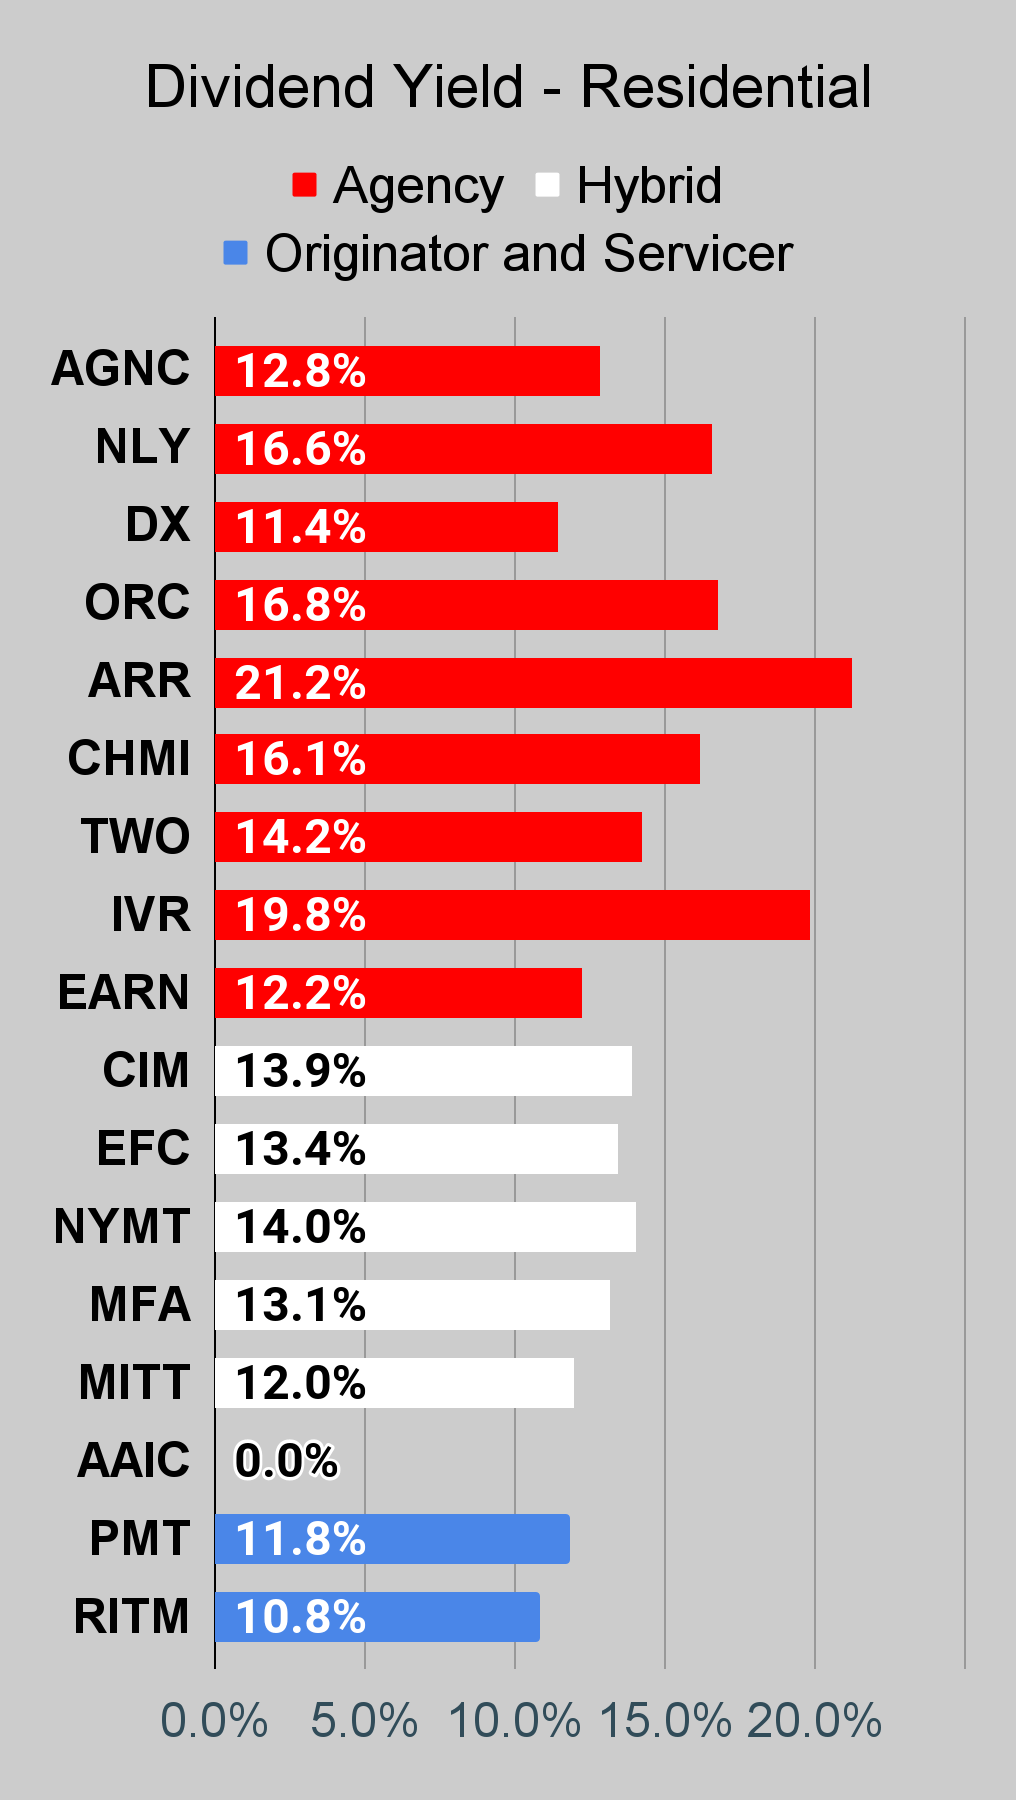
Residential Mortgage REIT Charts
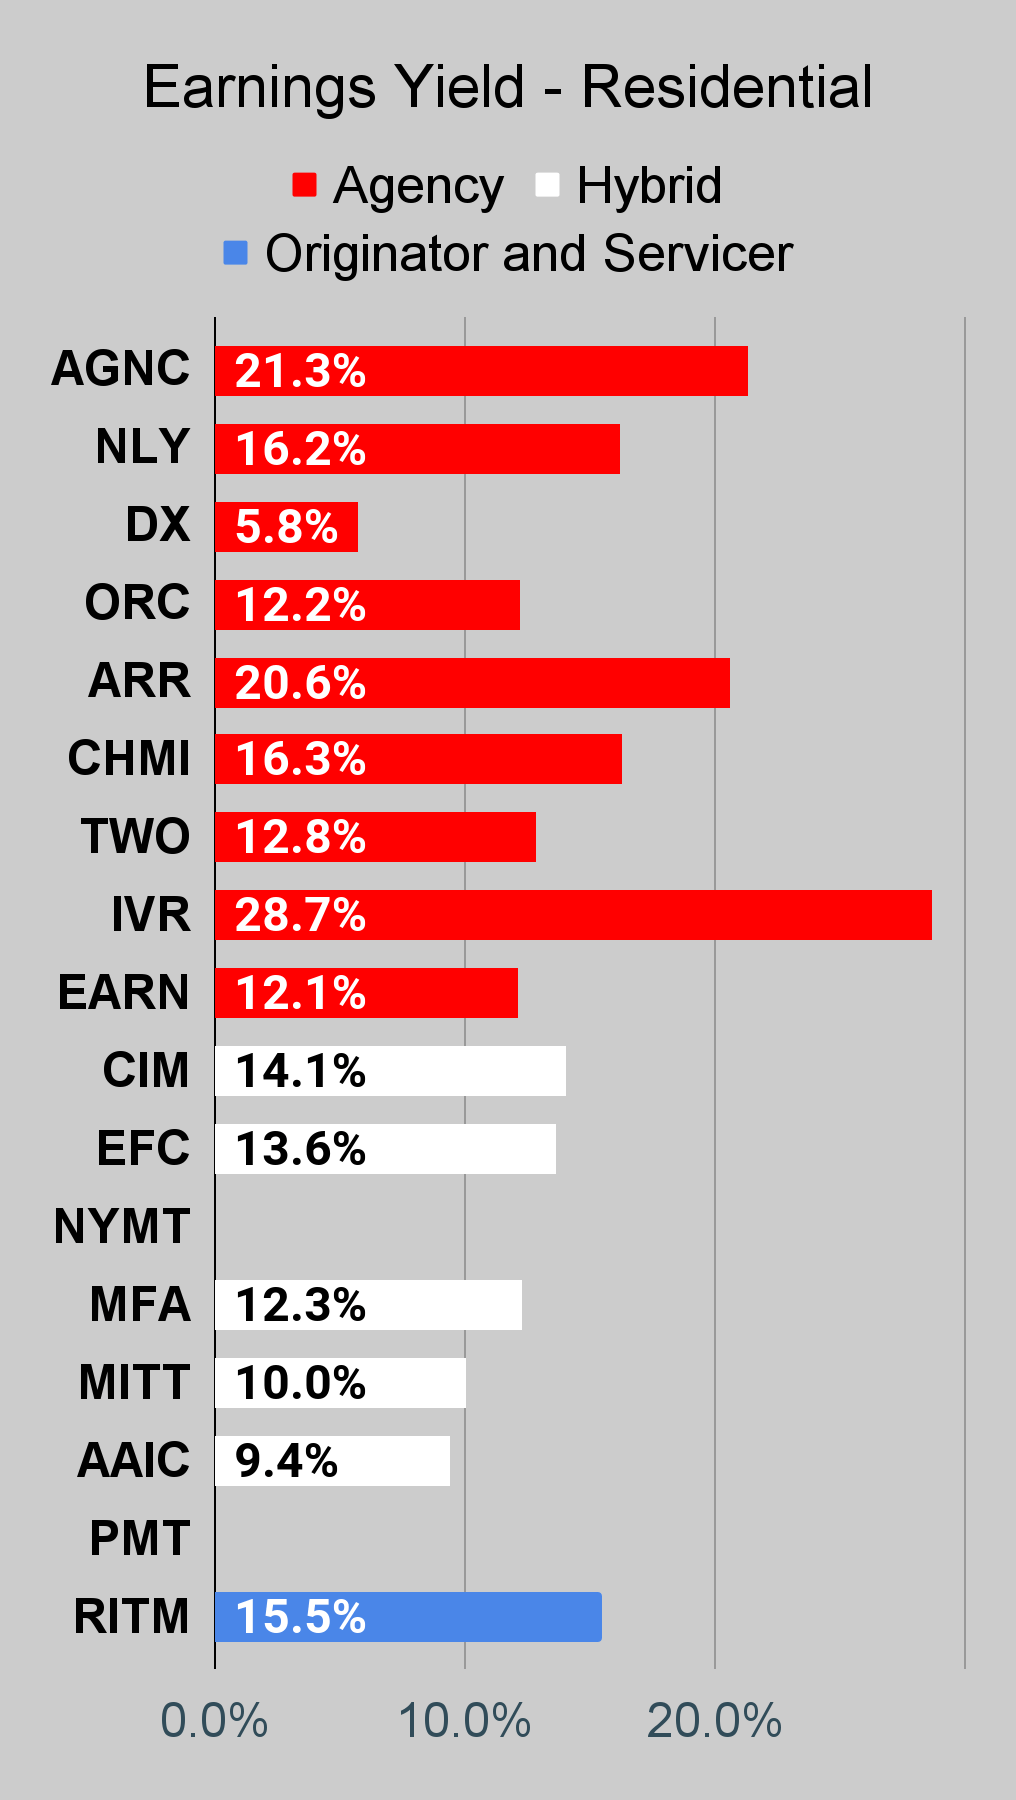
Note: The chart for our public articles uses the book value per share from the latest earnings release. Current estimated book value per share is used in reaching our targets and trading decisions. It's available in our service, but those estimates are not included in the charts below. PMT and NYMT are not showing an earnings yield metric as neither REIT provides a quarterly “Core EPS” metric.
Second Note: Due to the way historical amortized cost and hedging is factored into the earnings metrics, it is possible for two mortgage REITs with similar portfolios to post materially different metrics for earnings. I would be very cautious about putting much emphasis on the consensus analyst estimate (which is used to determine the earnings yield). In particular, throughout late 2022 the earnings metric became less comparable for many REITs.
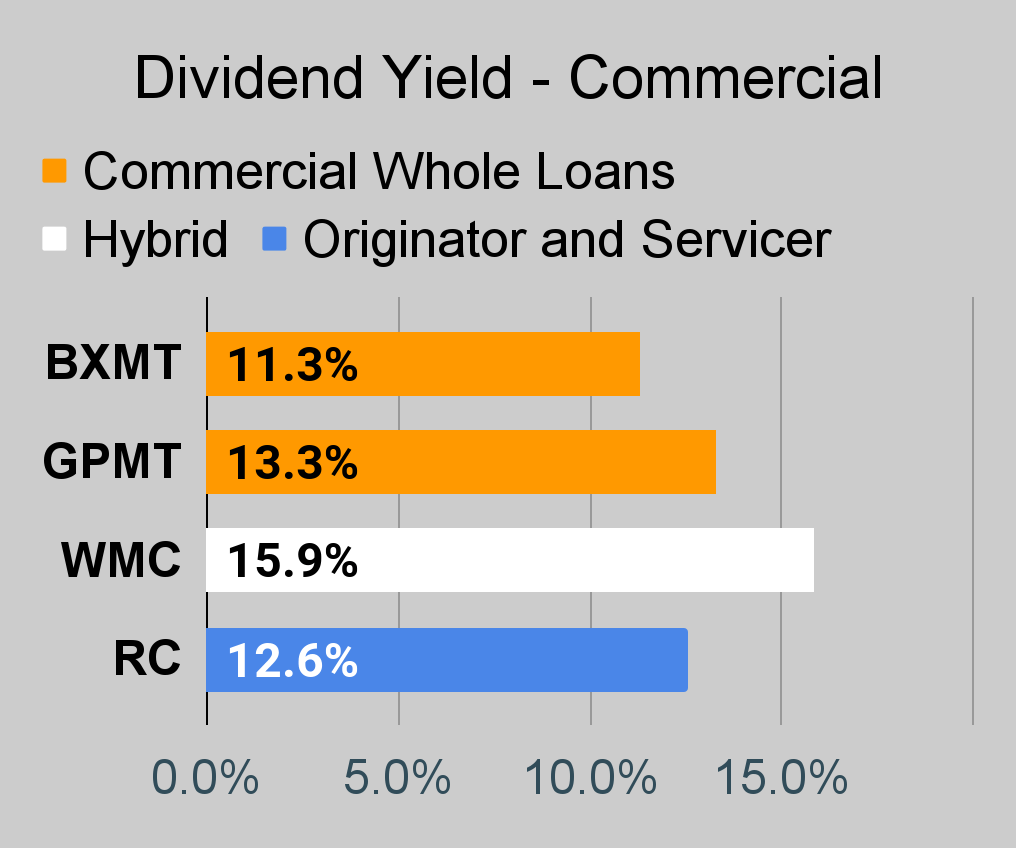
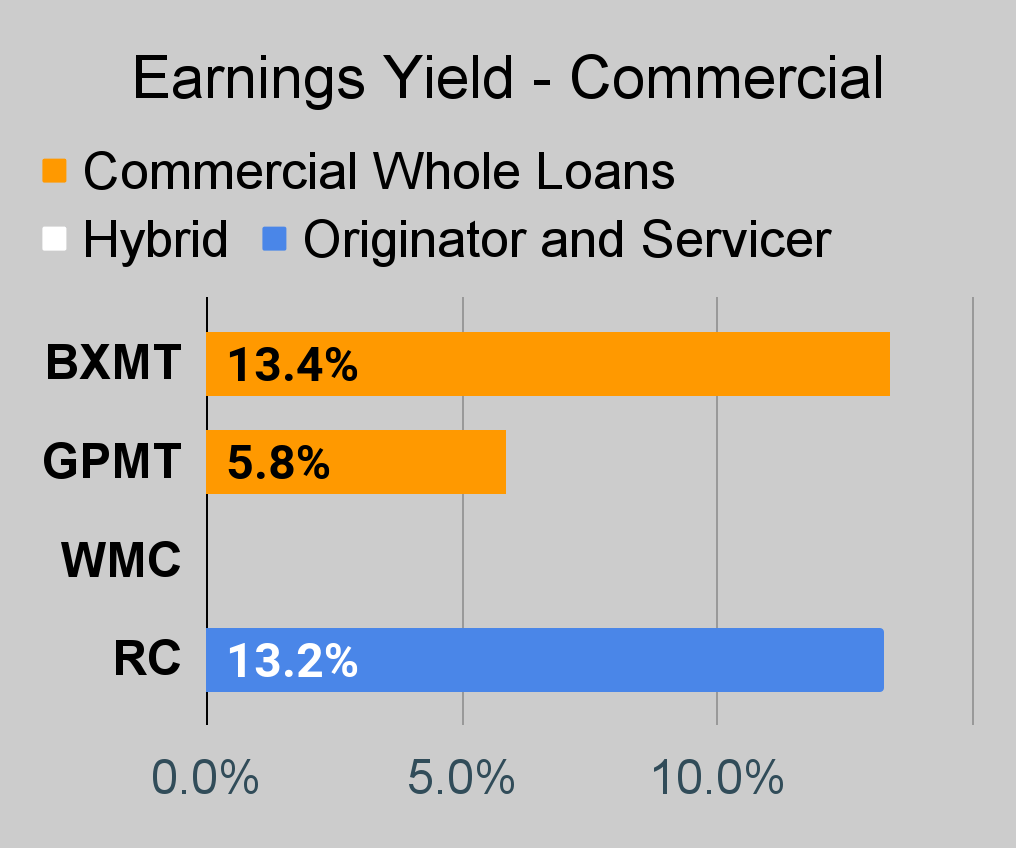
Commercial Mortgage REIT Charts
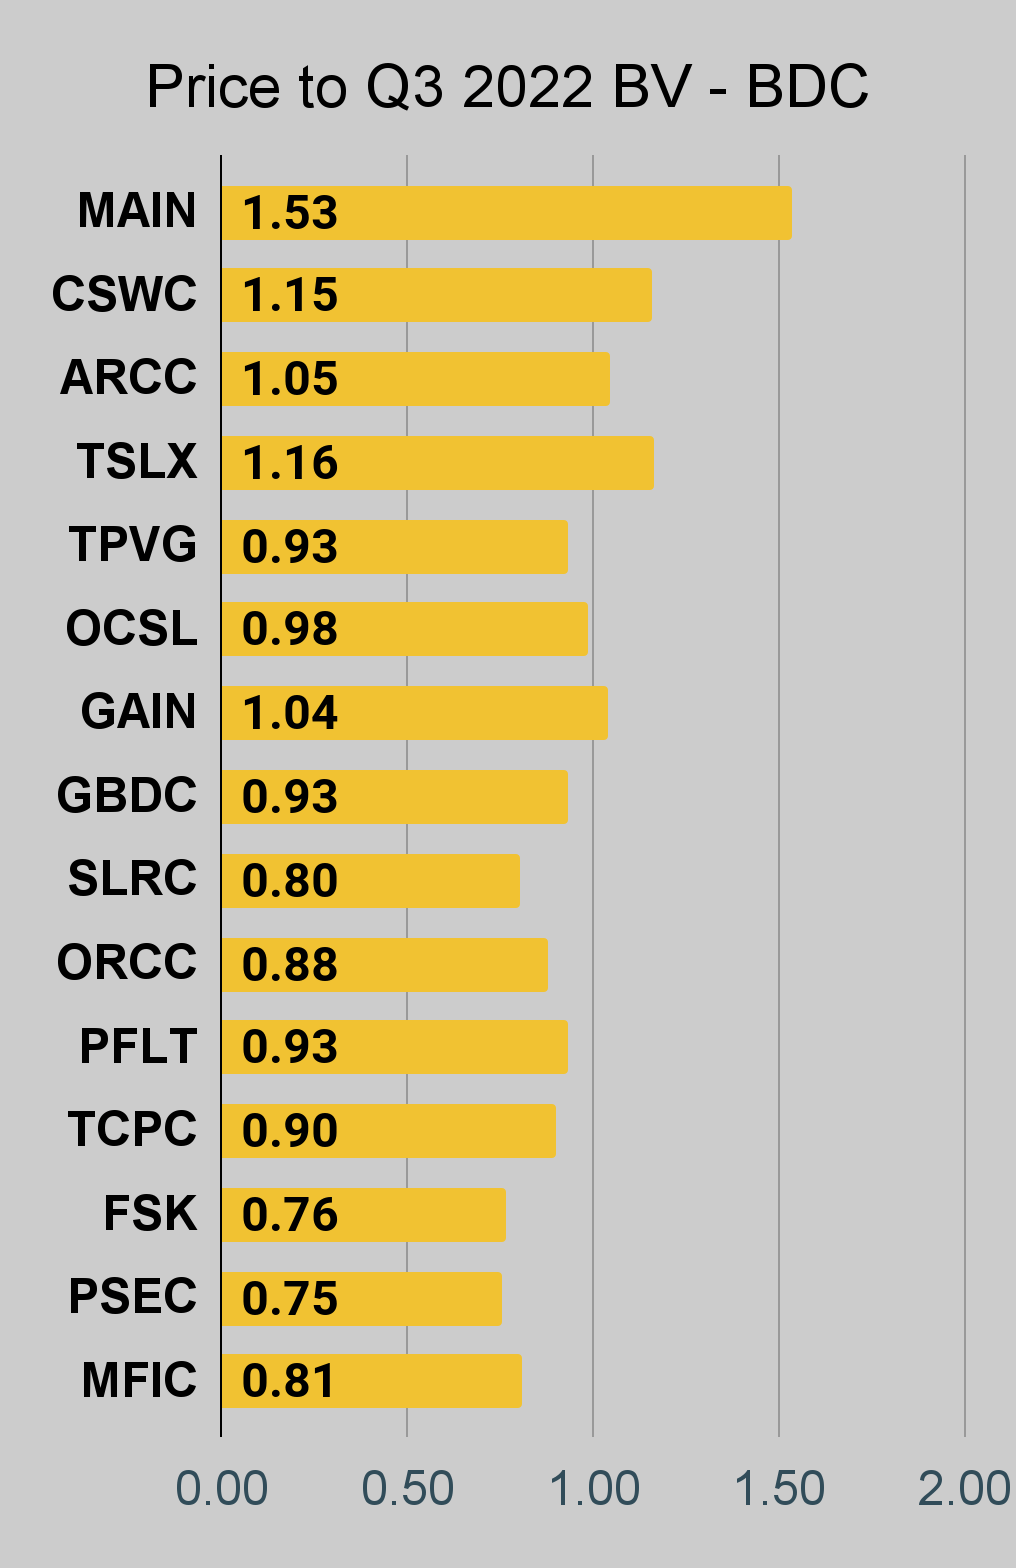
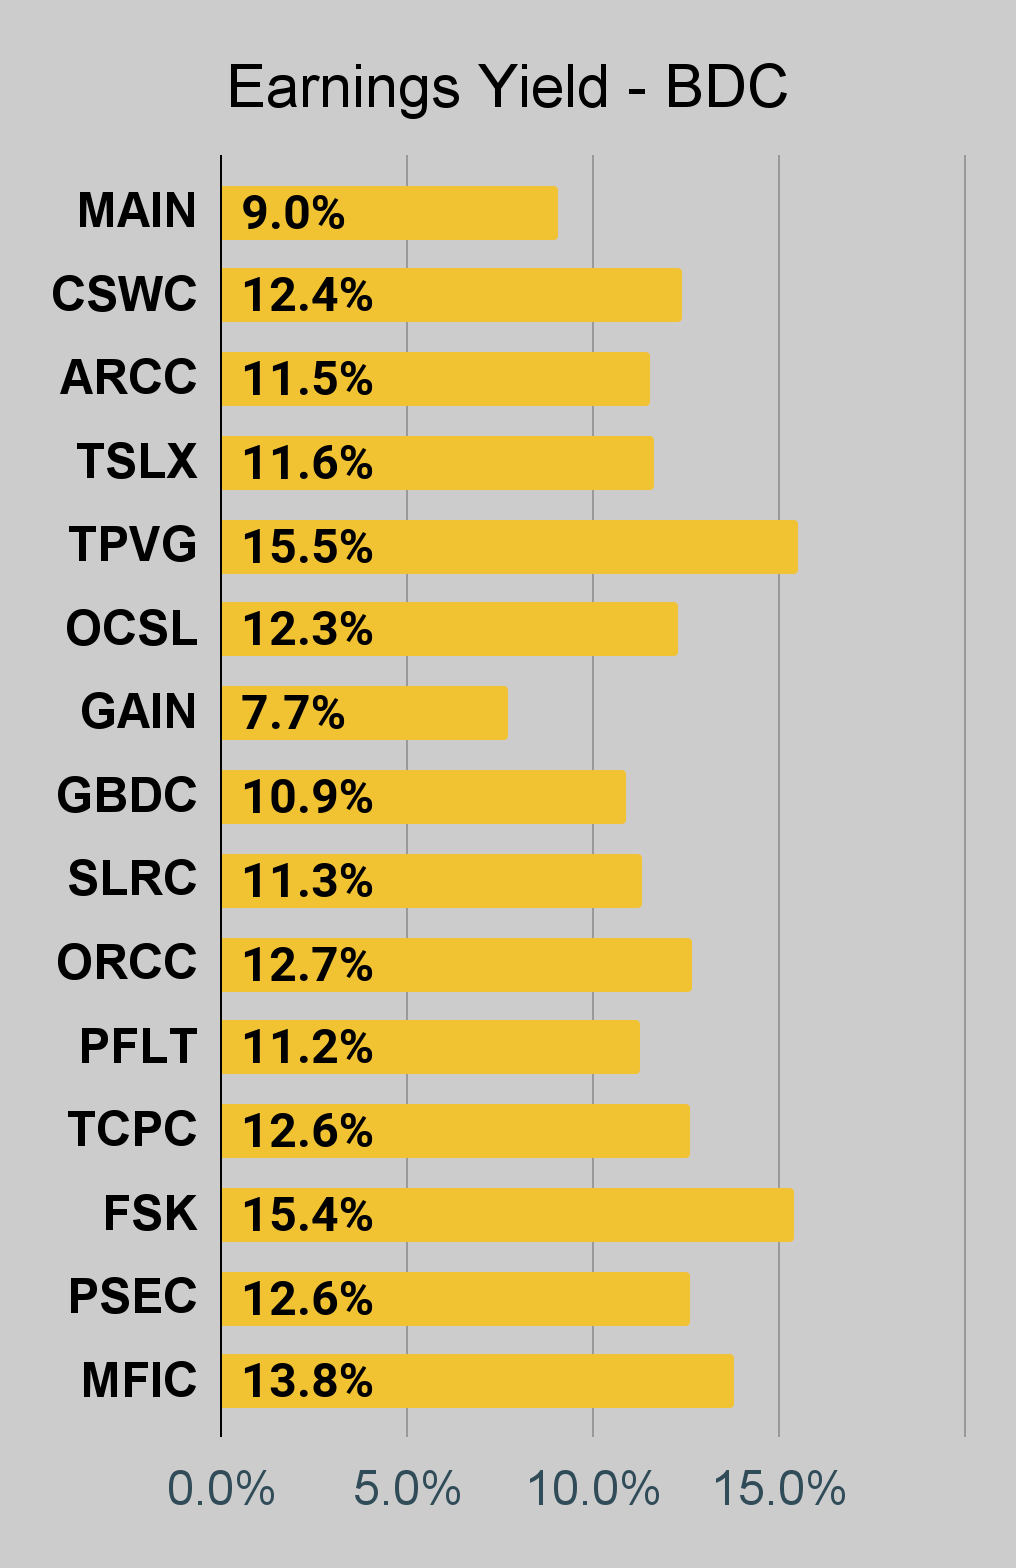
BDC Charts
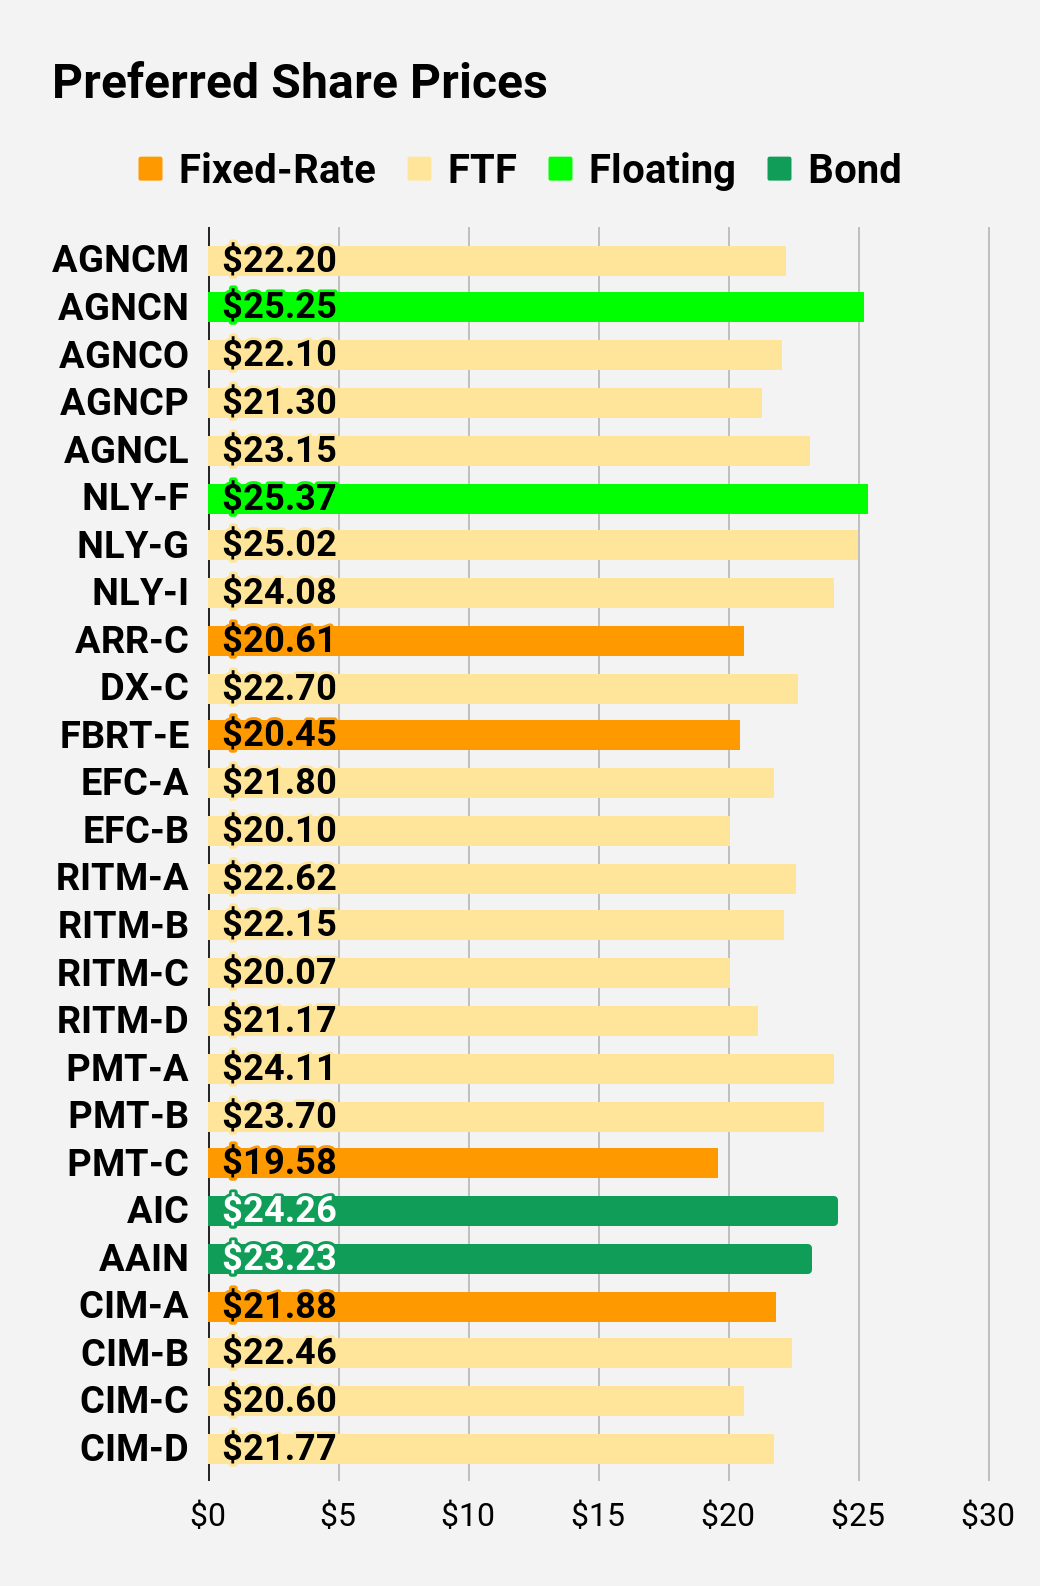
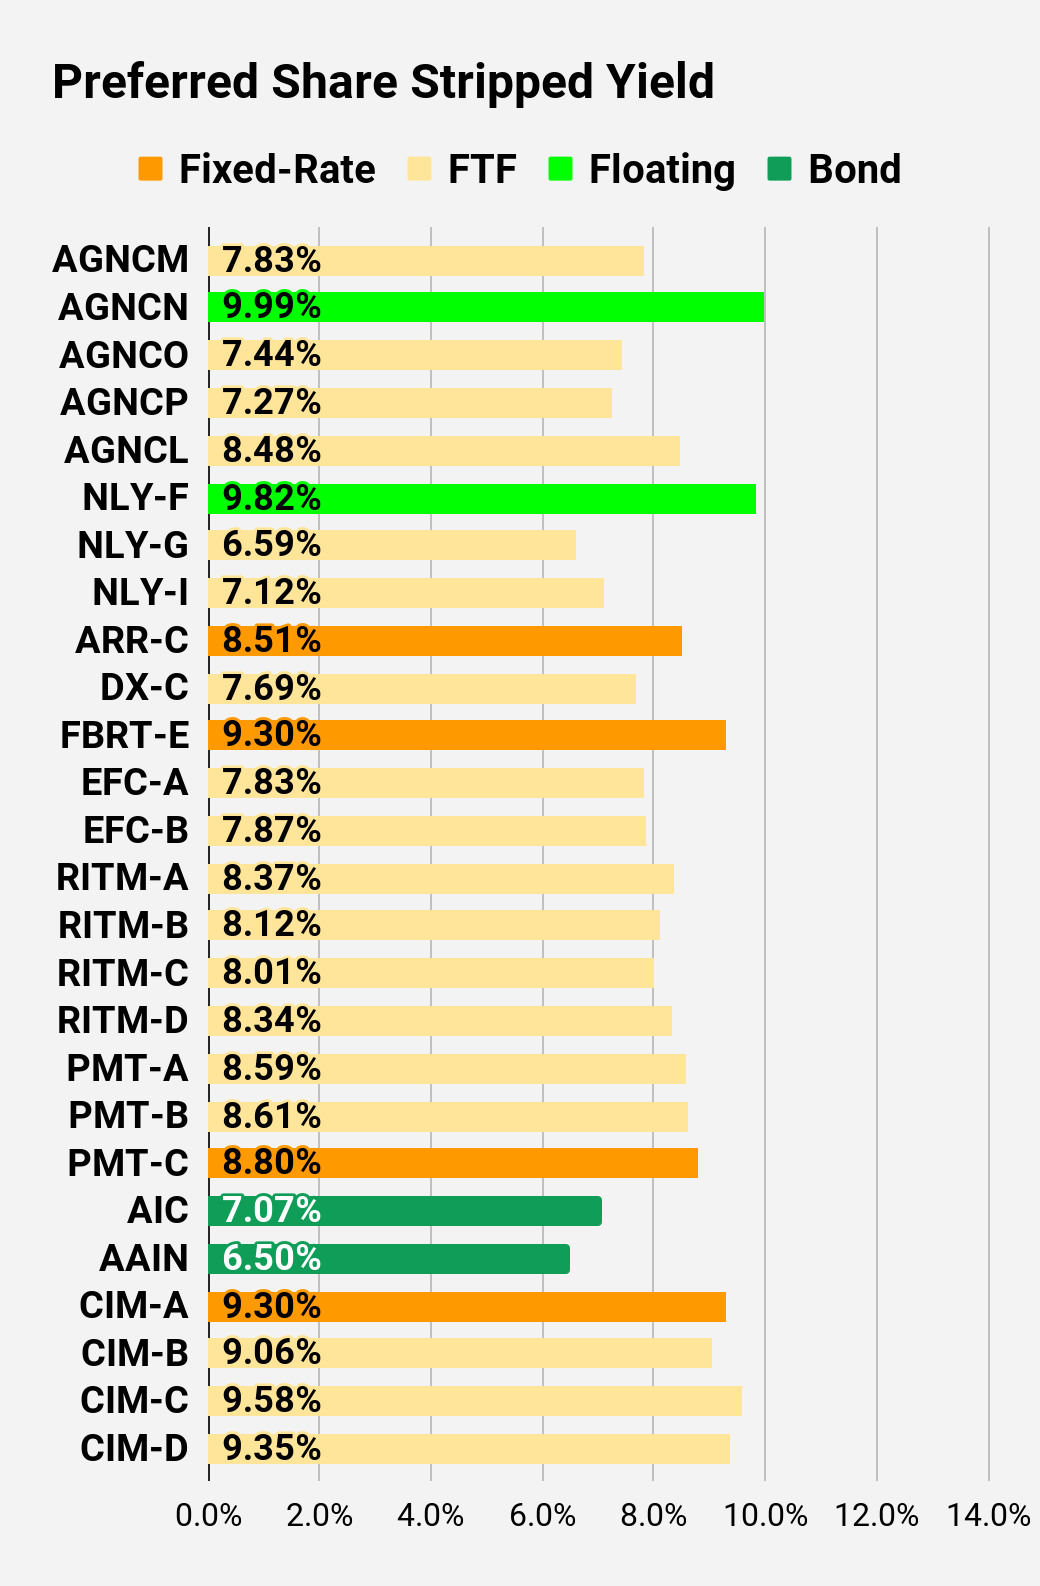
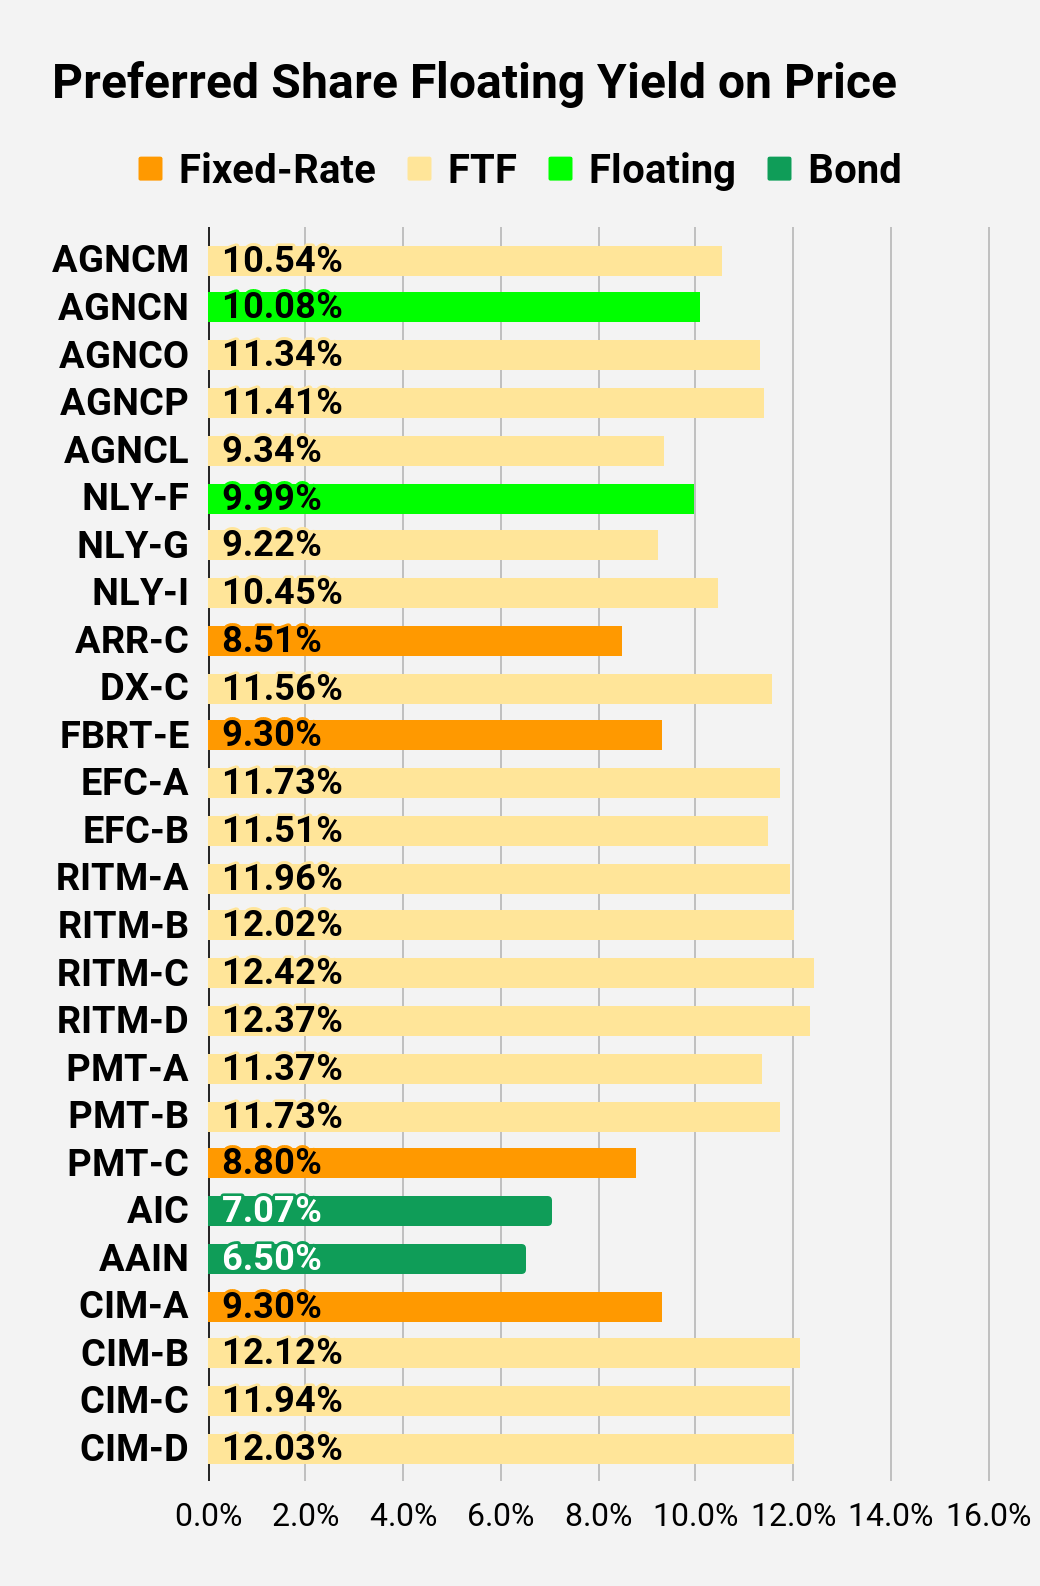
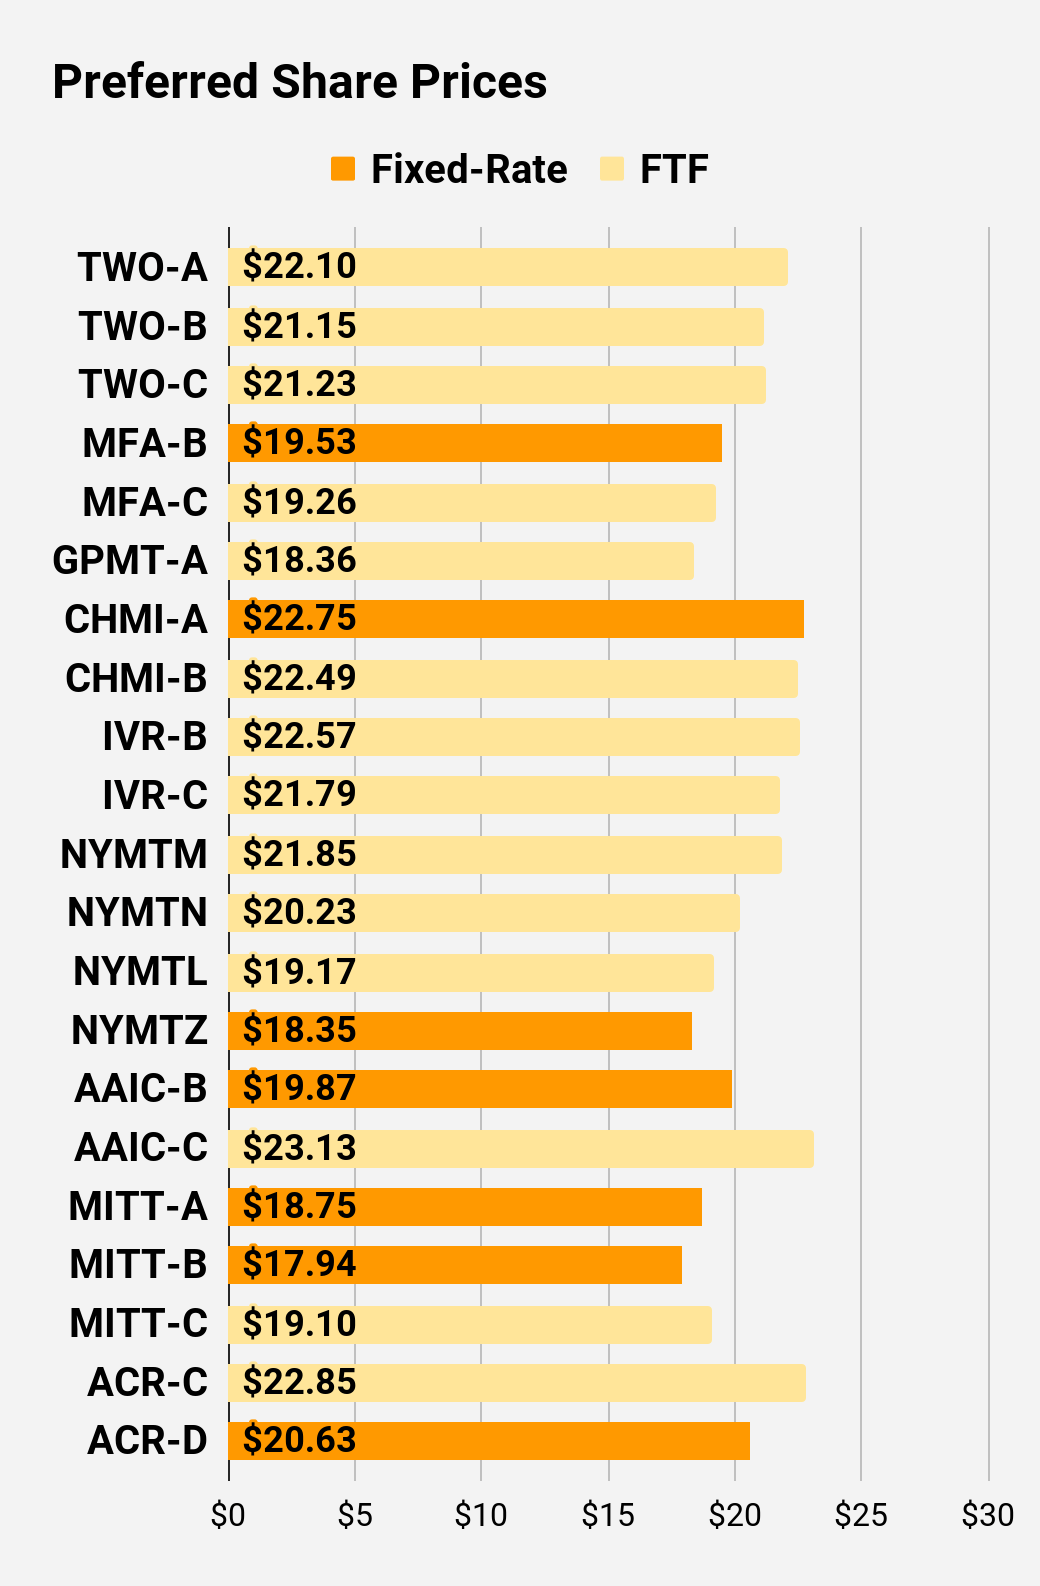
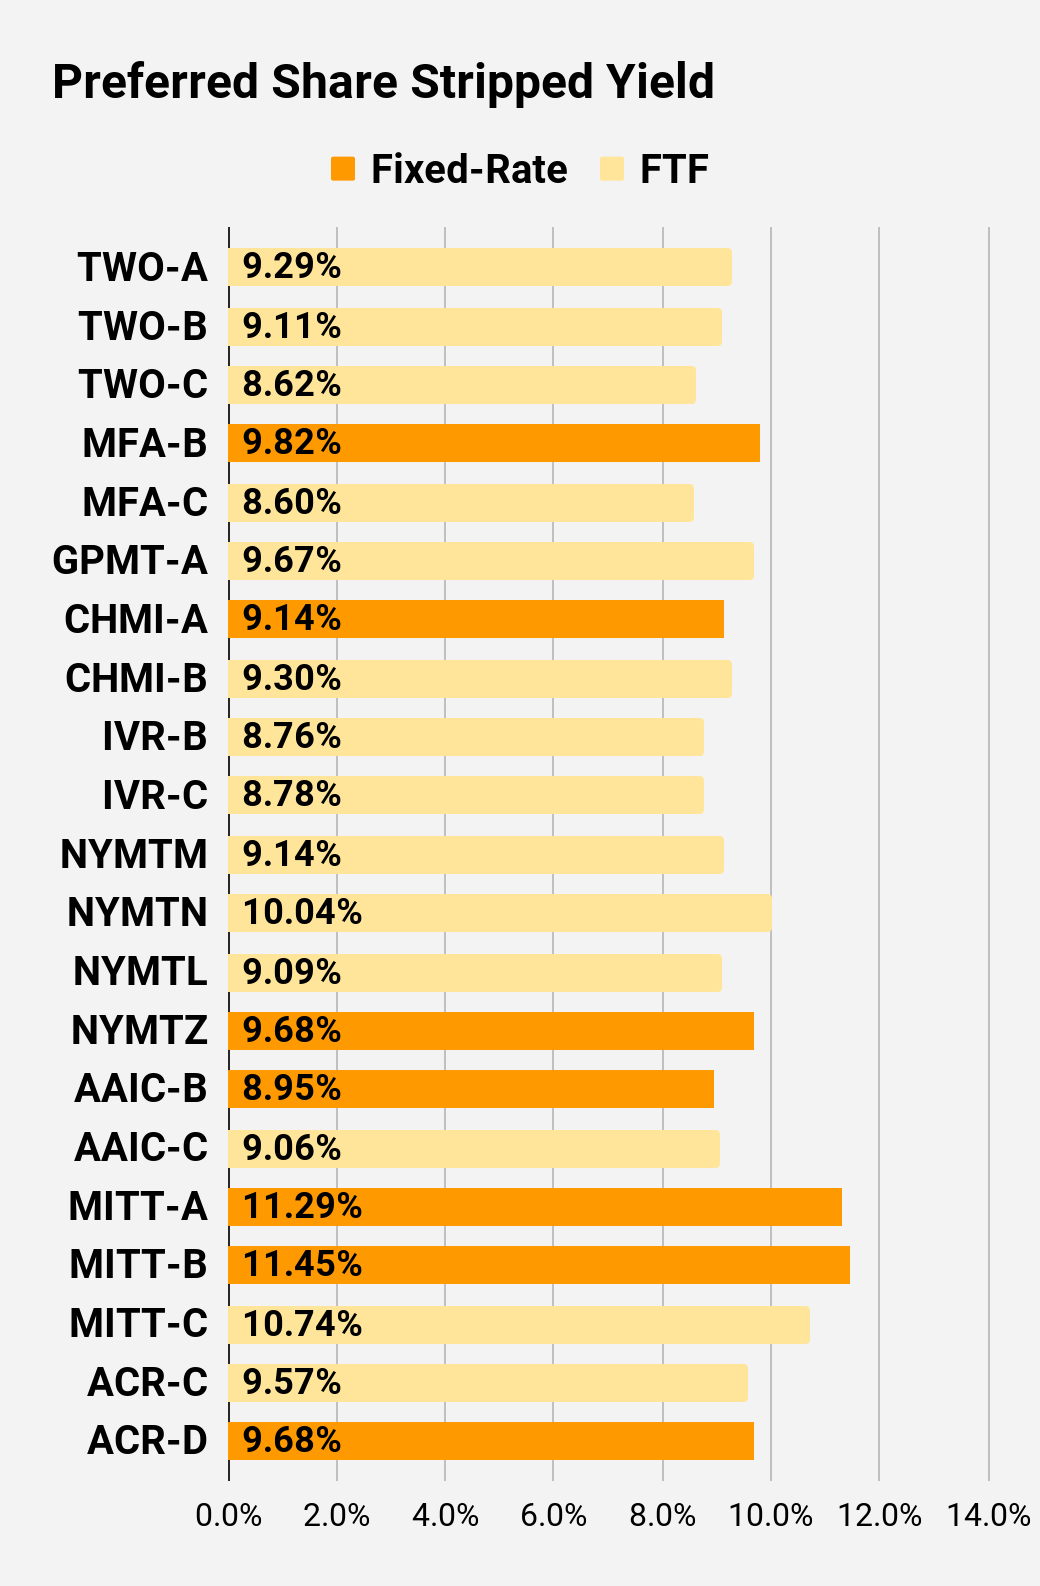
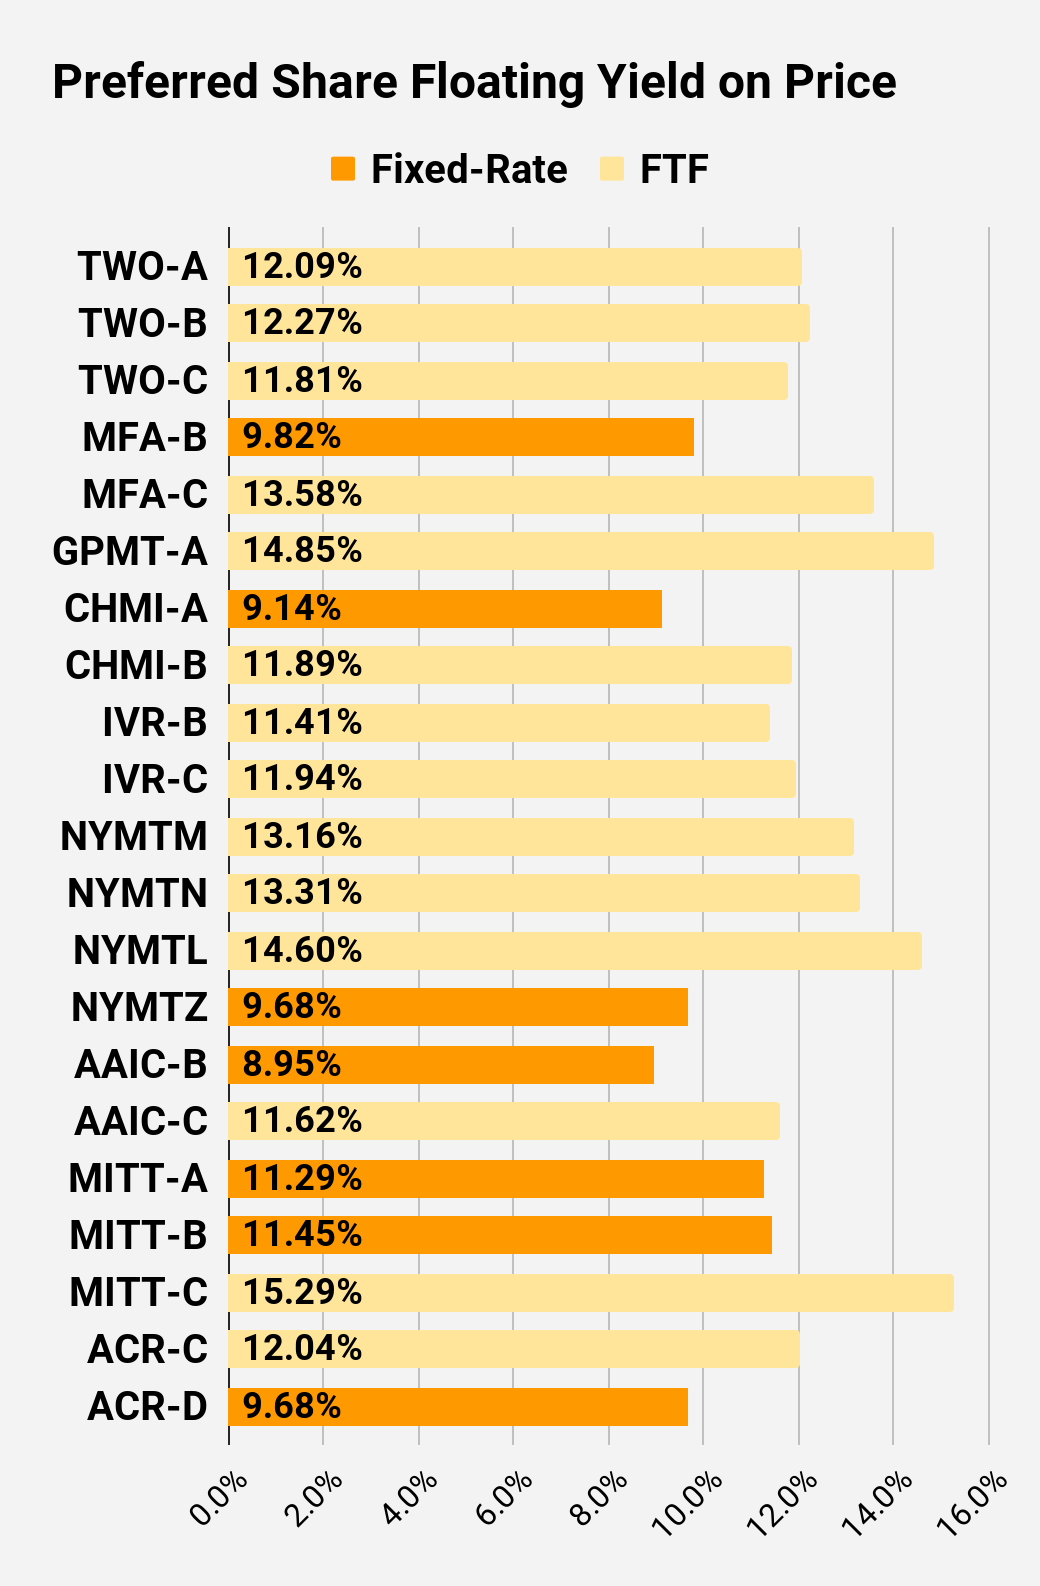
Preferred Share Charts
I changed the coloring a bit. We needed to adjust to include that the first fixed-to-floating shares have transitioned over to floating rates. When a share is already floating, the stripped yield may be different from the “Floating Yield on Price” due to changes in interest rates. For instance, NLY-F already has a floating rate. However, the rate is only reset once per three months. The stripped yield is calculated using the upcoming projected dividend payment and the “Floating Yield on Price” is based on where the dividend would be if the rate reset today. In my opinion, for these shares the “Floating Yield on Price” is clearly the more important metric.
Preferred Share Data
Beyond the charts, we’re also providing our readers with access to several other metrics for the preferred shares.
After testing out a series on preferred shares, we decided to try merging it into the series on common shares. After all, we are still talking about positions in mortgage REITs. We don’t have any desire to cover preferred shares without cumulative dividends, so any preferred shares you see in our column will have cumulative dividends. You can verify that by using Quantum Online. We’ve included the links in the table below.
To better organize the table, we needed to abbreviate column names as follows:
- Price = Recent Share Price - Shown in Charts
- BoF = Bond or FTF (Fixed-to-Floating)
- S-Yield = Stripped Yield - Shown in Charts
- Coupon = Initial Fixed-Rate Coupon
- FYoP = Floating Yield on Price - Shown in Charts
- NCD = Next Call Date (the soonest shares could be called)
- Note: For all FTF issues, the floating rate would start on NCD.
- WCC = Worst Cash to Call (lowest net cash return possible from a call)
- QO Link = Link to Quantum Online Page
| Ticker |
| Price |
| BoF |
| S-Yield |
| Coupon |
| FYoP |
| NCD |
| WCC |
| QO Link |
| P-Link |
| $22.20 |
| FTF |
| 7.83% |
| 6.88% |
| 10.54% |
| 4/15/2024 |
| $4.96 |
| $25.25 |
| Floating |
| 9.99% |
| 9.94% |
| 10.08% |
| 3/24/2023 |
| $0.23 |
| $22.10 |
| FTF |
| 7.44% |
| 6.50% |
| 11.34% |
| 10/15/2024 |
| $5.76 |
| $21.30 |
| FTF |
| 7.27% |
| 6.13% |
| 11.41% |
| 4/15/2025 |
| $7.15 |
| $23.15 |
| FTF |
| 8.48% |
| 7.75% |
| 9.34% |
| 10/15/2027 |
| $11.07 |
| $25.37 |
| Floating |
| 9.82% |
| 9.75% |
| 9.99% |
| 3/24/2023 |
| $0.20 |
| $25.02 |
| FTF |
| 6.59% |
| 6.50% |
| 9.22% |
| 3/31/2023 |
| $0.39 |
| $24.08 |
| FTF |
| 7.12% |
| 6.75% |
| 10.45% |
| 6/30/2024 |
| $3.46 |
| $20.61 |
| 8.51% |
| 7.00% |
| 8.51% |
| 1/28/2025 |
| $7.74 |
| $22.70 |
| FTF |
| 7.69% |
| 6.90% |
| 11.56% |
| 4/15/2025 |
| $6.18 |
| $20.45 |
| 9.30% |
| 7.50% |
| 9.30% |
| 3/24/2023 |
| $4.90 |
| $21.80 |
| FTF |
| 7.83% |
| 6.75% |
| 11.73% |
| 10/30/2024 |
| $6.17 |
| $20.10 |
| FTF |
| 7.87% |
| 6.25% |
| 11.51% |
| 1/30/2027 |
| $11.16 |
| $22.62 |
| FTF |
| 8.37% |
| 7.50% |
| 11.96% |
| 8/15/2024 |
| $5.21 |
| $22.15 |
| FTF |
| 8.12% |
| 7.13% |
| 12.02% |
| 8/15/2024 |
| $5.54 |
| $20.07 |
| FTF |
| 8.01% |
| 6.38% |
| 12.42% |
| 2/15/2025 |
| $8.14 |
| $21.17 |
| FTF |
| 8.34% |
| 7.00% |
| 12.37% |
| 11/15/2026 |
| $10.41 |
| $24.11 |
| FTF |
| 8.59% |
| 8.13% |
| 11.37% |
| 3/15/2024 |
| $3.43 |
| $23.70 |
| FTF |
| 8.61% |
| 8.00% |
| 11.73% |
| 6/15/2024 |
| $4.31 |
| $19.58 |
| 8.80% |
| 6.75% |
| 8.80% |
| 8/24/2026 |
| $11.66 |
| $24.26 |
| Bond |
| 7.07% |
| 6.75% |
| 7.07% |
| 3/24/2023 |
| $1.19 |
| $23.23 |
| Bond |
| 6.50% |
| 6.00% |
| 6.50% |
| 8/1/2023 |
| $2.52 |
| $21.88 |
| 9.30% |
| 8.00% |
| 9.30% |
| 3/24/2023 |
| $3.58 |
| $22.46 |
| FTF |
| 9.06% |
| 8.00% |
| 12.12% |
| 3/30/2024 |
| $5.04 |
| $20.60 |
| FTF |
| 9.58% |
| 7.75% |
| 11.94% |
| 9/30/2025 |
| $9.74 |
| $21.77 |
| FTF |
| 9.35% |
| 8.00% |
| 12.03% |
| 03/30/2024 |
| $5.73 |
Second Batch:
| Ticker |
| Price |
| BoF |
| S-Yield |
| Coupon |
| FYoP |
| NCD |
| WCC |
| QO Link |
| P-Link |
| $22.10 |
| FTF |
| 9.29% |
| 8.13% |
| 12.09% |
| 04/27/2027 |
| $11.53 |
| $21.15 |
| FTF |
| 9.11% |
| 7.63% |
| 12.27% |
| 07/27/2027 |
| $12.42 |
| $21.23 |
| FTF |
| 8.62% |
| 7.25% |
| 11.81% |
| 1/27/2025 |
| $7.40 |
| $19.53 |
| 9.82% |
| 7.50% |
| 9.82% |
| 3/24/2023 |
| $5.91 |
| $19.26 |
| FTF |
| 8.60% |
| 6.50% |
| 13.58% |
| 3/31/2025 |
| $9.40 |
| $18.36 |
| FTF |
| 9.67% |
| 7.00% |
| 14.85% |
| 11/30/2026 |
| $13.42 |
| $22.75 |
| 9.14% |
| 8.20% |
| 9.14% |
| 3/24/2023 |
| $2.56 |
| $22.49 |
| FTF |
| 9.30% |
| 8.25% |
| 11.89% |
| 4/15/2024 |
| $5.02 |
| $22.57 |
| FTF |
| 8.76% |
| 7.75% |
| 11.41% |
| 12/27/2024 |
| $6.33 |
| $21.79 |
| FTF |
| 8.78% |
| 7.50% |
| 11.94% |
| 9/27/2027 |
| $12.14 |
| $21.85 |
| FTF |
| 9.14% |
| 7.88% |
| 13.16% |
| 1/15/2025 |
| $7.10 |
| $20.23 |
| FTF |
| 10.04% |
| 8.00% |
| 13.31% |
| 10/15/2027 |
| $14.27 |
| $19.17 |
| FTF |
| 9.09% |
| 6.88% |
| 14.60% |
| 10/15/2026 |
| $12.28 |
| $18.35 |
| 9.68% |
| 7.00% |
| 9.68% |
| 1/15/2027 |
| $13.66 |
| $19.87 |
| 8.95% |
| 7.00% |
| 8.95% |
| 3/24/2023 |
| $5.44 |
| $23.13 |
| FTF |
| 9.06% |
| 8.25% |
| 11.62% |
| 3/30/2024 |
| $4.34 |
| $18.75 |
| 11.29% |
| 8.25% |
| 11.29% |
| 3/24/2023 |
| $6.76 |
| $17.94 |
| 11.45% |
| 8.00% |
| 11.45% |
| 3/24/2023 |
| $7.56 |
| $19.10 |
| FTF |
| 10.74% |
| 8.00% |
| 15.29% |
| 9/17/2024 |
| $9.37 |
| $22.85 |
| FTF |
| 9.57% |
| 8.63% |
| 12.04% |
| 7/30/2024 |
| $5.40 |
| $20.63 |
| 9.68% |
| 7.88% |
| 9.68% |
| 5/21/2026 |
| $10.89 |
Strategy
Our goal is to maximize total returns . We achieve those most effectively by including “trading” strategies. We regularly trade positions in the mortgage REIT common shares and BDCs because:
- Prices are inefficient.
- Long term, share prices generally revolve around book value.
- Short term, price-to-book ratios can deviate materially.
- Book value isn’t the only step in analysis, but it's the cornerstone.
We also allocate to preferred shares and equity REITs. We encourage buy-and-hold investors to consider using more preferred shares and equity REITs.
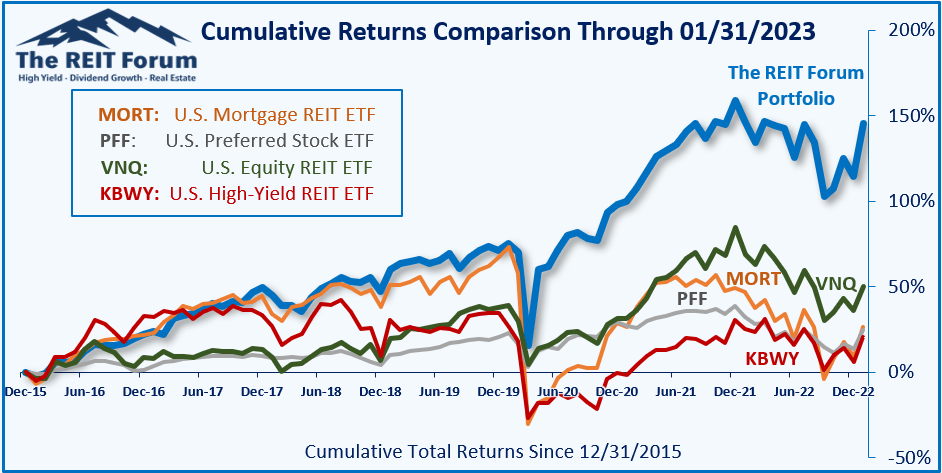
Performance
We compare our performance against four ETFs that investors might use for exposure to our sectors:
The REIT Forum
The four ETFs we use for comparison are:
| Ticker |
| Exposure |
| One of the largest mortgage REIT ETFs |
| One of the largest preferred share ETFs |
| Largest equity REIT ETF |
| The high-yield equity REIT ETF. Yes, it has been dreadful. |
When investors think it isn’t possible to earn solid returns in preferred shares or mortgage REITs, we politely disagree. The sector has plenty of opportunities, but investors still need to be wary of the risks. We can’t simply reach for yield and hope for the best. When it comes to common shares, we need to be even more vigilant to protect our principal by regularly watching prices and updating estimates for book value and price targets.
Ratings: Neutral on TPVG. Bearish on CHMI.
For further details see:
Double-Digit Dividend Yield Dropped