SPSM - Dow Theory Sell Signal
2023-12-19 20:32:51 ET
Summary
- The Dow Jones Industrials have reached new all-time highs in December, but the Dow Transportation calculation is failing to confirm the rise.
- Dow Theory suggests the market is healthy when industrial and transportation names are advancing together.
- Lagging action in the utility and banking sectors during 2023 may also signal trouble ahead for the overall market.
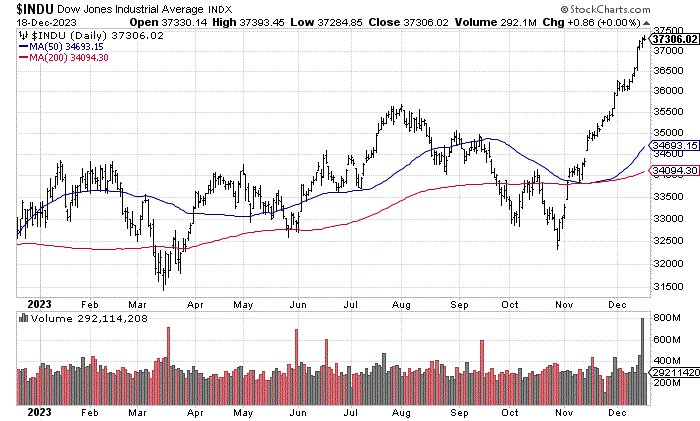
It's becoming quite clear in December that the sharp rise in the Dow Jones Industrial ( DJI ) average to both new 52-week and all-time price highs is not being confirmed by sector averages, particularly the Dow Jones Transportation ( DJT ) calculation. As such, lagging performance in the transportation stocks could be telling us the economy is not in great shape. In other words, the whole +15% upmove in U.S. stocks since October may prove a temporary condition, not the beginning of a multi-year bull trend.
In conjunction with an extreme in bullish sentiment (both in surveys and through trading action) over the last several weeks, which I wrote about yesterday here , Wall Street could be skating on thin ice over the winter months. While a Dow Theory sell signal can be early in its warning to investors, expecting lower prices vs. today at some point during 2024 looks to be a safe bet (January, April, October - I cannot say for sure). Without an actual drop in short-term bank interest rates soon, projecting a retest of the stock market lows reached 8 weeks ago is a distinct possibility sooner or later. Let me explain why.
What Is the Dow Theory?
The Dow Theory was developed by Charles H. Dow . He founded the Dow Jones & Company with Edward Jones and Charles Bergstresser , developing the Dow Jones Industrial average in 1896. He explained his Dow Theory for market forecasting through a number of editorials in the Wall Street Journal , which he also co-founded.
Basically, the Dow Theory believes the market is in a healthy upward trend as long as industrial and transportation names are advancing together. When one Dow Jones average is able to jump above a previous important high, it should be followed by a similar advance in the other index.
In statistical terms, the vast majority of market peaks have witnessed the Dow Industrials as one of the last averages to outline a price high, with other indexes falling first. Sometimes, the DJ Transports diverge by a few days, sometimes several weeks, many times for months, like today. One typical topping pattern looks a lot like today's circumstance, where the Dow Transports do not confirm a 3-month to 6-month trend move higher in the Dow Industrials.
Is this a perfect indicator with 100% accuracy over the last century? No, but in hindsight at least a few days of divergent price action have been present about 90% of the time, reviewing the -10% or greater broad market declines I have experienced and researched since 1986 (including the fateful October 1987 stock market crash of -40%, September-October 2007 peak before the Great Financial Crisis and -50% equity dump into early 2009, plus the original tech bubble peak of late 1999 to 2000 including the historic -90% drop in technology stocks by 2002.).
If you want to dig deeper, there are other Dow Theory aspects to watch like volume patterns, determining which of 3 phases of buying and 3 phases of selling fit best (kind of like Elliott Wave counting), plus what counts as a trend reversal. In this article I am focusing on price patterns.
Our Bearish December Setup
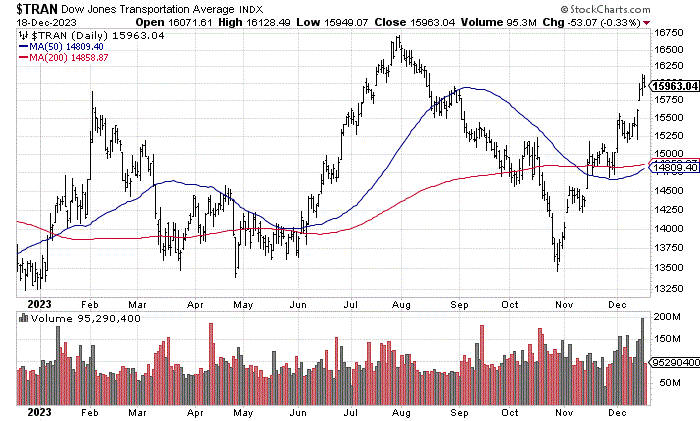
What has me quite concerned about the market zigzags going into 2024 is the obvious and straightforward Dow Transportation divergence for price. On both an intermediate and long-term basis vs. the 52-week and all-time high Dow Industrial levels reached this December, the Transportation average is not performing nearly as well.
I have marked both signals with red arrows below. The DJ Transports peaked in July at a lower level than its all-time high achieved in November 2021. We have yet to break above the July highs, creating a non-confirmation warning vs. the streaking DJ Industrial average.
YCharts - Dow Industrials vs. Transports, Daily Price Change, Since July 2023, Author Reference Point YCharts - Dow Industrials vs. Transports, Daily Price Change, Since November 2021, Author Reference Point
I have drawn a 52-week chart of daily price and volume trading action for each index below. There are two possible resolutions to the divergence. Either the industrial names (and Wall Street generally) pull back substantially or transportation stocks need to get into gear and rise faster.
StockCharts.com - Dow Jones Industrials, Daily Price & Volume Changes, 12 Months StockCharts.com - Dow Jones Transports, Daily Price & Volume Changes, 12 Months
Some Past Examples
To make the concept more understandable, let's review a number of Dow Industrial peaks since 2015. Believe it or not, the August market top months ago experienced a minor divergence between industrial and transport stocks, which was followed by our -10% market correction into late October.
On a 52-week trading basis, the DJ Transports peaked only a few days before the August 1st top in the Dow Industrial average. If you weren't paying attention in real time, you may have missed it. I have marked the topping price action and minor Dow Theory sell indication again with a red arrow below.
YCharts - Dow Industrials vs. Transports, Daily Price Change, July-October 2023, Author Reference Point
At the long-term top in the market during late 2021 and January 2022, the Dow Transportation average warned of trouble by several months. Peaking in November, a Dow Theory sell signal was issued during the last 2 weeks of Dow Industrial all-time high achievements in December and January.
YCharts - Dow Industrials vs. Transports, Daily Price Change, Nov 2021-Feb 2022, Author Reference Point
If you want an example of long-term divergence, we can look back at the 2018-20 period leading up to the COVID-19 pandemic market tank of -30% over a couple of months in duration. The DJ Transports peaked in September 2018. In hindsight, one could read the whole 17-month span thereafter as a long-term warning to get out and wait for lower prices to eventually appear.
Specifically, the second-half 2018 -20% market decline was predated by a Dow Theory sell signal weeks in advance of the final Dow Industrial top. A 12-month high in the Dow Industrials was not outlined again until July 2019, which witnessed a far weaker and lagging DJ Transportation average. This was quickly followed by a -6% market decline. The end of 2019 (boxed in red) saw a string of divergence action on new industrial stock highs, without an immediate drawdown. Then, you could argue a 52-week trading history buy signal reversal occurred in January 2020 for several trading days (although a multi-year sell remained in effect), until a new short-term sell signal appeared in February, right before the pandemic selloff.
YCharts - Dow Industrials vs. Transports, Daily Price Change, Jun 2018-Mar 2020, Author Reference Points
Lastly, a February-May 2015 peak was outlined by the DJ Industrials, not confirmed by trading action in the Dow Transports. A -15% Dow Industrial correction played out next into August, with the Transports moving much lower into early 2016.
YCharts - Dow Industrials vs. Transports, Daily Price Change, Jan 2015-Feb 2016, Author Reference Points
Final Thoughts
No indicator is perfect. What are the timing problems for Dow Theory tracking? The Dow Theory sell signal can last for months before the DJ Industrials, S&P 500 and Nasdaq 100 indexes actually turn lower in price. The exact timing of a major downturn cannot be determined readily or easily.
Second, a minor industrial name selloff of -5% to -7% may reverse higher with the Dow Transports running to yearly highs, igniting a new buy signal. This situation arises all the time, where you can miss an upturn in the market. To a degree that's what happened from the end of October this year. A regular -10% correction in price morphed into new yearly highs for the Dow Industrials in rapid fashion.
There is plenty of debate on what to do with a new Dow Transportation high, not confirmed by the Dow Industrials. The track record for such is very mixed. Often, the overall market will go lower despite strength in transportation names if a recession is involved (this occurred in the first half of 2008). Other times, gains in transports lead the rest of the market to the upside.
In addition, you can experience a sell signal over months, that flips back to buy when the transportation stocks rally to new highs. This happened in 2016 and to a minor degree during late summer 2021. The Dow Theory is far from fool proof. Yet, when we witness a clear price divergence in the two sector averages like today, I do get nervous. The odds of a price downturn greater than -5% increase dramatically, with drops often happening immediately thereafter.
Other Sector Non-Confirmation Issues
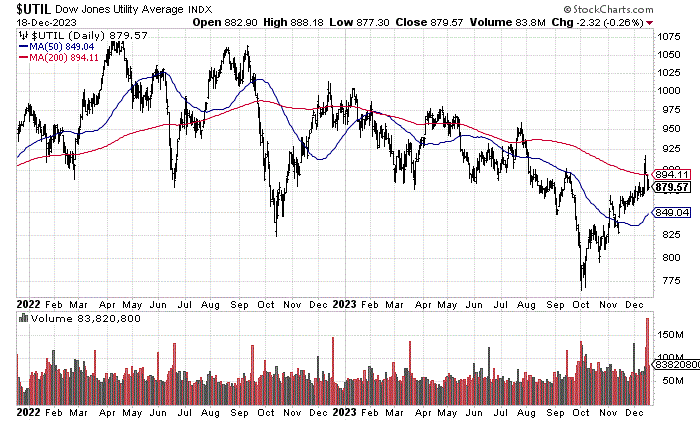
In my research diverging or lagging action in the interest-rate sensitive utility and banking sectors can also be a useful signal of trouble ahead for the whole market. When these two industries are diverging in action with the Dow Transports (singing the same bearish tune), investing risks over the next 6-12 months are abnormally high historically.
Specifically in late December, the Dow Jones Utility average has failed to reach a new 52-week high and is a large distance away from its April 2022 all-time peak. My readout is the DJ Utility chart pattern is the worst for divergent price action since 1994.
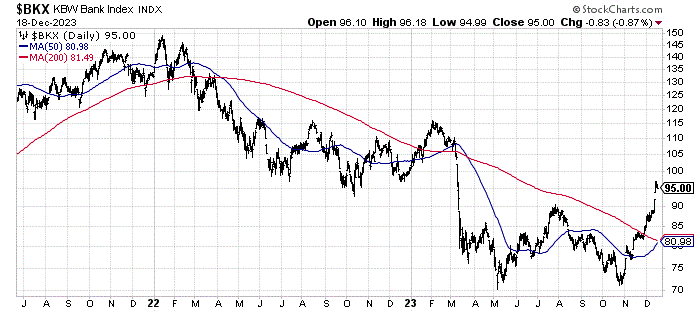
StockCharts.com - KBW Bank Index, Daily Price & Volume Changes, Since December 2021
Banks, especially regional ones, have definitely been hit hard since early 2022 by the modern record increase in bank lending rates at the Federal Reserve. Overall credit creation has been negative during the last 18 months in the banking system for the first time since the 2008-09 Great Recession turmoil. While the KBW Bank Index has enjoyed a wonderful advance since October, it remains far away from the February yearly high or all-time level of January 2022. You have to go back to 2011-12, then 1999-2000 to find other instances of a multi-year bank divergence vs. new Dow Industrial all-time highs.
StockCharts.com - KBW Bank Index, Daily Price Changes, Since July 2021
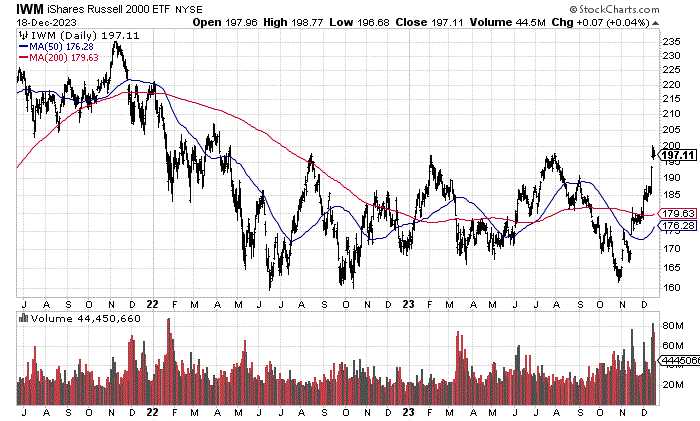
Lastly, I will admit strength in the smaller capitalization area of the market since late October has been really good news. The iShares Russell 2000 ETF ( IWM ) was able to reach a new 52-week high several days ago. Many pundits believe the rally broadening into more names, and away from the overly-concentrated 2023 advance by Big Tech and Magnificent 7 stocks is a bullish trend changing event. However, the main Russell index still needs to gain another +20% before all-time highs from November 2021 are breached. What if the broadening advance turns out to be just a sector rotation idea, not a long-term shift change? It doesn't take much capital moving from blue chips or cash on the sidelines to get small caps advancing for a spell.
StockCharts.com - iShares Russell 2000, Daily Price & Volume Changes, Since July 2021
So, when we pull all the longer-term divergent action in various sectors of the market together including our Dow Theory warning (measured from late 2021 and July 2023), today's Dow Industrial all-time high level may not be able to hold for very long.
If you are fully invested in stocks and bullish for 2024, you have to be praying for better strength in the Dow Transports, Dow Utilities, banks, and small caps to support your view. If the health of our late 2023 advance is not confirmed soon, we could be in for a rocky ride on Wall Street.
Now may be a smart time to lighten up on SPDR Dow Industrial ETF ( DIA ) holdings in favor of cash investments yielding a solid 5% annually. Other broad index creations like the SPDR S&P 500 ( SPY ), Vanguard S&P 500 ( VOO ), Vanguard Total Stock Market ( VTI ), Invesco NASDAQ 100 ( QQQ ), and iShares Russell 2000 may be in the process of turning over soon. Scaling back your portfolio's U.S. equity weighting in general through hedges, from owning put options to selling covered calls, may also prove a productive endeavor.
Thanks for reading. Please consider this article a first step in your due diligence process. Consulting with a registered and experienced investment advisor is recommended before making any trade.
For further details see:
Dow Theory Sell Signal