DRETF - Dream Office REIT: Still A Sell For Us
2024-01-09 11:27:18 ET
Summary
- Dream Office REIT's significant underperformance relative to Canadian REIT indexes was justified by the supply/demand imbalance caused by COVID lockdowns and WFH.
- Dream's sponsor and external manager, Dream Unlimited, significantly reduced its stake during the recent SIB, indicating low confidence in Office and casting further doubt on its reported NAV.
- Its reliance on unit repurchases to preserve key metrics is insufficient to offset negative fundamental trends, and ongoing insider selling post-SIB raises concerns.
Summary
Dream Office Real Estate Investment Trust ( D.UN:CA / DRETF / "Dream") is an externally managed office REIT focused on downtown Toronto. Like most office REITs, it has suffered a tremendous sell-off in the past several years. We wanted to look at the office sector to determine if the immense pessimism around the sector is warranted and look for deep-value opportunities. We have concluded that the sell-off and underperformance relative to the broader REIT index were justified, at least in the case of Dream. COVID lockdowns and the lingering prevalence of WFH have created a profound supply/demand imbalance. Dream has managed to offset unfavorable market dynamics through unit repurchases, but the damage is still evident.
Furthermore, Dream's sponsor/external manager, Dream Unlimited, significantly reduced its stake in the REIT through the substantial issuer bid ("SIB") in June '23. Dream looks like a pure financial engineering play to us with no end in sight to the pain of a heavily oversupplied market. Financial engineering generally only works to accelerate positive trends, and common equity holders rarely benefit when it is used to offset negative fundamental trends. While rate cuts may help close its discount to NAV, a likely distribution cut, the ongoing oversupply, and consistent insider selling post-SIB are enough to keep us on the sidelines.
History
Dream is an office REIT externally managed by Dream Unlimited with a portfolio predominantly concentrated in downtown Toronto. It has undergone a significant capital recycling program over the past 8 years, exiting several non-core markets to focus on its key downtown Toronto portfolio. In 2016, it owned 166 properties with ~23MM owned sqft across the GTA, Ottawa, Montreal, Southwestern Ontario, Atlantic Canada, Regina, Saskatoon, Edmonton, Calgary, Yellowknife, BC, and the US. It now owns 26 income-producing properties, with an additional 2 under development, with ~4.9MM sqft of GLA. Excluding the 2 properties under development, ~65% of owned GLA is in downtown Toronto, with the remainder spread across "Other Markets". The Other Markets segment includes the GTA (Scarborough & Mississauga), Regina, Saskatoon, Calgary, and the US.
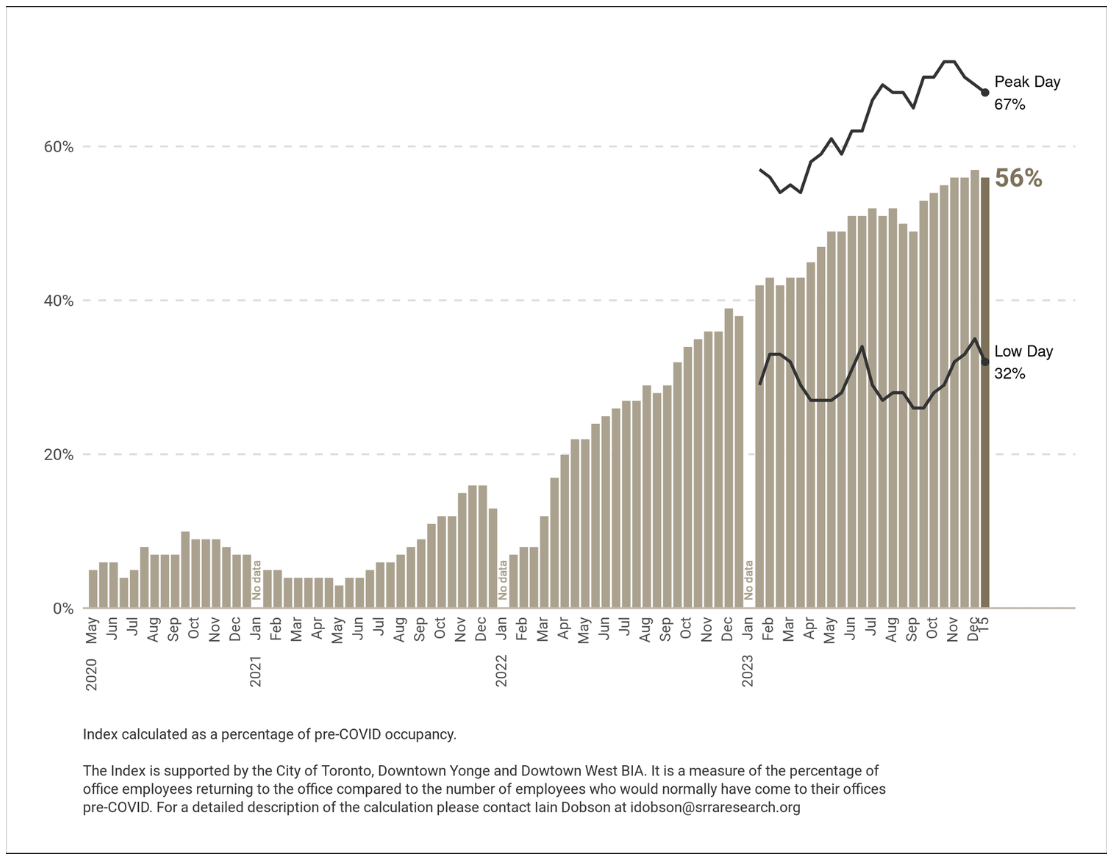
The impacts of COVID lockdowns on office properties are well-known and extensively documented elsewhere, so we will not go into depth on that topic here. In-office attendance in the downtown Toronto core has been stronger than what we've seen in many other major North American cities and suburban markets. Toronto's heavy skew towards professional and financial services, industries with a strong bias towards in-office attendance, has underpinned the recovery. We have no interest in making specific forecasts of the future path of office attendance. However, the peak day attendance figure of 71% is a reasonable approximation of the upper range of where the recovery could peak in the medium term. At ~70% recovery, on average, employees spend ~3.5 days in the office per week. Anecdotally, we see this as reasonable, with many companies offering 1-2 days of WFH per week. This data and recent leasing data from Dream and Canadian office peers confirm that offices are still in demand and viable. However, there is still plenty of uncertainty around future RTO mandates and the implications for the equilibrium point of supply. The impacts of these trends on portfolio occupancy, lease rates, and leasing costs are discussed later.
Downtown Toronto Occupancy Index (SRRA)
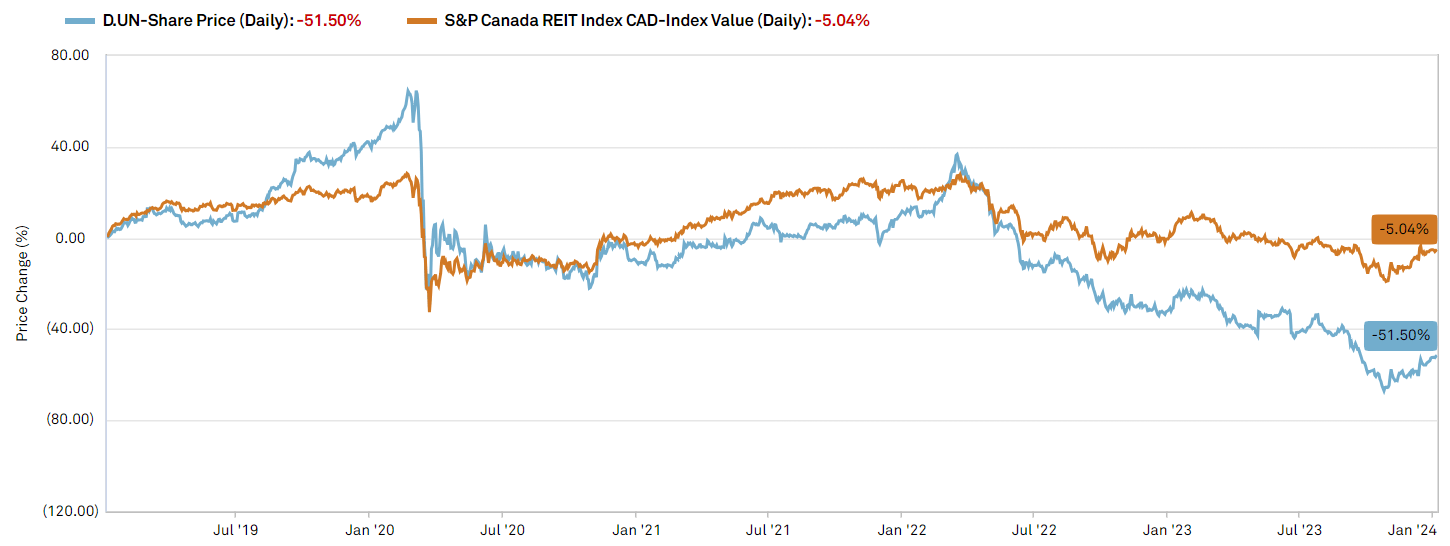
Despite the obvious necessity of office space for many industries and the recovery data above, office REITs have suffered tremendous pain in the public markets throughout '22 and '23. In the initial COVID sell-off, performance was largely in line with the broader Canadian REIT index. Like other affected REIT sectors, the market believed everything would return to "normal" after lockdowns were lifted. By '21, the narrative began to shift more bearish on offices due to the persistence of WFH. Through '22 and '23, rising interest rates fueled the fire of the ever more bearish narrative around office REITs as office attendance recovery lagged expectations. Increasing vacancy and elevated new supply led to softening market rents while leasing and build-out costs exploded. This degradation in fundamentals further contributed to office REITs' "untouchable" status.
Dream Office Share Price Performance (Capital IQ)
In an attempt to buoy its sinking share price, Dream's management initiated a substantial issuer bid ("SIB" is essentially a tender offer) in June '23. The SIB offered to repurchase 12.5MM units for $15.50 per unit and was financed by its sale of 12.5MM units of its stake in Dream Industrial REIT for $14.20 per unit, reducing Dream's unit count by ~25%. Notably, Dream Unlimited sold ~7.8MM of its units in Dream through the SIB, reducing its ownership stake from ~40% to ~33%. While its ~33% stake is still significant, we believe the decision to sell the maximum number of shares possible under the SIB was a clear statement about top management's conviction in REIT and their reported NAV of ~$32.6 per unit in the quarter prior to the SIB. We believe that if management truly believed in their +$30 NAVPU, why sell as many units as possible at a ~50% discount? Despite rallying ~42% off its low of $7.52, Dream is still trading ~30% below the SIB price, and management has continued selling small numbers of units. We view this insider selling, especially at prices significantly below the SIB price, as a confirmatory data point for our Sell rating.
Portfolio Snapshot
Dream's owned portfolio comprises 28 properties with ~4.9MM sqft of gross leaseable area ("GLA"). Its downtown Toronto portfolio has 17 properties with ~3.2MM sqft of GLA. Its Other Markets segment has 9 properties with ~1.7MM sqft of GLA, largely in Calgary and the GTA.
Portfolio Snapshot (Empyrean; Dream)
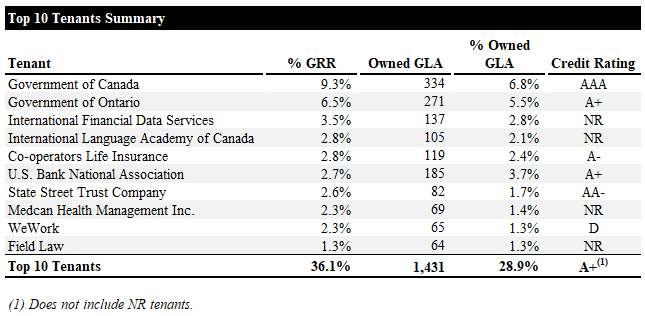
Its top 10 tenants account for ~36% of gross rental revenue ("GRR") and ~29% of owned GLA, with an average credit rating of A+ (n.b., excluding NR tenants) due to the significant contribution of government and financial tenants. Note that WeWork, which is in bankruptcy, accounts for ~2.3% of GRR and 1.3% of GLA.
Top 10 Tenants Summary (Empyrean; Dream)
With an average A+ credit rating across its top tenants, and nearly 80% of all tenants in the professional services, finance and insurance, and governmental sectors, we like the tenant profile.
Recent Performance
Earnings & Cash Flow Evolution
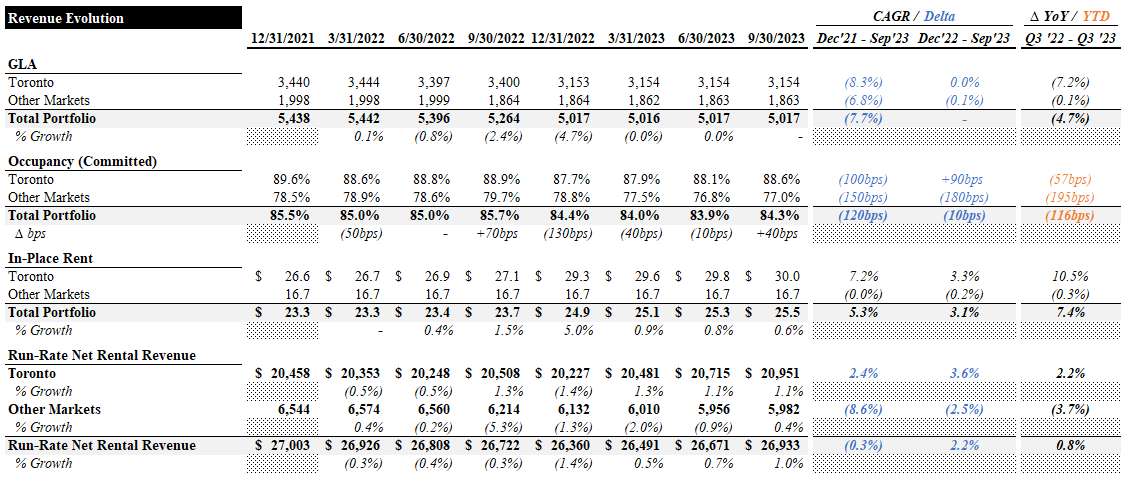
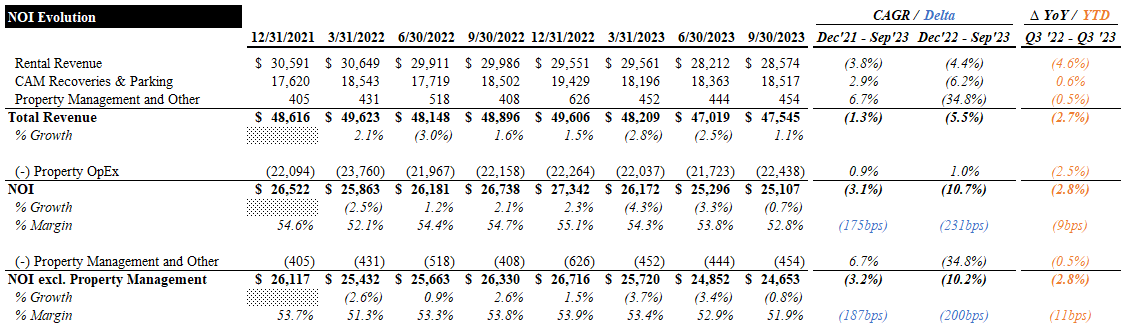
In this section, we unpack the drivers of Dream's earnings and cash flow evolution from Q4 '21 to Q3 '23. In the table below, we imputed run-rate rental revenue for its portfolio by segment based on GLA, in-place rent, and occupancy.
GLA decreased by ~8% in Toronto and ~7% in Other Markets. Occupancy decreased modestly in Toronto but has declined ~200bps YTD in Other Markets. Rent growth has been strong in Toronto, growing at a ~7% CAGR, but remained essentially flat in Other Markets. Although rent growth in Toronto appears strong at first glance, an explosion in leasing costs and tenant incentives has negated this.
Revenue Evolution (Empyrean; Dream)
Reported rental revenue over this period declined at a ~4% CAGR and was partially offset by a ~3% and ~7% CAGR in common area maintenance ("CAM") recoveries and parking, and property management and other revenue, respectively (n.b., total revenue declined at a ~1% CAGR). Property opex grew at a modest ~1%, causing NOI to decline at a ~3% CAGR. NOI margins have compressed ~9bps YoY.
NOI Evolution (Empyrean; Dream)
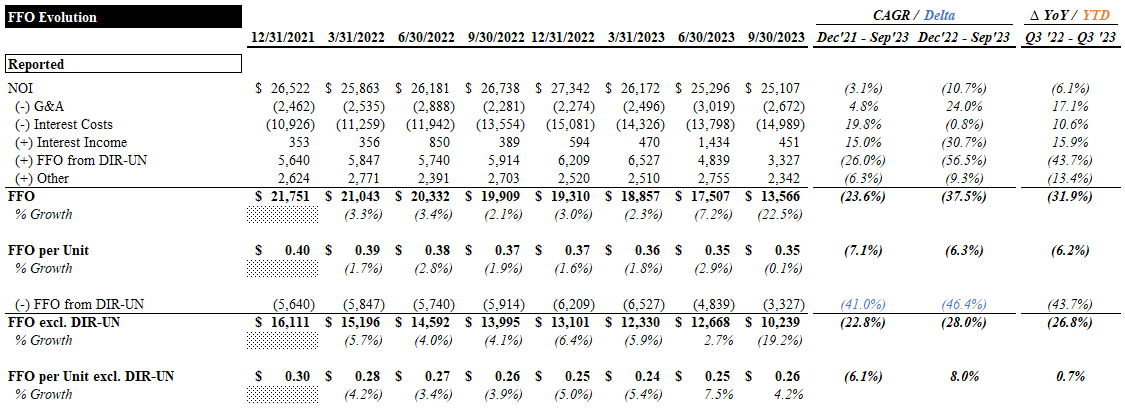
Despite the lackluster asset-level performance, G&A expenses grew at a ~5% CAGR. Net interest costs increased at a ~20% CAGR (n.b., ~10% increase YoY through YTD '23). The FFO contribution from DIR decreased due to the aforementioned sale of 12.5MM units to fund the SIB. Total FFO over the period declined at a ~24% CAGR or ~7% per unit.
FFO Evolution (Empyrean; Dream)
As Dream does not report AFFO, we calculated our own by adjusting reported FFO for non-recoverable capex, leasing costs, and straight-line rent adjustments. AFFO declined at a ~34% CAGR (n.b., ~20% on a per unit basis). AFFO per unit in Q3 was down ~25% YoY.
AFFO Evolution (Empyrean; Dream)
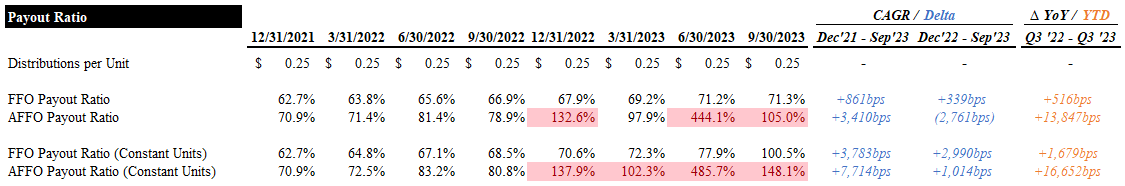
During this period, Dream's distribution per unit has remained constant at $1 per unit per year. Dream has actively repurchased units through its NCIBs and the SIB (n.b., ~29% cumulative decrease in unit count over the period). In addition to partially mitigating declining FFO and AFFO, it has also supported the distribution rate. Nevertheless, payout ratios have increased from ~63% and ~71% of FFO and AFFO to ~71% and ~105%, respectively. Three of the last four quarters have seen AFFO payout ratios exceed 100%. Without the unit repurchases, payout ratios would have reached ~101% and ~148% of AFFO, respectively.
Payout Ratio Evolution (Empyrean; Dream)
We believe a distribution cut sometime this year is likely. A 20% cut to ~$0.8 per unit per year would bring the FFO and AFFO payout ratio down to ~57% and ~84%, respectively. This would imply a ~7.5% yield based on the current price.
NAV Evolution
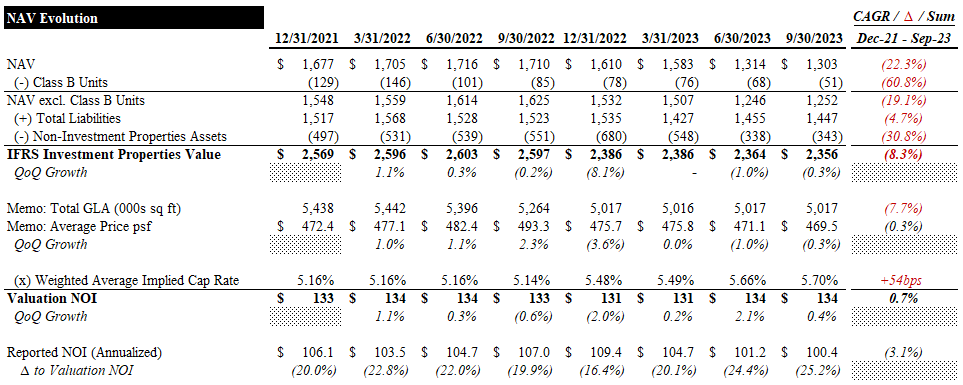
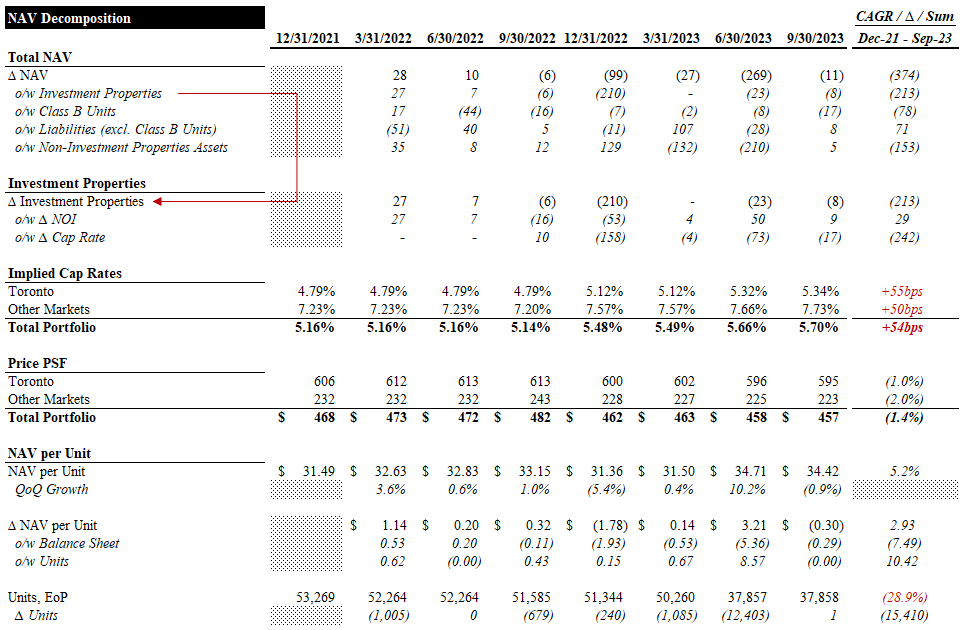
This section unpacks Dream's NAV evolution drivers from Q4 '21 to Q3 '23. Dream's reported NAV, which includes the carrying value of the Class B units, has declined ~22% over the period (n.b., ~19% excluding the Class B units). This growth was driven by a ~8% decrease in the value of its investment properties, driven by ~54bps of cap rate expansion and a ~1% CAGR in valuation NOI, and a ~5% decrease in liabilities (n.b., reported Net Debt / Assets increased ~700bps from 41.8% to 48.8%).
Much of the ~8% decline in the value of investment properties is attributable to a shrinking portfolio. Total GLA declined ~8%, implying a modest decrease in value PSF. The total portfolio cap rate also expanded ~54bps (n.b., ~55bps in Toronto and ~50bps in Other Markets). Despite declining NOI throughout '23 and the ~8% reduction in GLA, the NOI Dream uses in its IFRS valuation, implied by its cap rate and reported values, has increased at a ~1% CAGR. This implies a significant increase in NOI per property or PSF. This seems unreasonable given the challenging market conditions we have discussed so far and will discuss further in later sections. While it could be justified by an increase in management's estimated market rents (n.b., ~3% and ~8% CAGR in Toronto and Other Markets, respectively), it certainly doesn't capture the significant increase in leasing costs and tenant incentives that are now required to command market rents. This should be picked up in the cap rate, but the expansion we have seen is too optimistic. DIR has also seen ~54bps of cap rate expansion over this same period, identical to Dream.
NAV Evolution (Empyrean; Dream)
Despite all of the preceding, reported NAVPU has grown at a ~5% CAGR, driven by the ~29% reduction in the unit count.
NAV Evolution: Decomposition (Empyrean; Dream)
We do not believe the reported NAVPU of ~$34.4, and it seems management might not either in our view (n.b., recall Dream Unlimited and Michael Cooper's unit sales through the SIB). We saw similarly optimistic (perhaps aggressive) assumptions with DIR.
Leverage
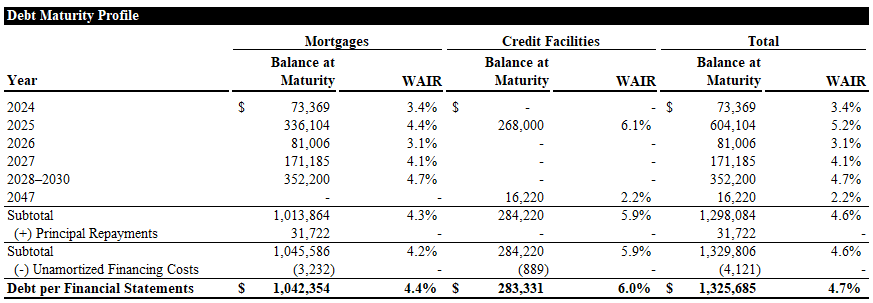
With ~$1.3Bn of gross and net debt, Dream's D/GAV is ~68% (n.b., vs ~49% reported), and ND/EBITDAFV is ~12x. The D/GAV is relatively high, but ND/EBITDAFV looks in line with other Canadian residential REITs. With longer lease terms, this leverage multiple should be fine. However, considering the uncertainty around the near-term supply/demand imbalance and resulting negative implications for cash flow, it actually looks quite high. The ICR has also degraded significantly to <2x, increasing the likelihood of a distribution cut. Given the challenging financing environment and gridlocked private office market, we see asset sales as an absolute last resort to deleverage the business.
Debt Summary (Empyrean; Dream)
Maturities through this year do not appear challenging, but there is a significant wall in '25.
Debt Maturity Profile (Empyrean; Dream)
Overall, the leverage profile is a material concern for us. We do not necessarily see this as an existential risk, but it certainly increases our desire for a margin of safety and will weigh on the bull case. We note that Northview Residential REIT - Unit - Class A ( NRR.UN:CA ) has a similarly high debt burden, but a clear path to deleverage and none of the market headwinds that Dream suffers from.
Valuation
Dream trades for 7.6x and 11.2x LQA FFO and AFFO, respectively (n.b., 7.5x and 14.5x LTM, respectively). FFO guidance for FY23 implies ~7% YoY decline (n.b., 7.6x FFO). Its $1.00 annual distribution yields ~9.4%. Based on our NAV estimate, the market is pricing it at a ~27% discount and a ~6.6% implied cap rate.
Valuation Summary (Empyrean; Dream)
Our central case NAV estimate is based on estimated market cap rates from Altus , CBRE , and Colliers . Our average cap rate assumption is ~55bps higher than management's.
Cap Rate Assumptions (Empyrean; Dream)
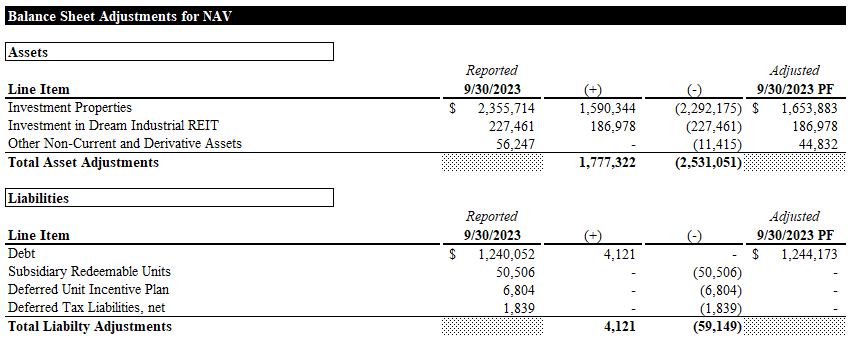
The major balance sheet adjustments for our NAV calculation are shown below.
Balance Sheet Adjustments for NAV (Empyrean; Dream)
Our target price is based on a 5% discount to NAVPU due to the external management. Our central case implies ~30% upside, and the management case implies ~56 % upside.
Target Price (Empyrean; Dream)
Despite the upside implied by our NAVPU, we do not believe the valuation is compelling. Given the risk profile discussed above and below, we see opportunities for comparable capital appreciation and yield in other REITs with a far more manageable risk profile (e.g., Northview Residential REIT ).
Risks & Catalysts
Elevated Vacancy & Leasing Costs
COVID lockdowns coincided with a wave of new supply in downtown Toronto. This led to an increase in vacancy from 2% to 16%.
Downtown Toronto Office Supply (Dream)
While utilization and demand have recovered to a large degree, the glut of available space has created a "flight to quality", allowing tenants to upgrade to newer and nicer spaces with significant concessions and incentives from landlords. As seen in the table below, this has caused Dream's net effective rents ("NERs"), which account for leasing costs and incentives, to remain essentially flat despite significant growth in rental rates. In simple terms, headline rent growth has been strong, but the cost to win these leases has increased, offsetting the benefit of the rent growth. This has been a significant factor in deteriorating AFFO.
Retention and Renewal Leasing Spreads (Empyrean; Dream)
Using management's estimated market rents for the portfolio, we see that the implied loss-to-lease/spread has narrowed significantly from +20% in '20 to ~9% in Q3 '23. In Other Markets, Dream's rents are slightly above market.
Market Rents (Empyrean; Dream)
With the spread between in-place and market rents narrowing and leasing costs continuing to rise, we are not optimistic about the near-term leasing potential of the portfolio.
As management notes, new supply has now returned to '18 levels, and there are no new office projects in the pipeline. Given the huge amount of available space and slow but steady pace of utilization recovery, it will likely take quite some time for the market to stabilize. Furthermore, with new leases in the last 4 quarters being struck at 4-7-year terms, it will take even longer for Dream to realize any improvements in market fundamentals.
Conclusion
Initially, we were split between a Hold or a Sell rating for Dream. Generally, we give Hold ratings when we are ambivalent about a security. If a friend told us he owned something that we had at a Hold, we hold no protest. Likewise, if he said he didn't like it and didn't own any. In short, we see the bull and the bear case and don't have firm conviction either way, usually due to valuation. However, in the case of Dream, we would likely protest. Given the risks and uncertainties discussed above, holding Dream above $10 CAD is quite unappealing to us. We see several other opportunities with similar return profiles and far more straightforward theses. We may change our minds if the units wind up far below $10 again (perhaps following the potential distribution cut). For now, the juice does not appear worth the squeeze.
For further details see:
Dream Office REIT: Still A Sell For Us