DUK - Duke Energy: Utility In A Good Jurisdiction With A 4.4% Dividend
2023-09-15 06:50:03 ET
Summary
- Duke Energy is a fully regulated energy utility company operating 50,000 megawatts of capacity with 320,000 miles of transmission lines.
- The company has a history of expansion through mergers and acquisitions, allowing it to have a wide geographic footprint in some favorable jurisdictions.
- The company has consistently grown its dividend and has strong fundamental demand for its product.
- The company's balance sheet is leveraged and so as interest rates rise, this will begin to create headwinds with increased interest expenses.
Duke Energy (DUK) is a fully regulated energy utility company that operates 50,000 megawatts of capacity with 320,000 miles of transmission lines servicing 10 million customers. Here is a map of their area of operations. A fully regulated energy company is one who owns and operates everything from the power generation to the meter.
Duke Energy Operating Areas (Duke Energy Q2 Presentation)
A Brief History of Duke Energy
The history of Duke Energy began in the Carolinas when James B. Duke built a various lakes and dams along the Catawba River for hydroelectric generation. James Duke and his business partners believed the Southern states were lagging behind the northern states due to falling behind in producing energy. Their first project was created to produce power for the Victoria Cotton Mill. Their first endeavor was successful and so they expanded and eventually served a wider range of industries and purposes with their hydroelectric power.
The Catawba River, where the company began, starts near Hickory, North Carolina and feeds into Wateree and the Santee rivers.
Map of Rivers in Carolinas (Americanrivers.org)
Following World War II, America saw another surge in economic growth and Duke began to focus attention on nuclear energy. The company began construction on their first nuclear power plant in 1965 called the Keowee-Toxaway Project and it began operations in April 1971.
As the industry around nuclear energy grew, the Three Mile Island nuclear accident occurred in 1979 which spurred the president of Duke Power, Bill Lee to create the Institute of Nuclear Power Operations to create safety standards for the industry.
The 1990s began the opportunities created by a deregulated natural gas industry and so Duke Energy as well as other companies began to find ways to transport and use natural gas to provide and generate energy for its customers. In 1997, Duke Power merged with PanEnergy, a leader in the natural gas business, to create Duke Energy.
Since then, to become what it has become today, Duke Energy has either merged or swallowed up companies such as Cincinnati Gas & Electric which at one point was known as Cinergy, Piedmont Natural Gas, Florida Energy, and more recently in 2012, Progress Energy. This is what has allowed Duke Energy to currently have the geographic footprint that it has.
Today, the company is investing in all manner of ways to make the company more efficient at delivering energy to its end users.
Long-Term Company Initiatives
To gain a perspective for the long term , here is the direction that the company is headed. Similar to nearly every other energy company, they are focused on the ESG initiatives.
- The company has established carbon emission reduction targets of 95 percent by 2050 with certain other deadlines prior to then as well.
- By 2035, Duke Energy hopes to have 30,000 megawatts of regulated renewables installed. This would increase today's renewable capacity by a factor of 5.
- Coal will be less than 5 percent of the company's energy generation by 2030 and will be completely retired by 2035.
Duke Energy Federal Subsidies (Duke Energy Q2 Presentation)
In order to accomplish these goals, they will be using subsidies from the Inflation Reduction Act ((IRA)) (2022) as well as the Infrastructure Investment and Jobs Act ((IIJA)) (2021).
This highlights the fact that companies like First Solar may be a good opportunity if you believe in the ESG movement. I wrote an article about how I view First Solar's investment prospects , who is also the largest producer of solar panels in the United States.
Operating Performance
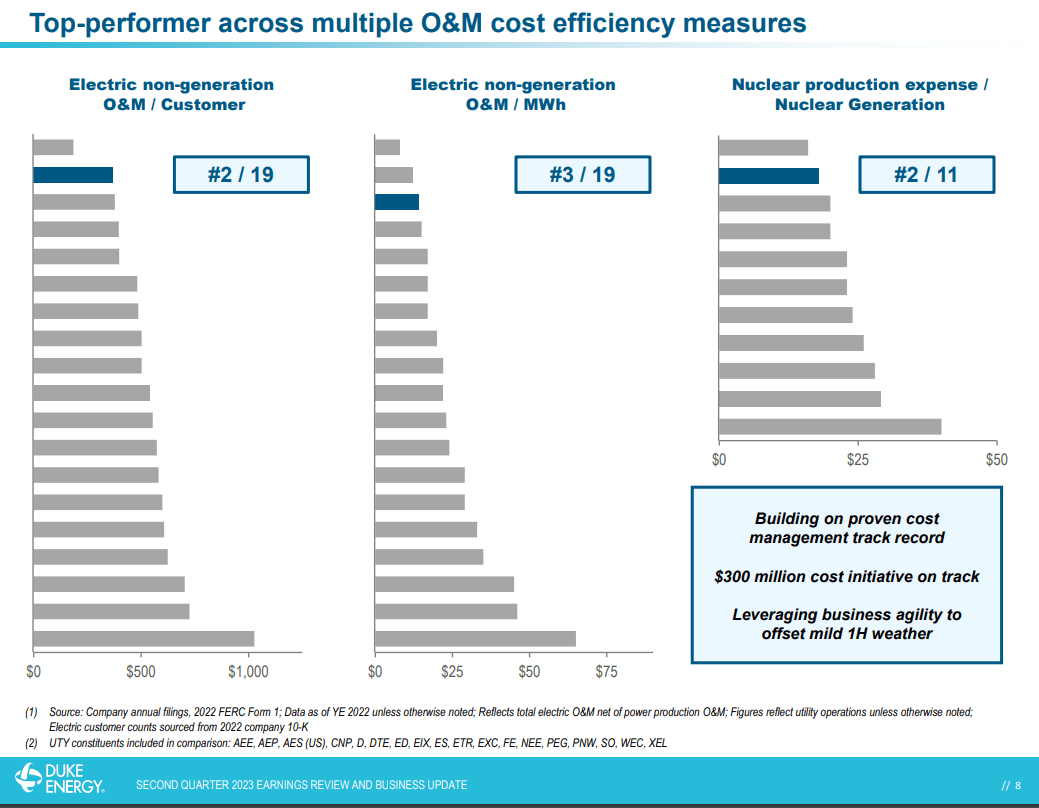
Duke Energy prides itself on its operating efficiency which is worth mentioning. Here are three metrics that are measured by the Federal Energy Regulatory Commission ((FERC)) that demonstrate Duke Energy's operating cost leadership and is deploying $300 million in capital improvements to increase its leadership in operating and maintenance(O&M).
O&M Cost Efficiency Measures (Q2 Presentation)
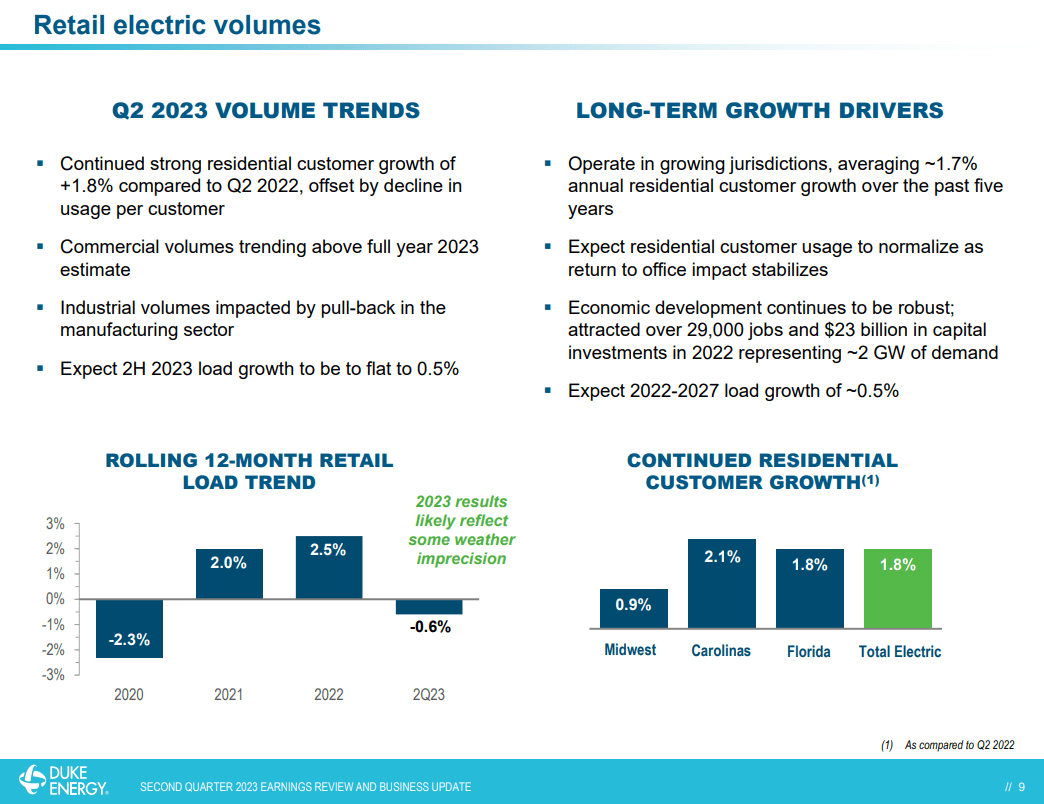
Duke Energy is seeing continued strong demand growth for energy in its operating regions. Currently, the regions where Duke Energy operates are fairly desirable places to live. When you hear stories of people leaving certain states to move to other states, Duke Energy operates in some of the midwestern and southern states that are more desirable.
This is demonstrated by the growth rates in their residential demand year-over-year. When choosing which energy utility to invest in, this is something to pay attention to. Are they operating in a jurisdiction that is popular for people to move to?
Volume Trends and Growth Drivers (Duke Energy Q2 Presentation)
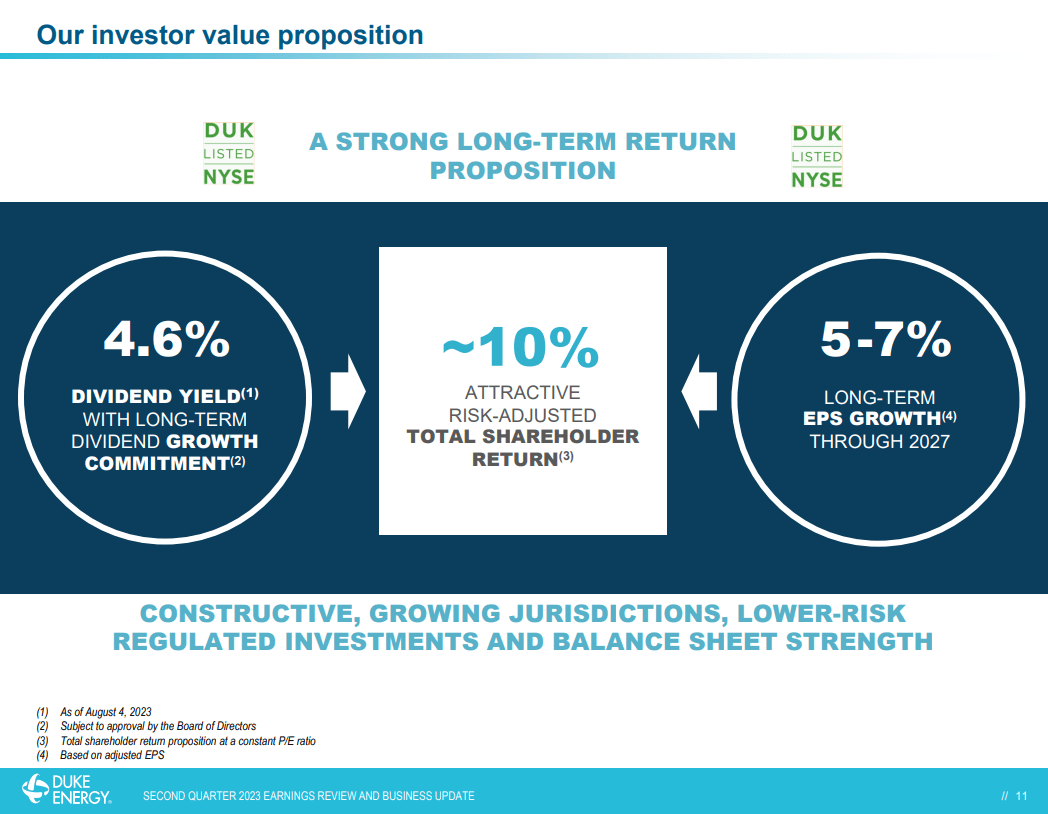
Duke Energy has laid out the explicit goal that it hopes to deliver roughly a 10 percent return for its shareholders. It plans to do achieve this with a consistent dividend yield near 4.6%, as well as growing its earnings per share by 5 to 7 percent each year. Naturally, it depends on what price you purchase shares at that will determine your annual return, but over the long term, this is the company's goal.
Rate of Return Goal (Duke Energy Q2 Presentation)
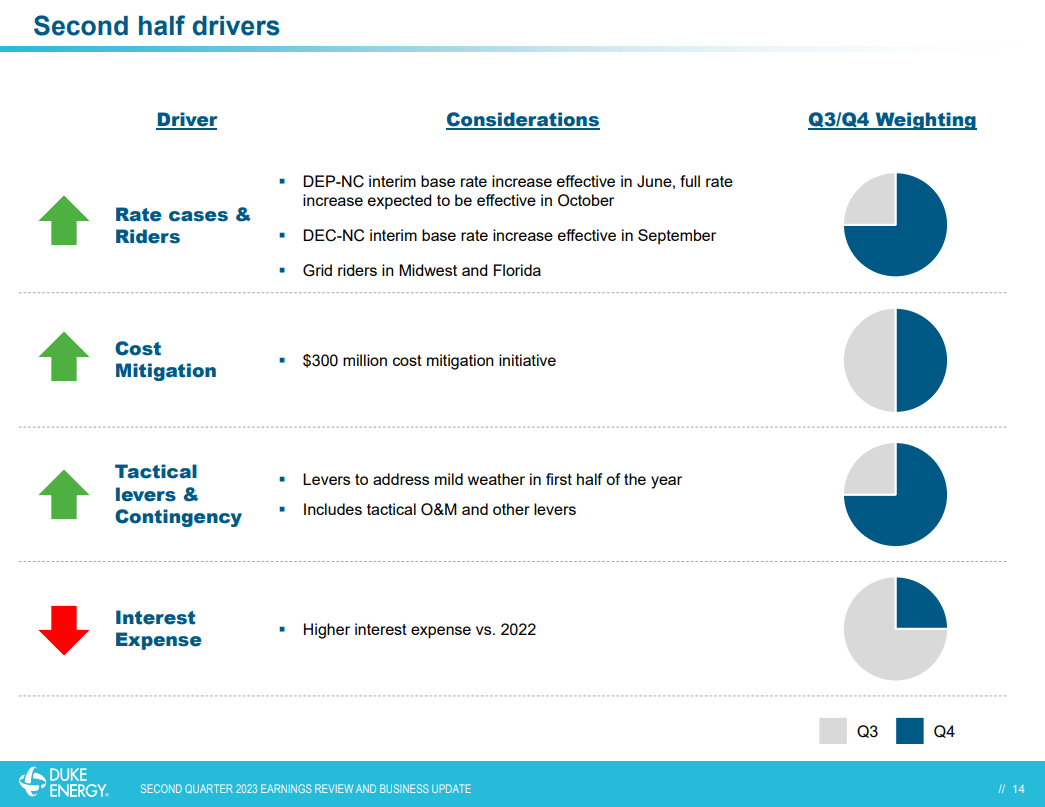
As we are now well into the second half of 2023, here are where Duke Energy sees its growth and headwinds coming from. I already mentioned the $300 million in cost mitigation initiatives.
In certain regions, they are about to see increases in the base rate cost for energy which will drive growth. This goes hand-in-hand with the inflation theme we are all experiencing and presents Duke Energy as a way to hedge yourself against that inflation.
Economic Drivers and Headwinds (Duke Energy Q2 Presentation)
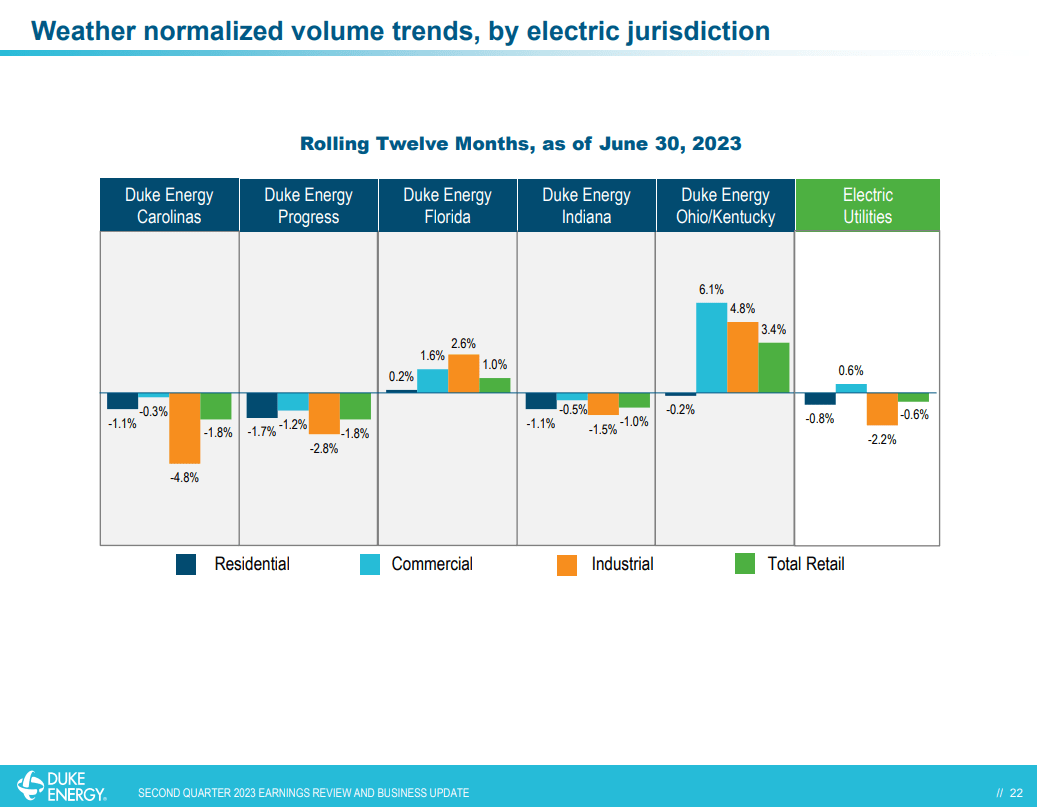
This slide shows where Duke Energy's growth or lack of growth in energy demand has come from in the past twelve months. Florida and Ohio/Kentucky are the regions with the most growth when adjusted for weather.
I like this slide because it demonstrates that energy usage overall is not increasing dramatically, and yet inflation continues to remain persistent across many areas of the economy. If you want to interpret it this way, I think this slide can confirm that stagflation is happening.
And of course, this slide shows the importance of Duke Energy's regionally diversified portfolio.
Electricity Demand by Region (Duke Energy Q2 Presentation)
Balance Sheet Trends
I always like to look at the balance sheet more than other financial metrics. For me, this gives me a clearer picture of the company's risk profile. Risk is by no means something to be avoided, but it is something that should be measured, as much as that is possible. In my last article, I wrote about CVR Partners LP who has a similar balance sheet to Duke Energy, but also provides the potential for a large upside move thanks to its TTM 30 percent dividend and the potential for strong appreciation. Granted, these are two dramatically different businesses, but as long as you understand that debt-leverage can affect your investment negatively as well as positively, then this is the point of understanding leverage.
Duke Energy has a debt-to-asset ratio of .707. I understand that the energy industry is a safe industry where prices for the end product are stable, but it is not my preference to invest in a company with a balance sheet that is this leveraged, if it is only going to generate 10 to 15 percent annual returns. I will discuss this more in my conclusion of the article.
| $ (Billions) |
| 2018 |
| 2019 |
| 2020 |
| 2021 |
| 2022 |
| Debt |
| $111 |
| $113 |
| $118 |
| $126 |
| Assets |
| $145 |
| $159 |
| $162 |
| $170 |
| $178 |
| Debt-to-Asset Ratio |
| .703 |
| .698 |
| .697 |
| .694 |
| .707 |
Dividend Track Record
Duke Energy, like many utility companies is a steady dividend stock. Here is a quick view of their dividend pay-out track record.
| $(Millions) |
| 2018 |
| 2019 |
| 2020 |
| 2021 |
| 2022 |
| Dividend Paid $ |
| $2,471 |
| $2,668 |
| $2,812 |
| $3,008 |
| $3,073 |
| Shares Outstanding |
| 708 |
| 729 |
| 738 |
| 769 |
| 770 |
| Dividend Per Share |
| $3.64 |
| $3.75 |
| $3.82 |
| $3.90 |
| $3.98 |
| Dividend Growth Rate YoY |
| NA |
| 3% |
| 1.8% |
| 2.1% |
| 2% |
Technical Analysis
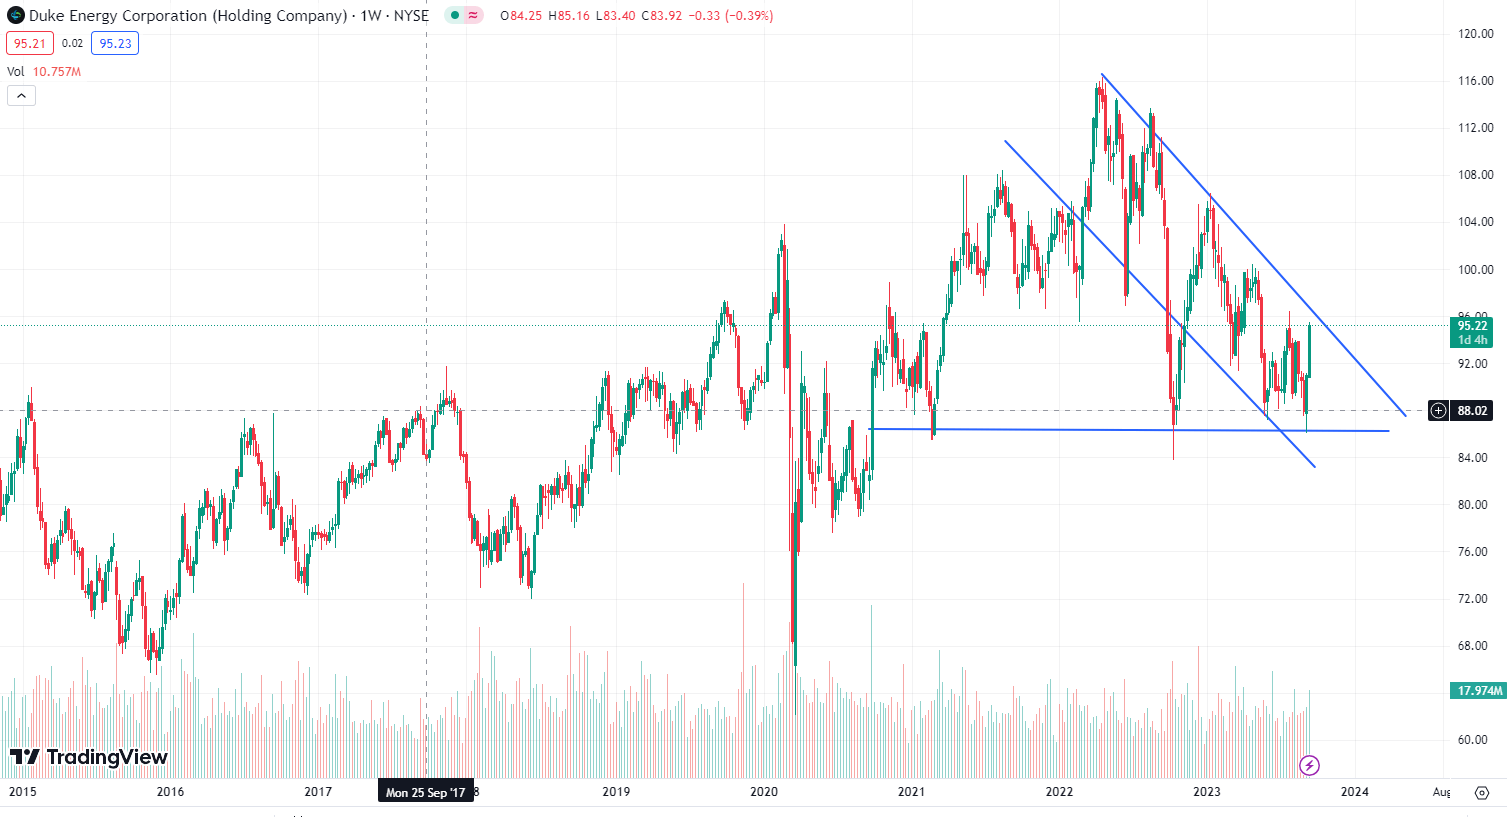
When I say I'm doing technical analysis, all I'm really doing is drawing trendlines. I'm not an expert in the realm of all the technical indicators that are available. However, I can recognize some simple chart patterns. And given the inflationary environment and how there is a close relationship between energy and money, I can be fairly confident that chart patterns like these are more likely to be bullish than bearish. Since reaching its peak, it has moved downward in a channel which appears poised to breakout of in the next 3 to 6 months or maybe sooner.
Duke Energy Technical Analysis (Tradingview)
Conclusion
To conclude, I would rate Duke Energy a buy. Although as an investor, my rating isn't an enthusiastic buy. This doesn't mean that Duke Energy is a poor investment or that it won't keep pace with inflation. Given the regions or jurisdiction that it operates within, it will likely do very well compared to other utility companies. And it has demonstrated that it is a leader in its operating and maintenance efficiency metrics within the industry. For these reasons, I will rate it a buy. However, when I think about buy, hold, or sell ratings, I think about them on a relative scale across different parts of the energy industry.
When I compare Duke Energy across the energy industry, I would rather own a company in the oil and gas exploration space than the energy utility sector. Here's why. Would I rather own Duke Energy who is likely to deliver 10 to 15 percent annual return with a balance sheet debt-to-asset ratio of .7?
Or would I rather own an upstream E&P company like EOG Resources (pick your E&P company) who has a balance sheet debt-to-asset ratio of .4 that generates stronger returns on invested capital and who has created a system of fairly predictable returns through its oil and gas exploration program? Upstream oil companies will be more affected by volatile fluctuations in oil price, but I view this volatility as a positive and not a negative as long as the company has a balance sheet and a strong asset portfolio. With the inflationary environment we are all facing, oil and gas seems like a better way to invest.
Again, utility companies can get away with having balance sheets this leveraged while at the same time providing steady returns because the price of their end product is very stable along with various other factors. But just as Duke Energy pointed out in its most recent quarterly presentation, rising interest rates are going to become a noticeable headwind for the company in upcoming quarters.
For further details see:
Duke Energy: Utility In A Good Jurisdiction With A 4.4% Dividend