FSK - Dump This Fat 16% Yield Before The Cut
Summary
- Big unsustainable yield at a premium valuation. This share isn’t for investors, it’s for suckers.
- The valuation is at historically high levels. People who keep holding onto shares are not investing.
- Losing money isn’t the criteria for being an investor.
- Getting out now gives investors a higher valuation so they can buy something better.
Get ready for charts, images, and tables because they are better than words. The ratings and outlooks we highlight here come after Scott Kennedy’s weekly updates in the REIT Forum. Your continued feedback is greatly appreciated, so please leave a comment with suggestions.
Cherry Hill Mortgage
Is it time for targeting Cherry Hill Mortgage ( CHMI )? Of course. Cherry Hill Mortgage is an easy pick for a sell rating. Should you own CHMI? Nope. What if you have an unrealized loss? Join the crowd of investors who held shares for too long. What’s amazing right now is that CHMI put together a huge rally since late 2022. How big was the rally? Way too big . From the middle of December 2022, CHMI has dominated the sector as shares ripped higher and left peers in the dust. Was it because CHMI is the greatest mortgage REIT ever? Obviously not. They’ve managed to destroy an impressive amount of wealth over the years.
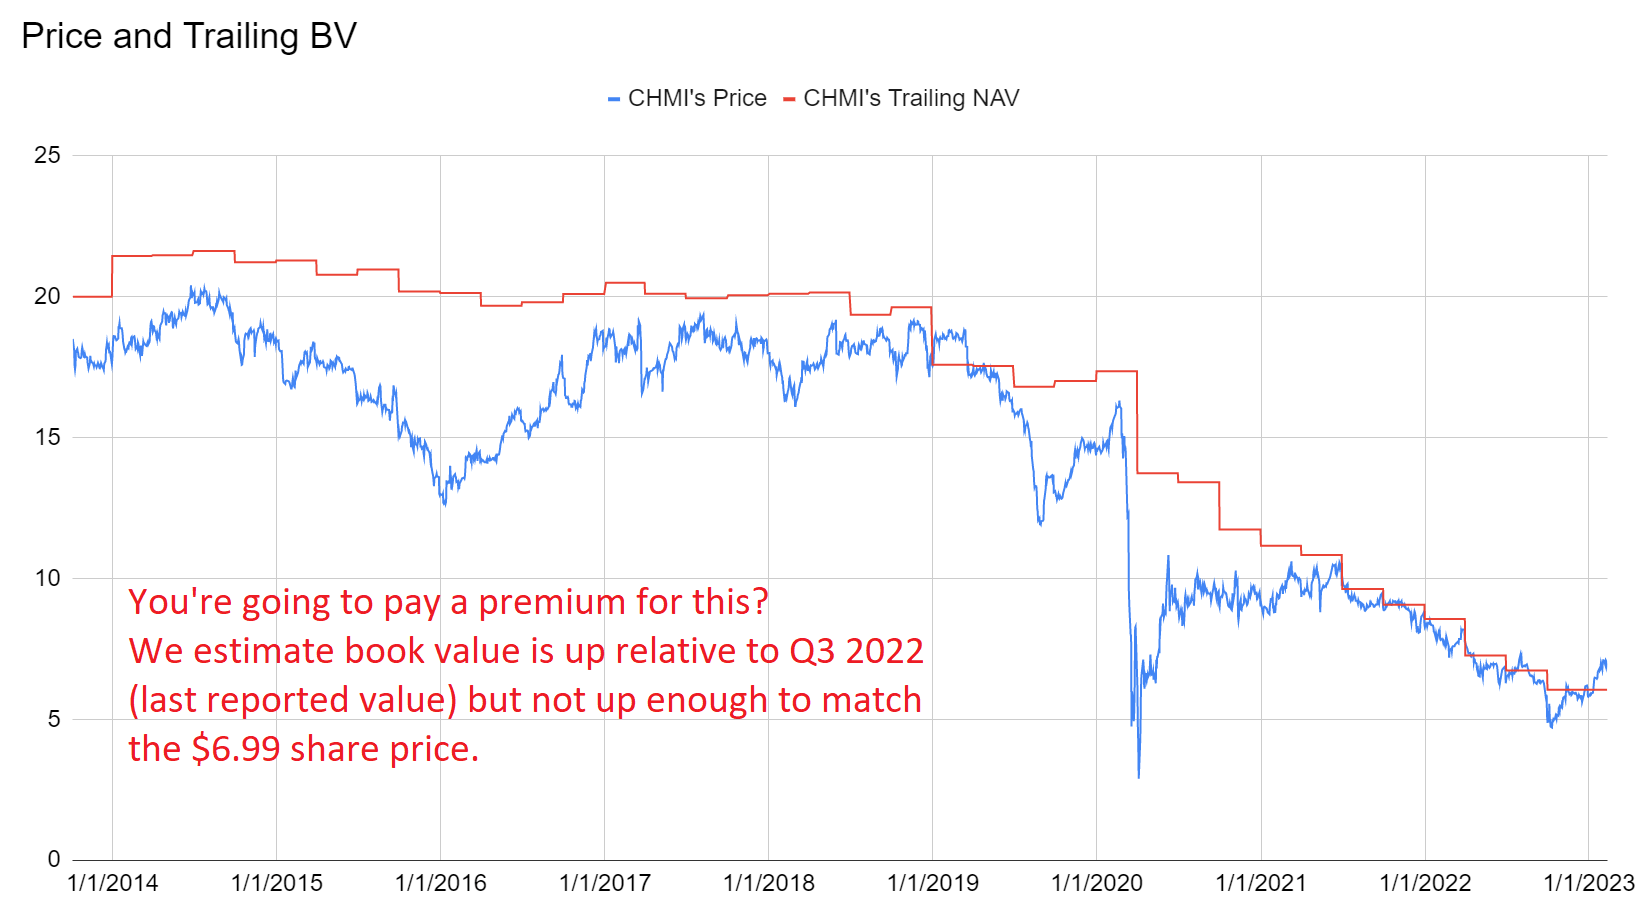
By our estimate, shares trade at a material premium to book value. Should a frequent wealth destroyer trade at a material premium? No. Should CHMI look to issue new shares if their price stays elevated? Absolutely. Who wouldn’t?
Here’s a chart comparing trailing book value and the share price:
The REIT Forum
If CHMI’s book value today is above the $6.99 share price, that would be surprising. As of early February, we estimated the current book value was up to $6.60. That’s much better than the trailing book value of $6.05 from Q3 2022 and it's materially higher than the estimate we had for 12/31/2022. January was a relatively kind month for book values. We don’t have a reported value for Q4 2022, but even if we used the estimate for late February book value, CHMI would still have a material premium to book value. At least, compared to CHMI’s history, that would be a material premium (more than 5%). For CHMI, a discount of only 10% is pretty good.
Since late 2013, BV fell from about $20 (higher in 2014), down to $6.05 for Q3 2022. Even if we assume a recent value of $6.60, that would still be a 67% decline in book value. Yuck. If you think dividends didn’t decrease during that period, you’re living in a fantasy.
However, there are REITs that don’t look like that.
Mortgage REITs Better Than CHMI
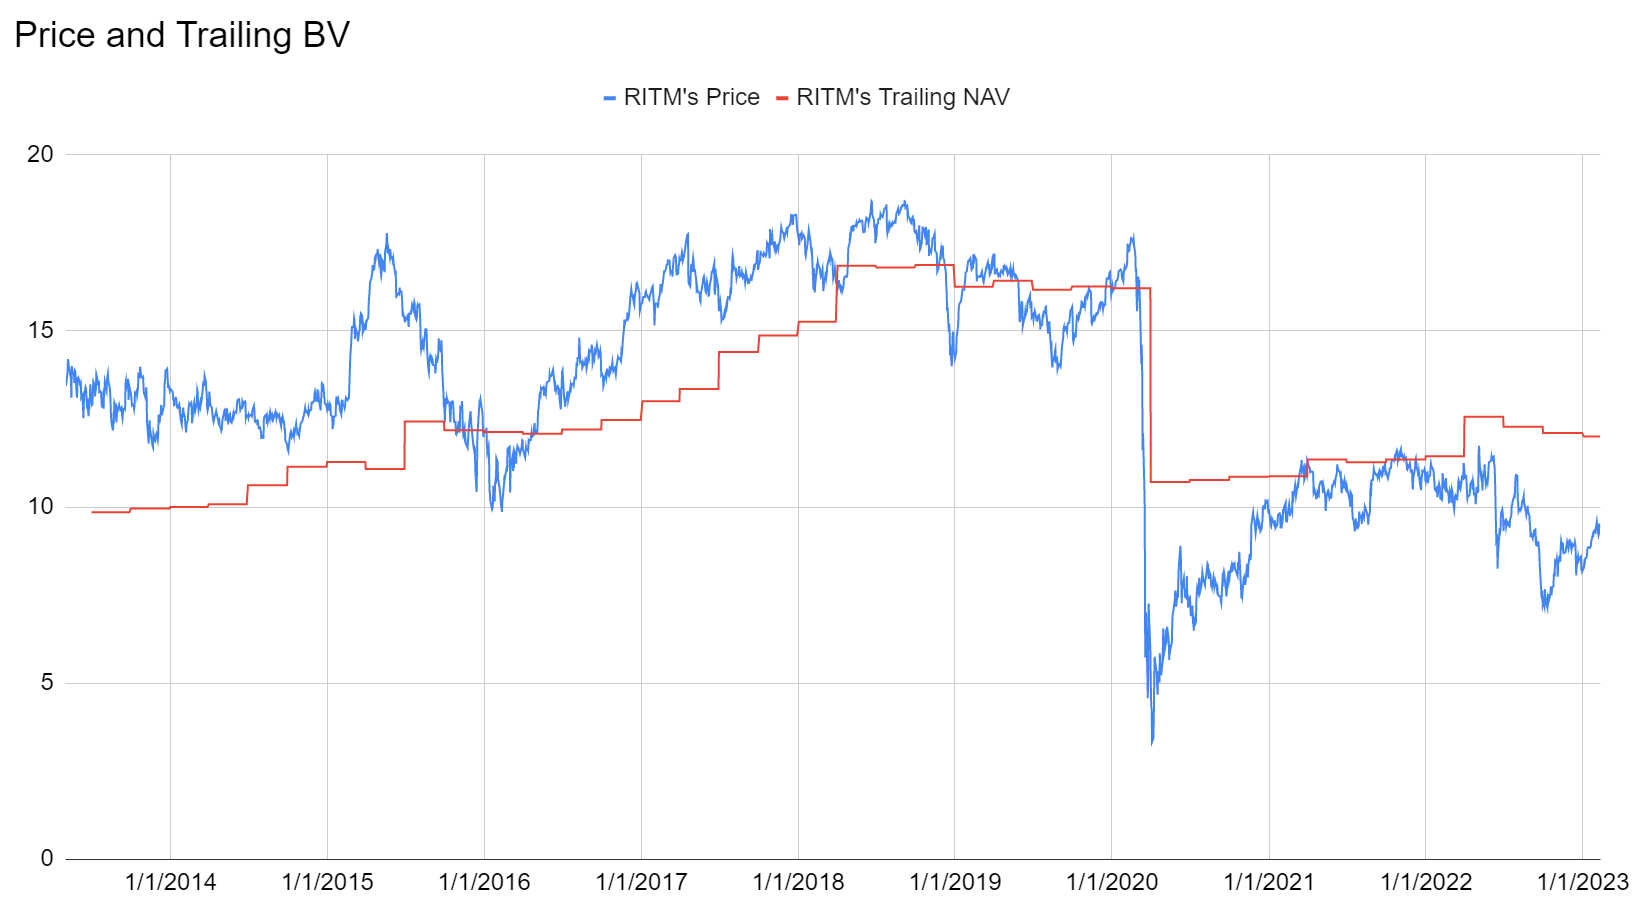
There’s Rithm Capital ( RITM ). They're bad at coming up with a new company name. New Residential was a much better name and it didn’t set off spell check. However, we can see that RITM clearly has a superior history:
The REIT Forum
Despite taking a huge hit in the pandemic and taking some damage since Q1 2022, RITM’s book value per share is still materially higher than it was in 2013. You also may notice that RITM currently trades at a substantial discount to book value. I guess “investors” don’t like the 10.5% dividend yield? It’s only 8.5% on book value, so RITM is in a better position than many peers. CHMI pays out an impressive 15.5% yield, which is 16.4% on our estimated book value (for 02/03/2023). In case you missed it, the CEO of Annaly Capital Management ( NLY ) announced NLY is going to cut the dividend from about 16% on book value to about 11% or 12% on book value. How about that? It turns out yield on book value is such a useful tool for evaluating dividends that the CEO referenced setting the dividend as a yield on book value. If you know more about mortgage REITs than David Finkelstein (CEO of NLY), raise your hand. If your hand is up and you’re not a mortgage REIT executive, it’s time for an ego check.
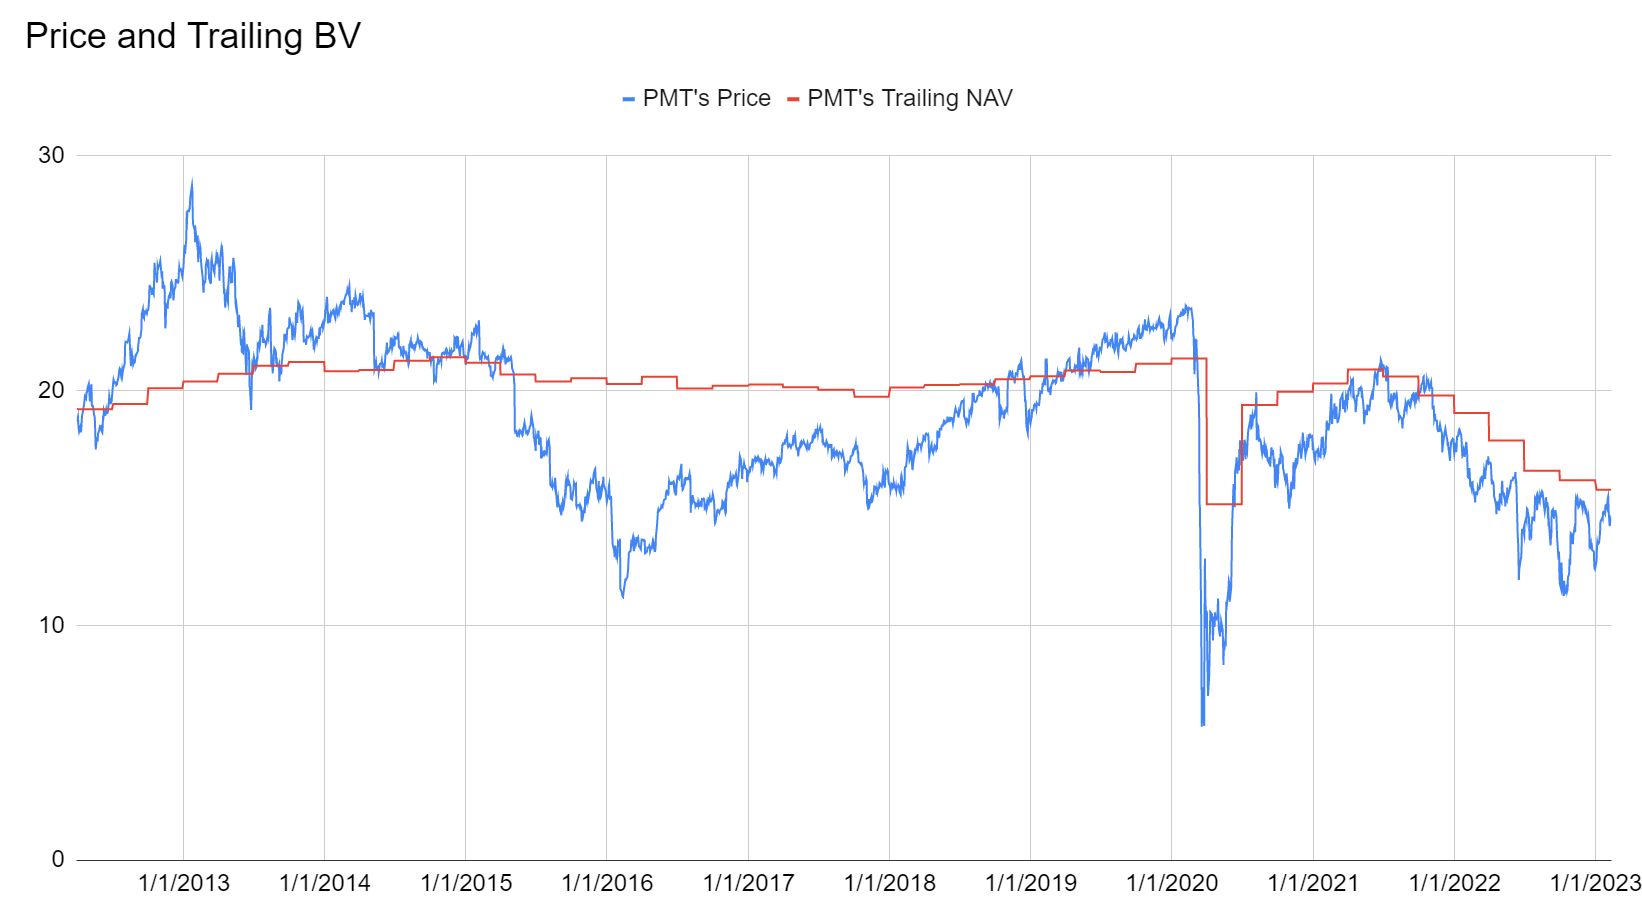
Next up we have PennyMac Mortgage Trust ( PMT ). They’ve been suffering from a declining BV over the past several quarters as rates rose so rapidly:
The REIT Forum
Despite the struggle over the last two years, PMT’s book value per share is not down nearly as bad as CHMI. It suffered, but it wasn’t demolished. As it stands, PMT at $14.45 is still trading at a moderate discount to book value. Not one of the best deals, but not horrible either.
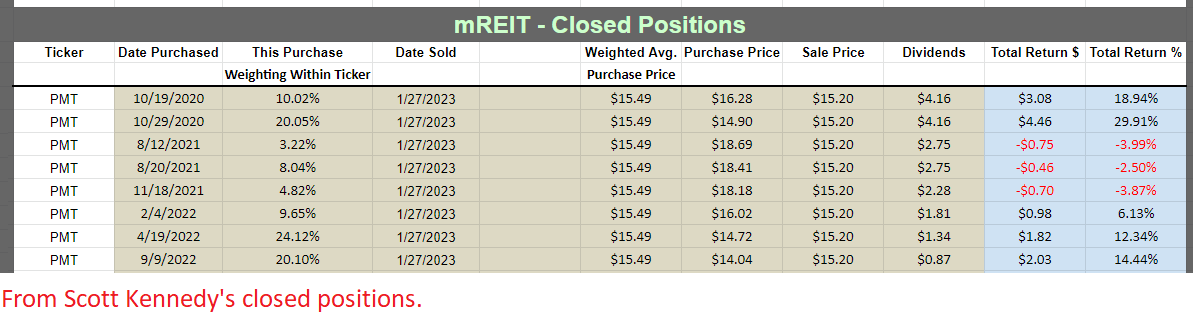
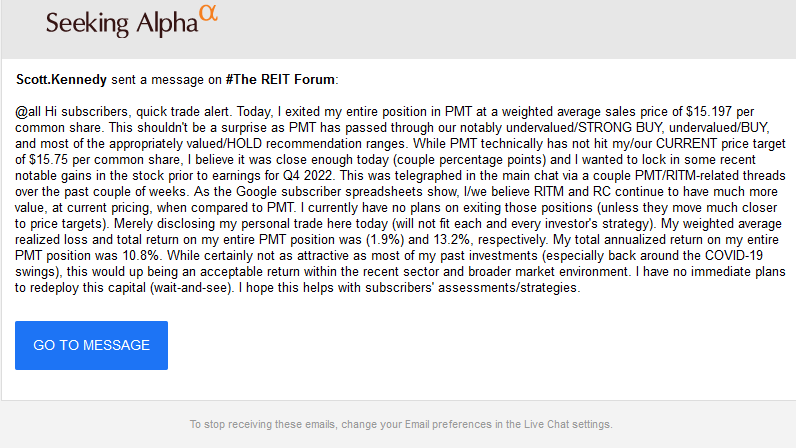
Do you like the price spike in late January? Scott Kennedy (another analyst for The REIT Forum) used that spike to close out his position:
The REIT Forum
Note: Scott’s positions show the weighting within the ticker without showing the exact number of shares. Consequently, the total return value is per share.
Since this is The REIT Forum, we disclose trades in real time and the disclosures trigger an email alert:
The REIT Forum
Outlooks - Bash CHMI
I’m going to focus on one rating here and that’s being bearish on CHMI. In my opinion, CHMI at $6.99 is a raw deal. Sell CHMI. Investors are most likely paying a premium to book value for a mortgage REIT with a poor history for protecting book value and dividends. That’s just not a good deal. There are other choices available that are significantly better. If you can’t find any of them, you must not be familiar with my work.
Should you dump it now or after they cut the dividend? Take a hint from the drop in NLY and ditch shares of CHMI before the big yield takes a big haircut. Since NLY's announcement, they've been the worst performing mortgage REIT as "investors" who overstayed their welcome ran for the exits.
Suggestions Welcome
NLY hasn’t explicitly stated the new dividend rate yet. However, they have told us to expect a yield around 11% to 12% on book value rather than around 16% on book value. This foreshadowing without an explicit amount is a bit difficult for our charts. I want ideas from readers. Is it more reasonable to use the trailing yield that is already sentenced to a huge chop, or to adjust for our projected dividend rate (using a value between 11% and 12% on book value)?
I’ll have another article coming up that helps investors understand why NLY chopped the dividend. We expected NLY to slash the dividend this year , though we didn’t expect them to rip the Band-Aid off this quarter.
Stock Table
We will close out the rest of the article with the tables and charts we provide for readers to help them track the sector for both common shares and preferred shares.
We’re including a quick table for the common shares that will be shown in our tables:
| Type of REIT or BDC |
| Residential Agency |
| Residential Hybrid |
| Residential Originator and Servicer |
| Commercial |
| BDC |
Let the images begin!
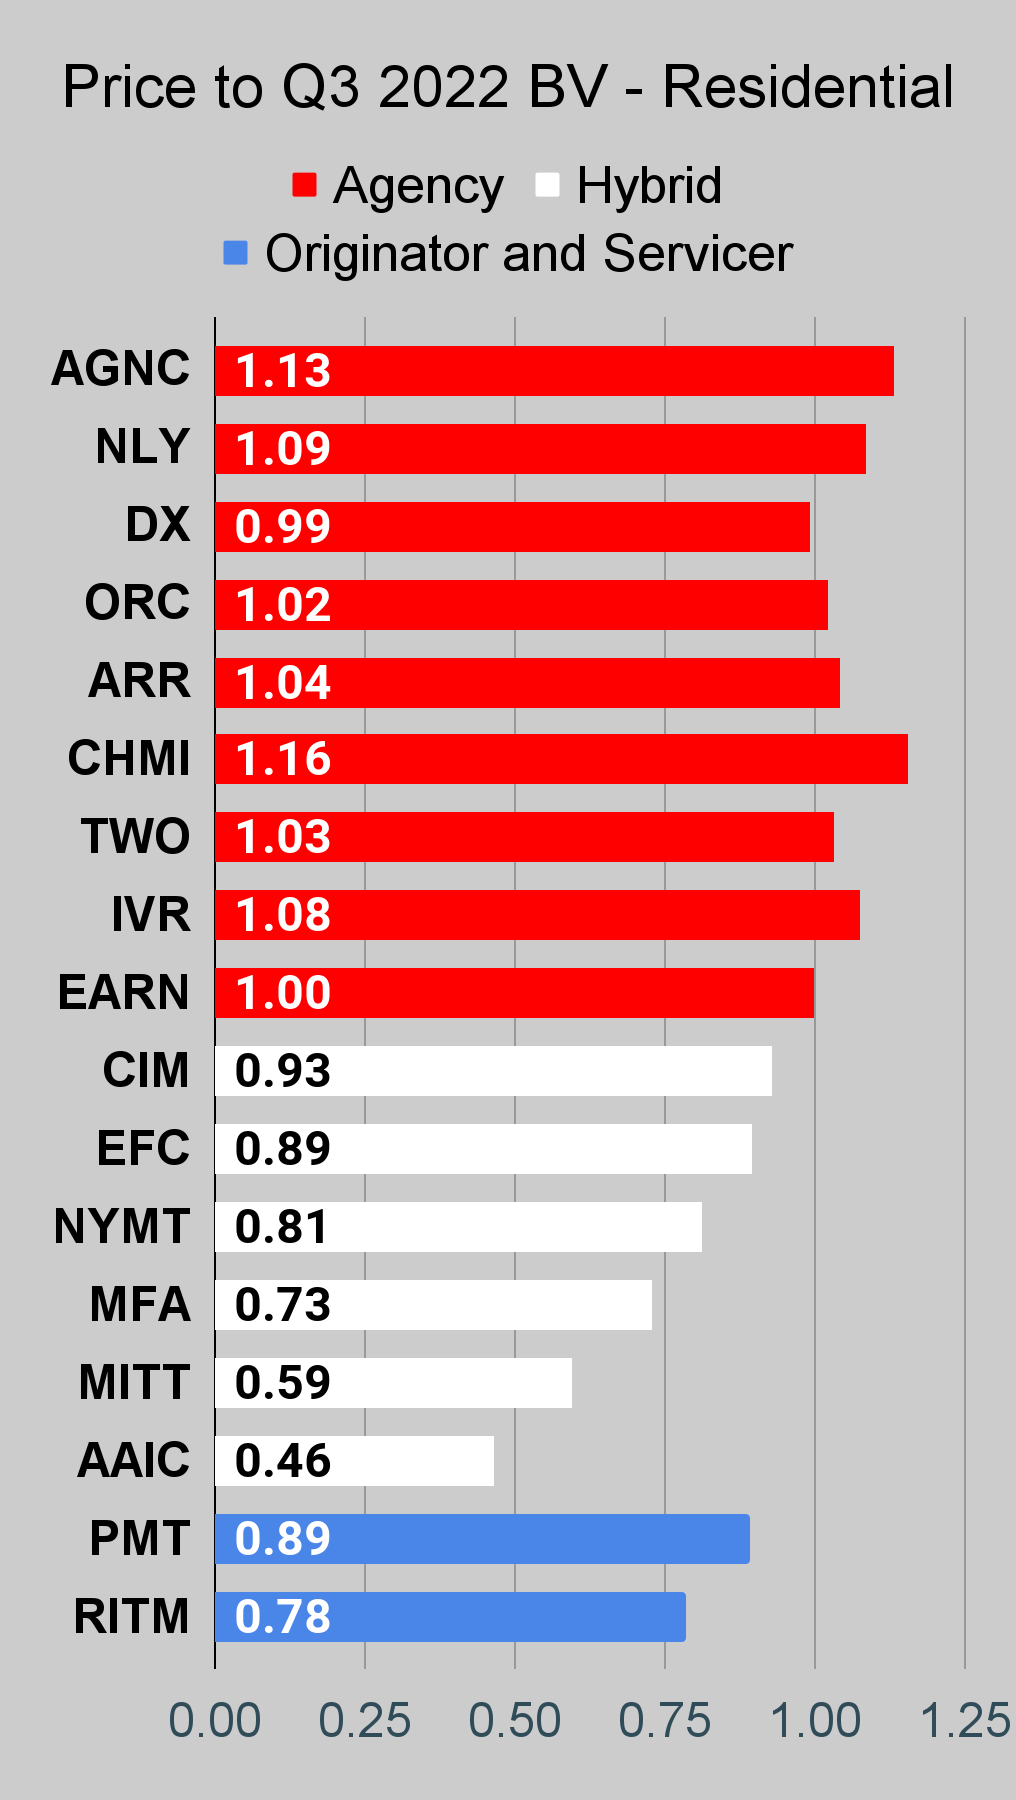
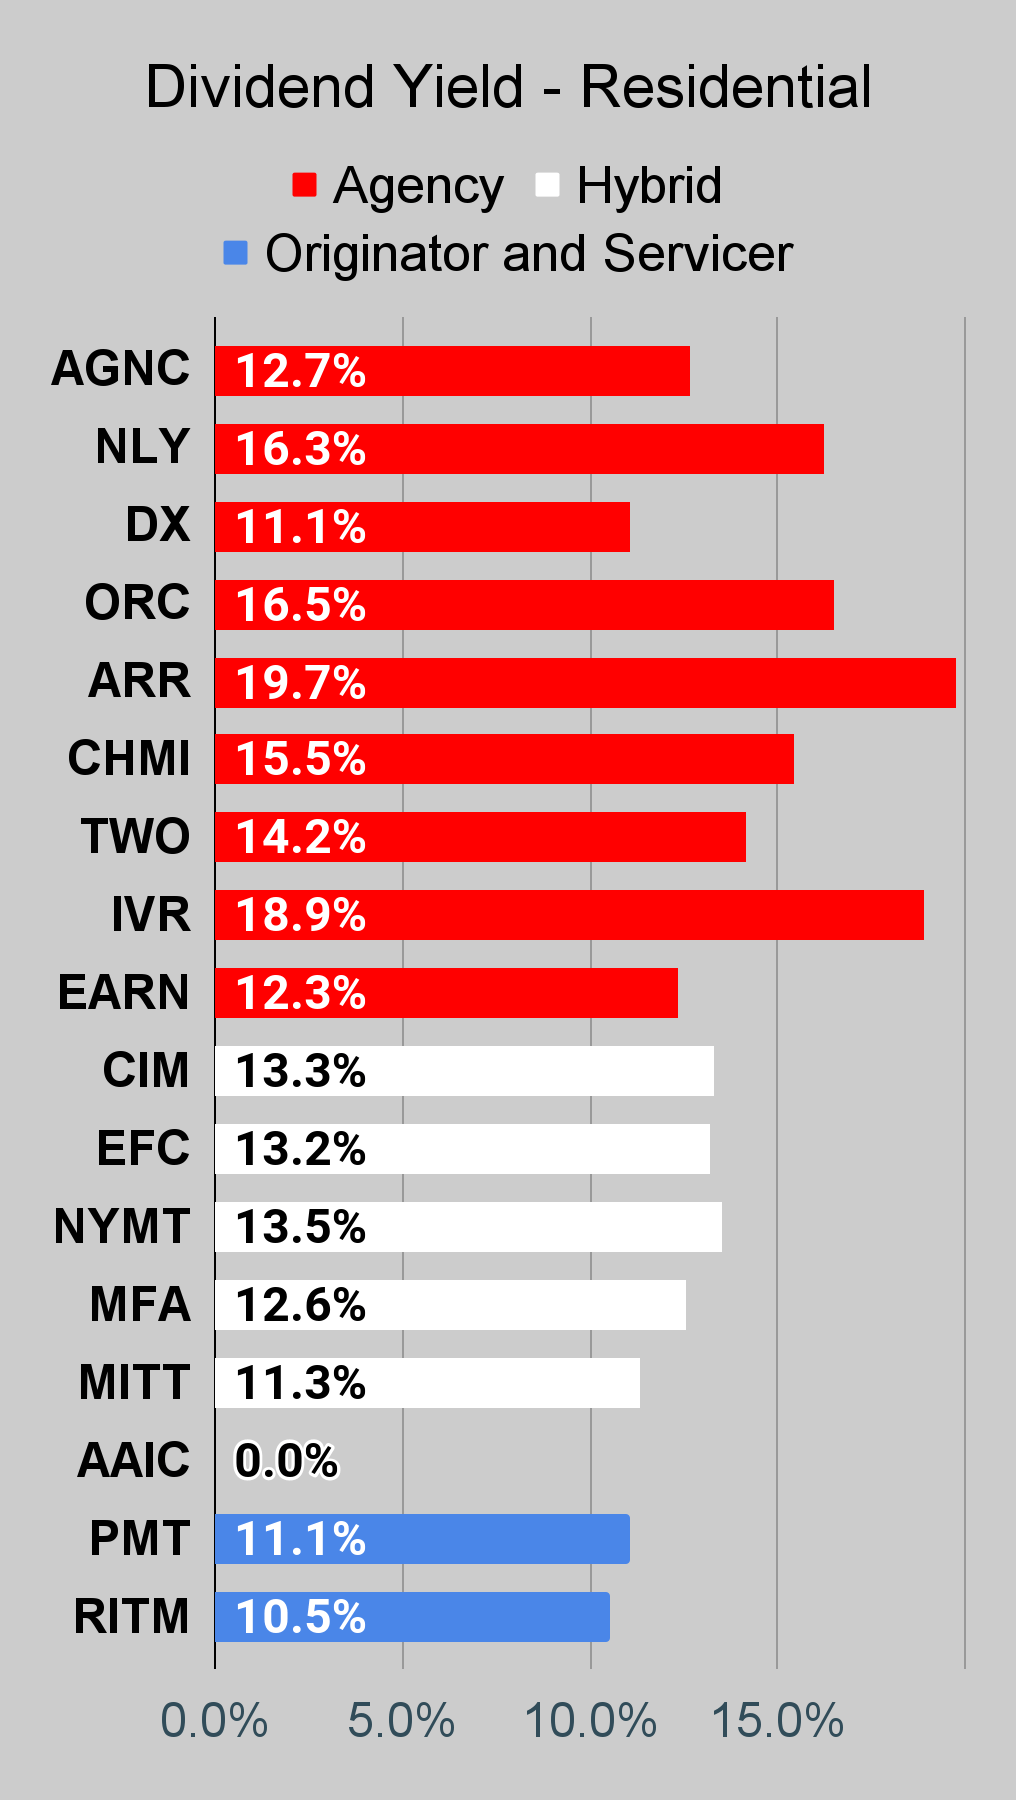
Residential Mortgage REIT Charts
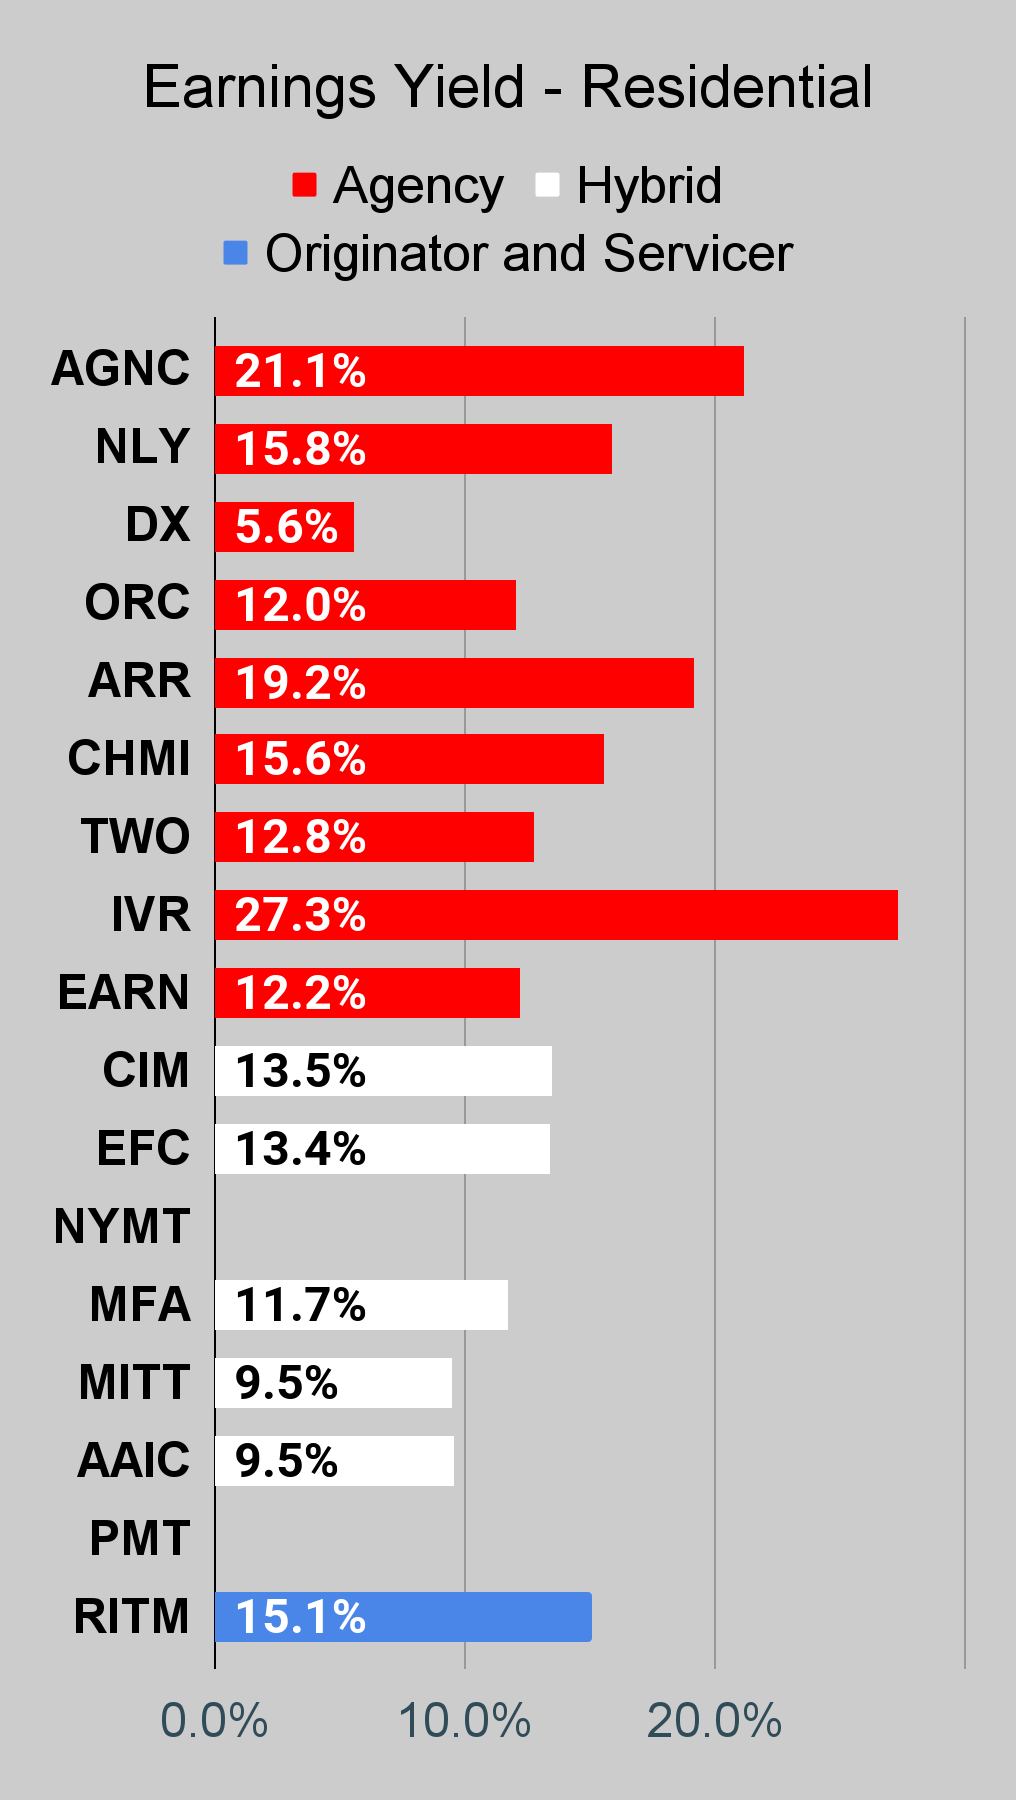
Note: The chart for our public articles uses the book value per share from the latest earnings release. Current estimated book value per share is used in reaching our targets and trading decisions. It is available in our service, but those estimates are not included in the charts below. PMT and NYMT are not showing an earnings yield metric as neither REIT provides a quarterly “Core EPS” metric.
Second Note: Due to the way historical amortized cost and hedging is factored into the earnings metrics, it is possible for two mortgage REITs with similar portfolios to post materially different metrics for earnings. I would be very cautious about putting much emphasis on the consensus analyst estimate (which is used to determine the earnings yield). In particular, throughout late 2022 the earnings metric became less comparable for many REITs.
Commercial Mortgage REIT Charts
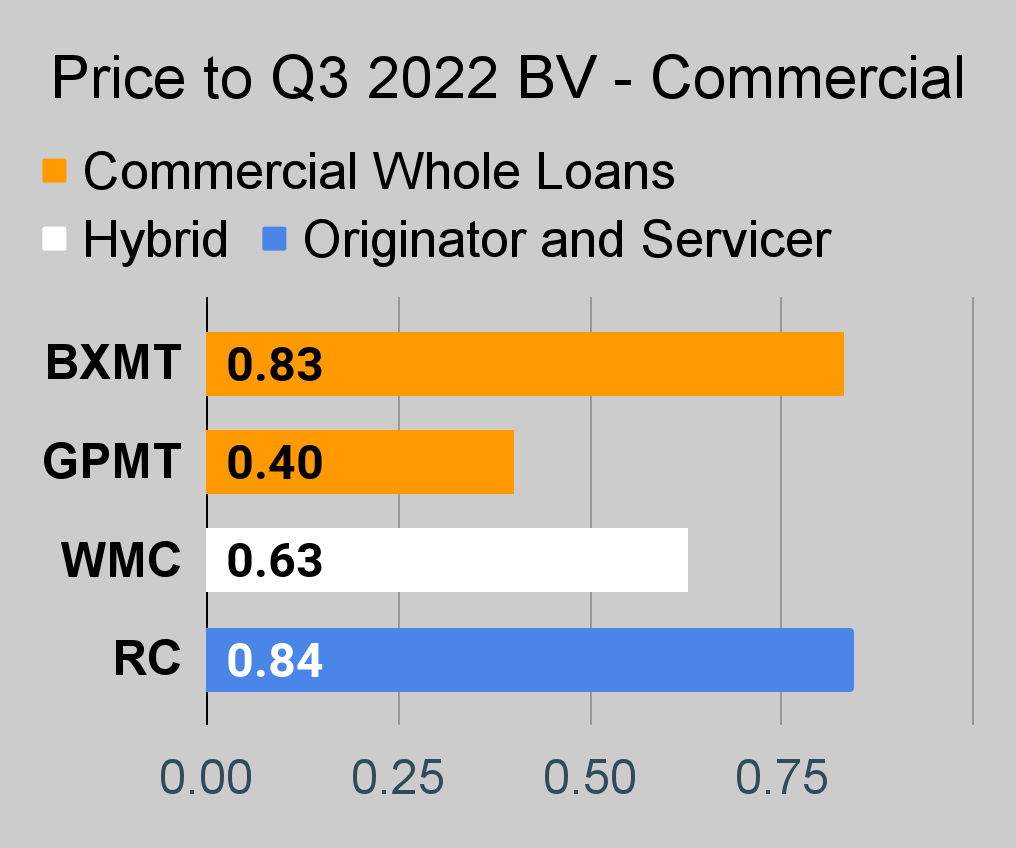
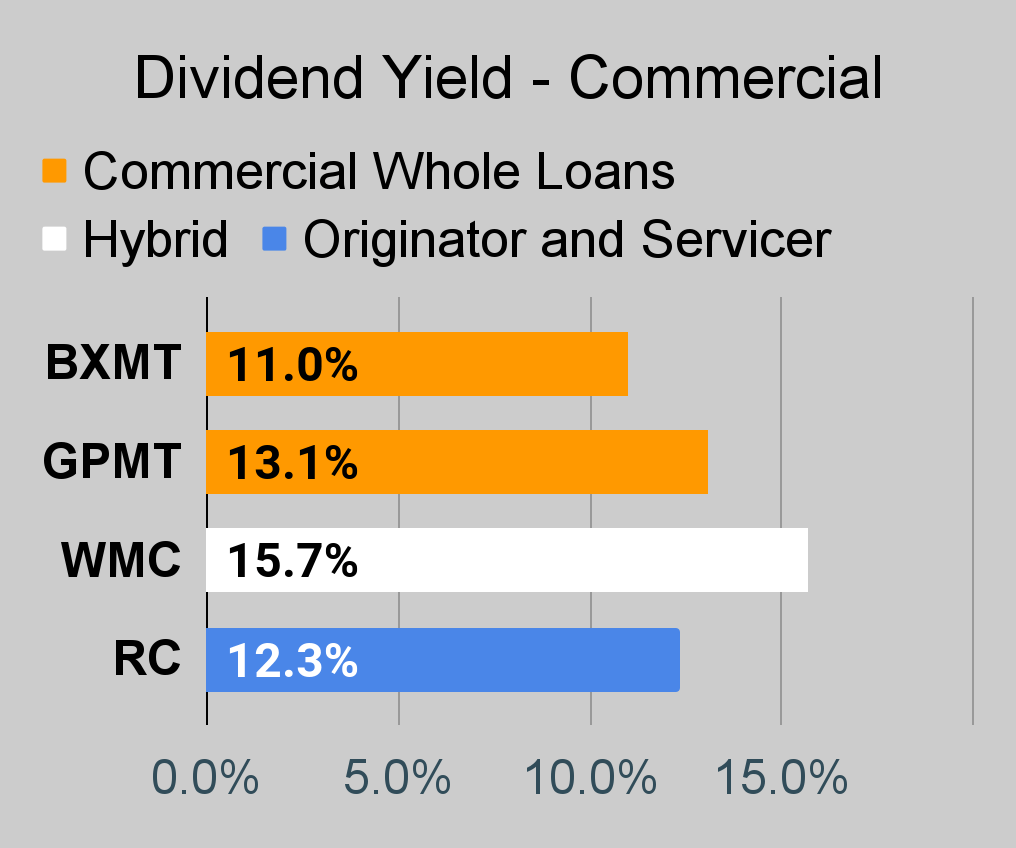
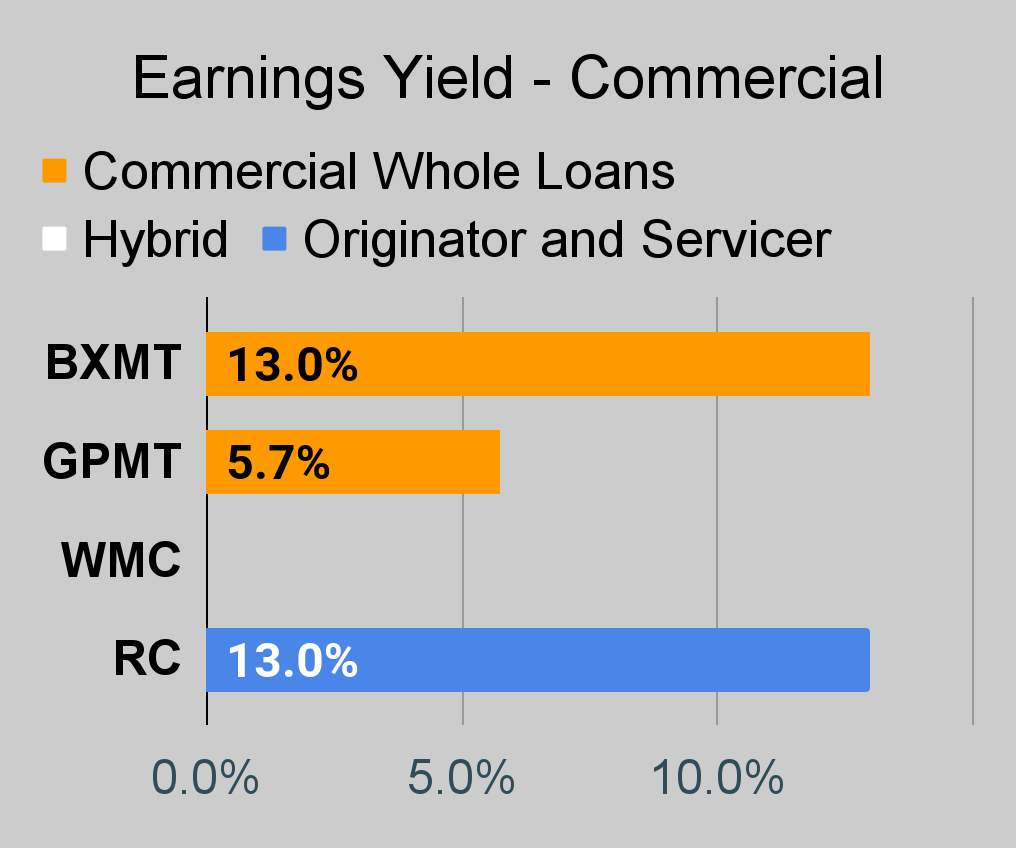
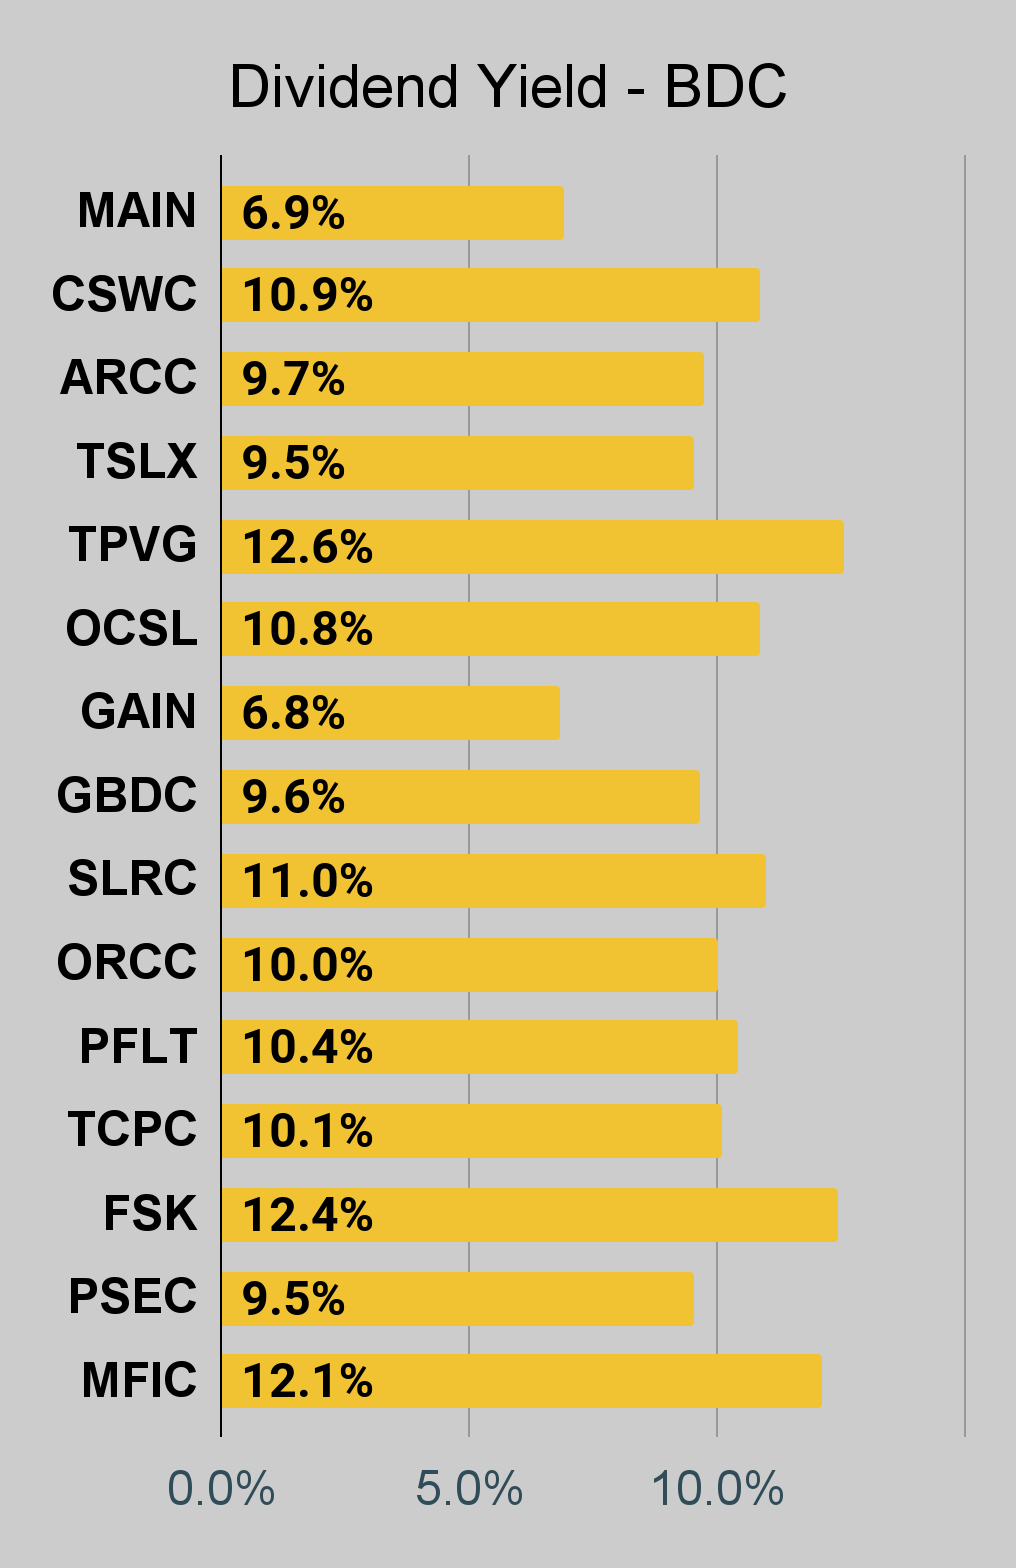
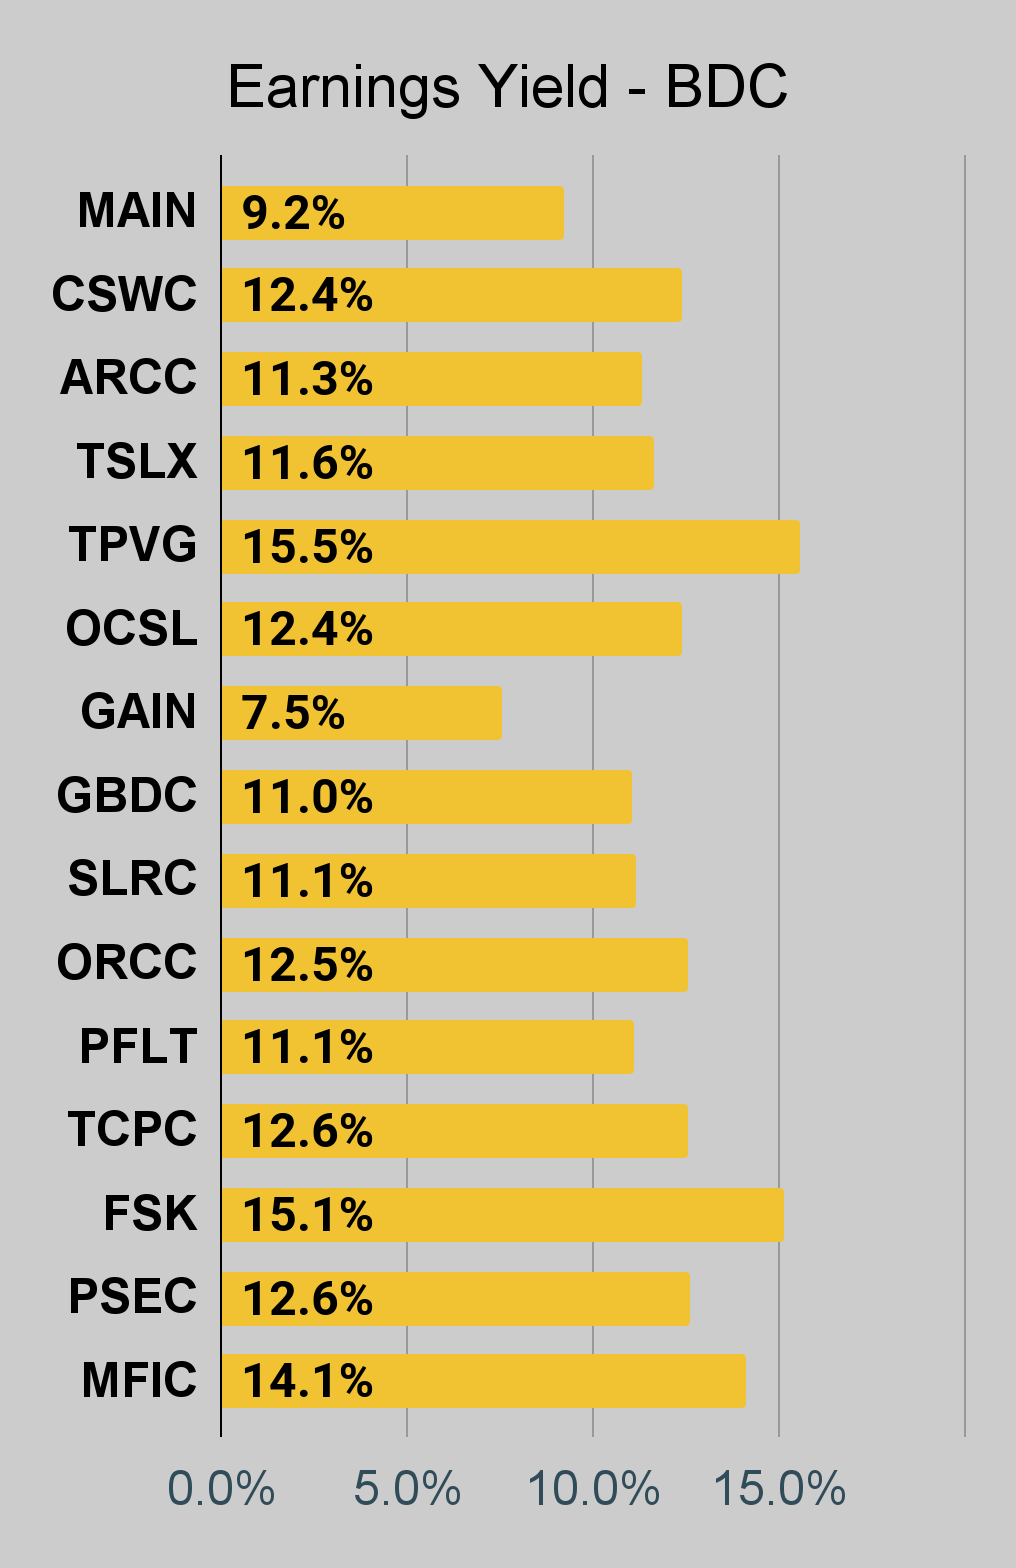
BDC Charts
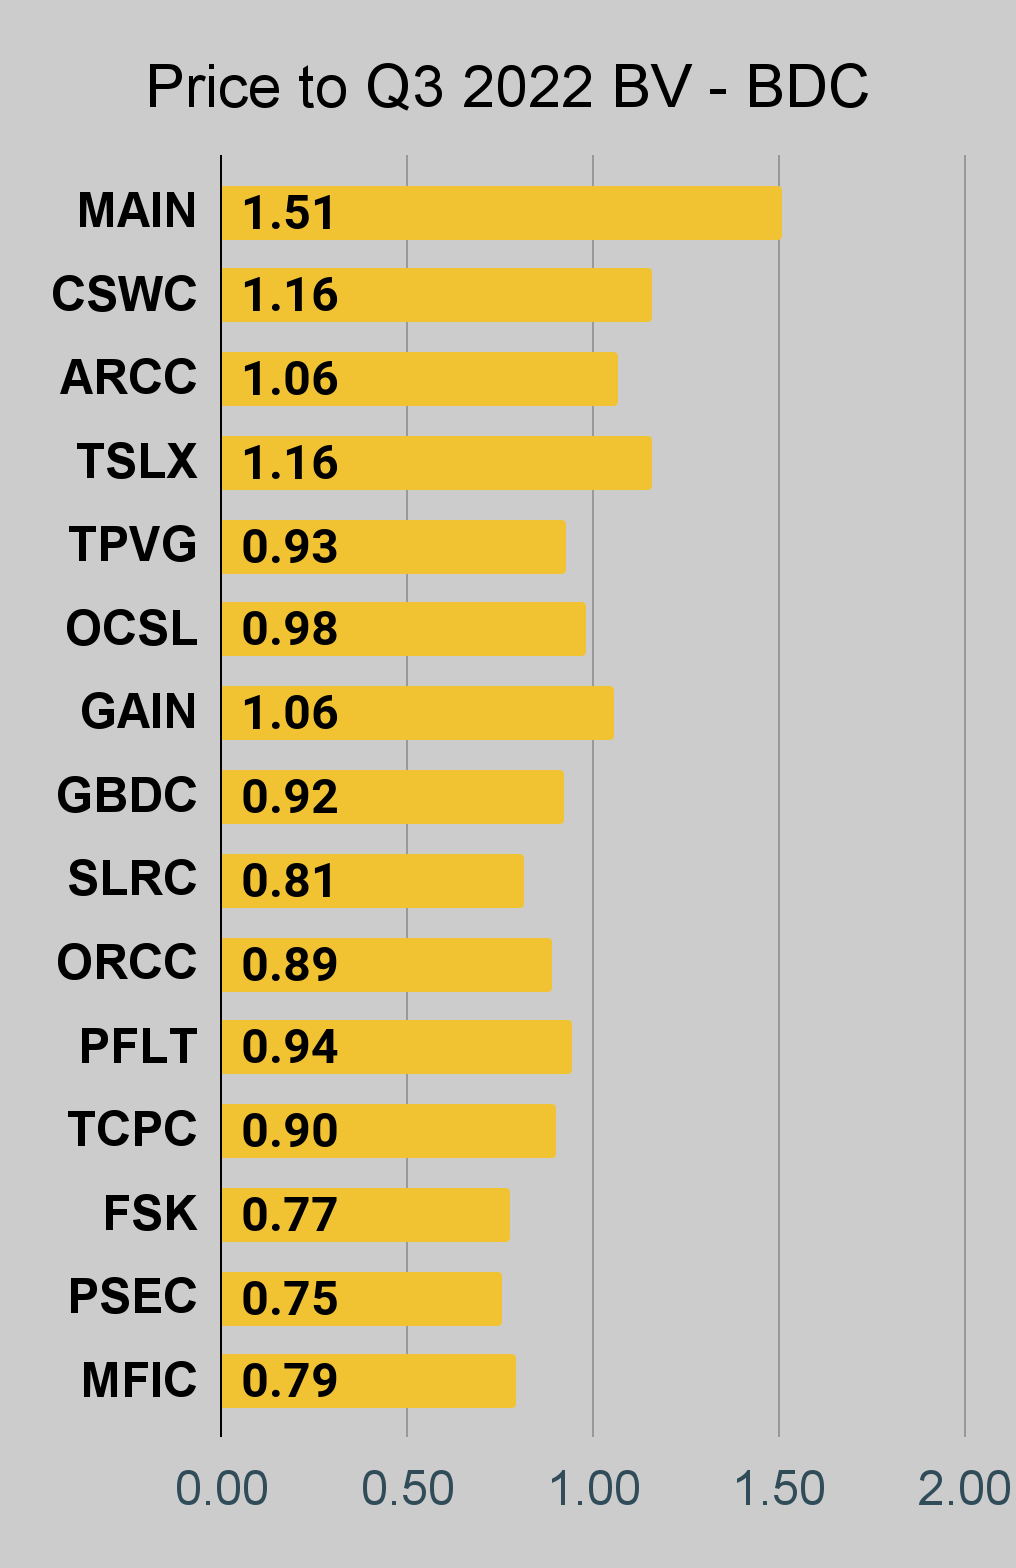
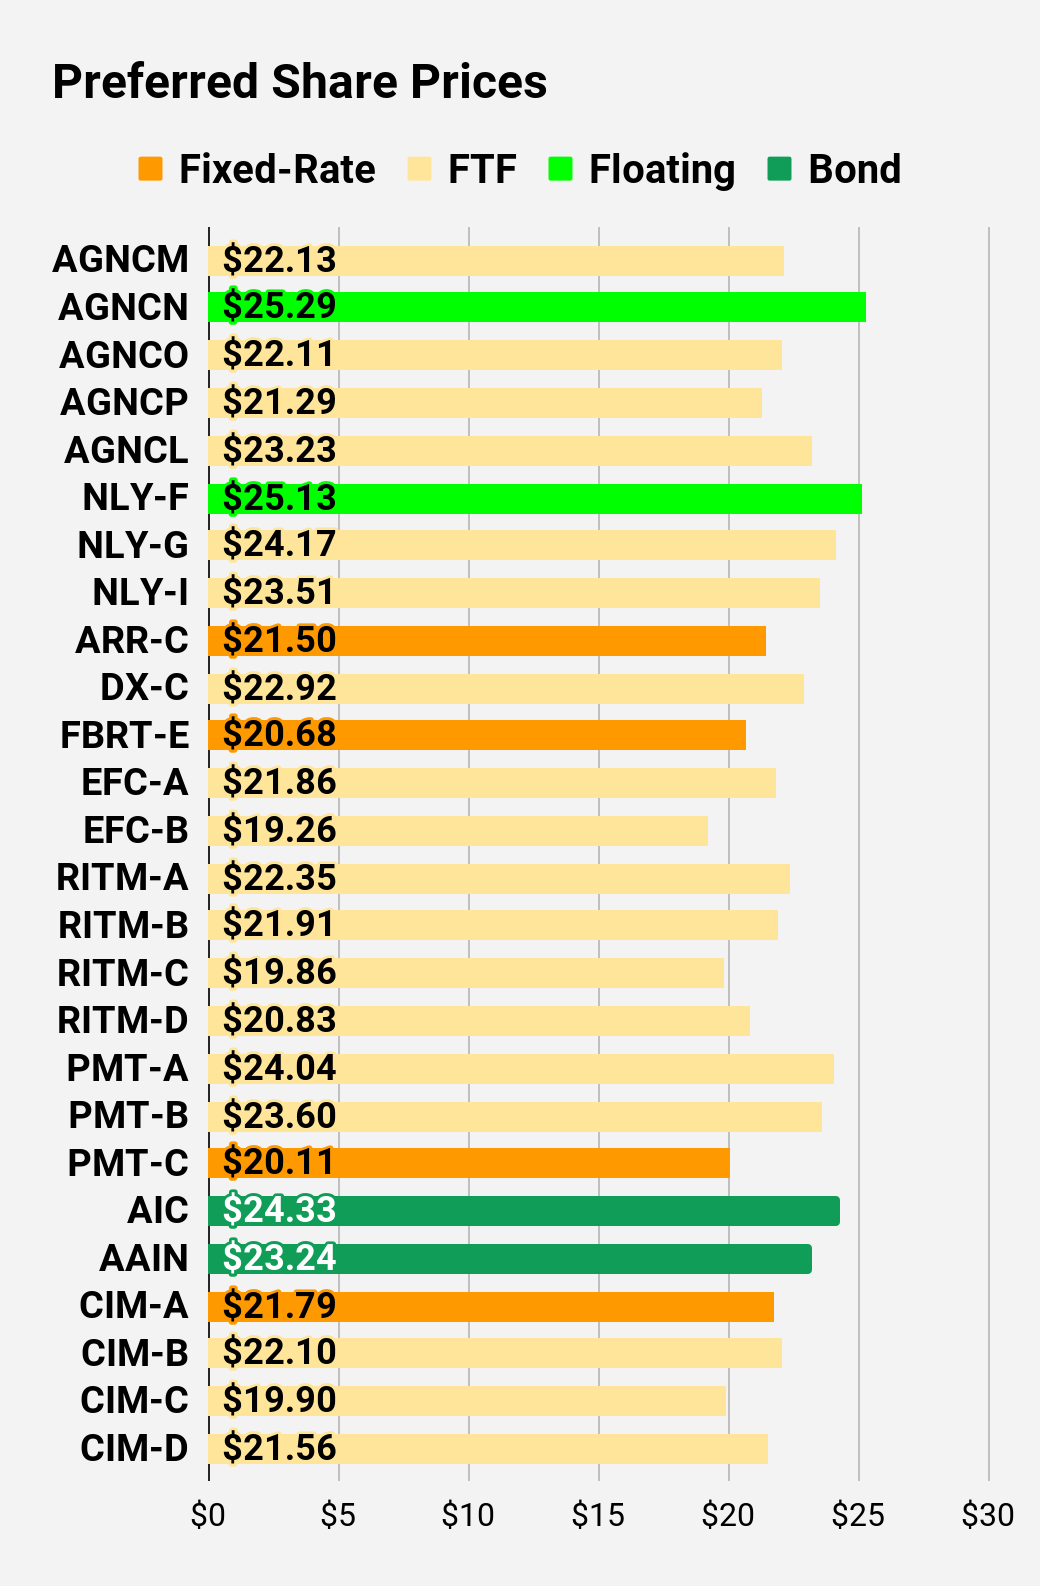
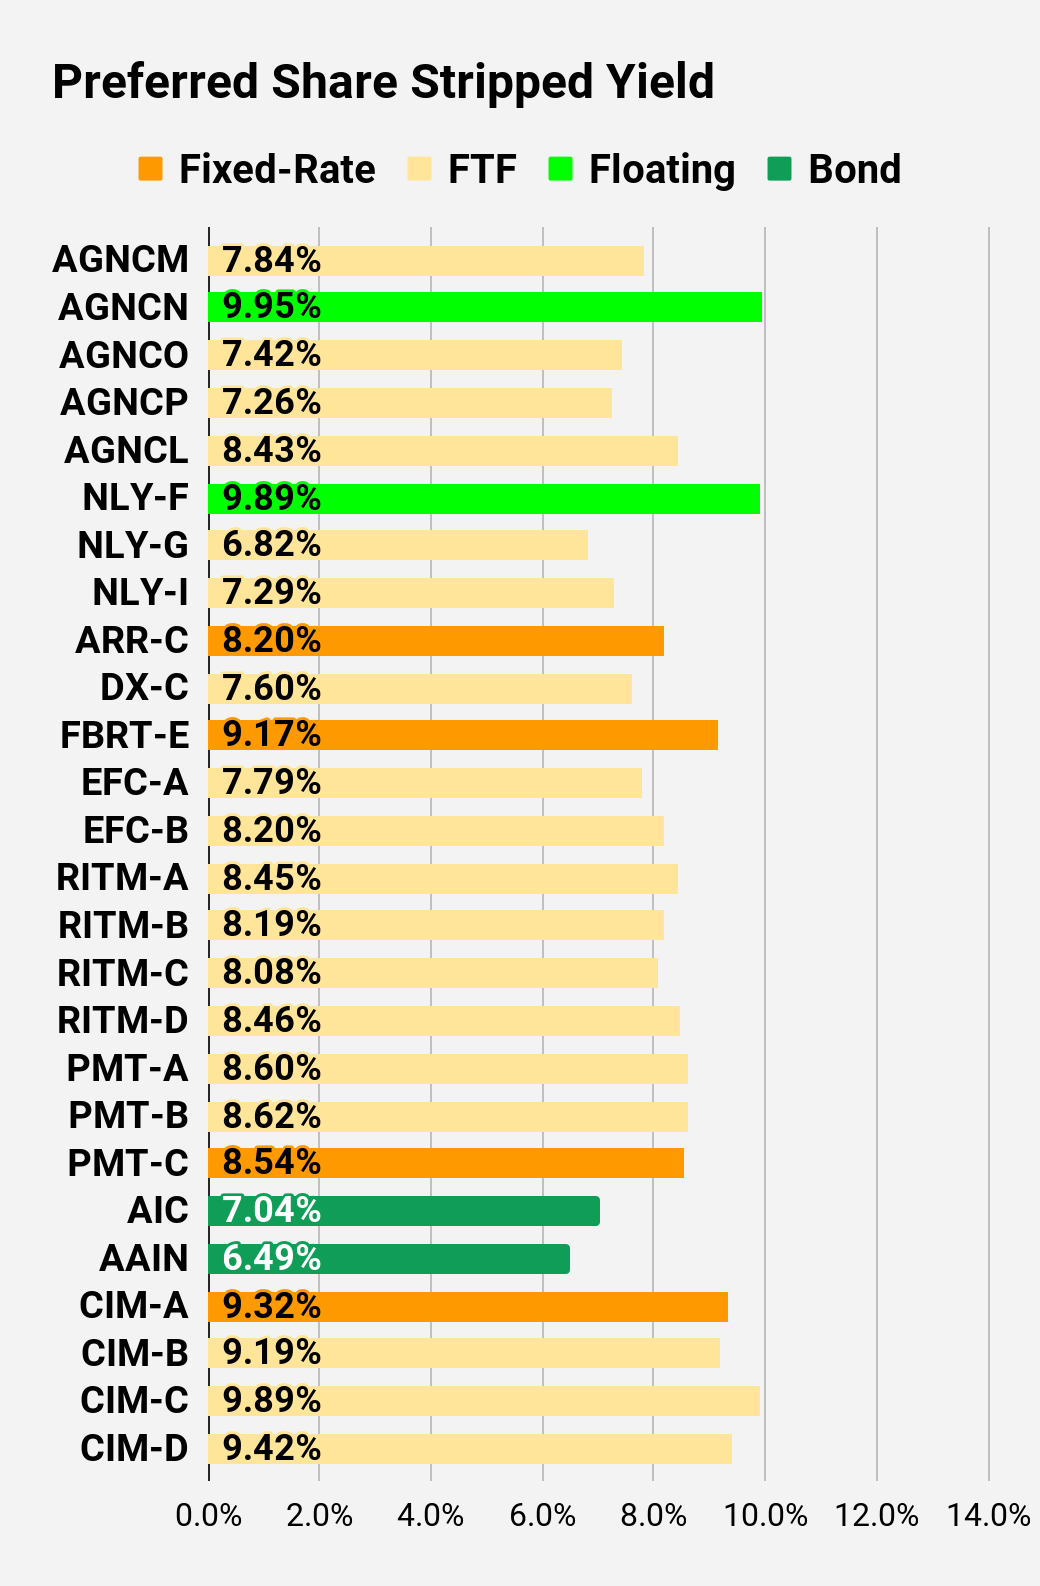
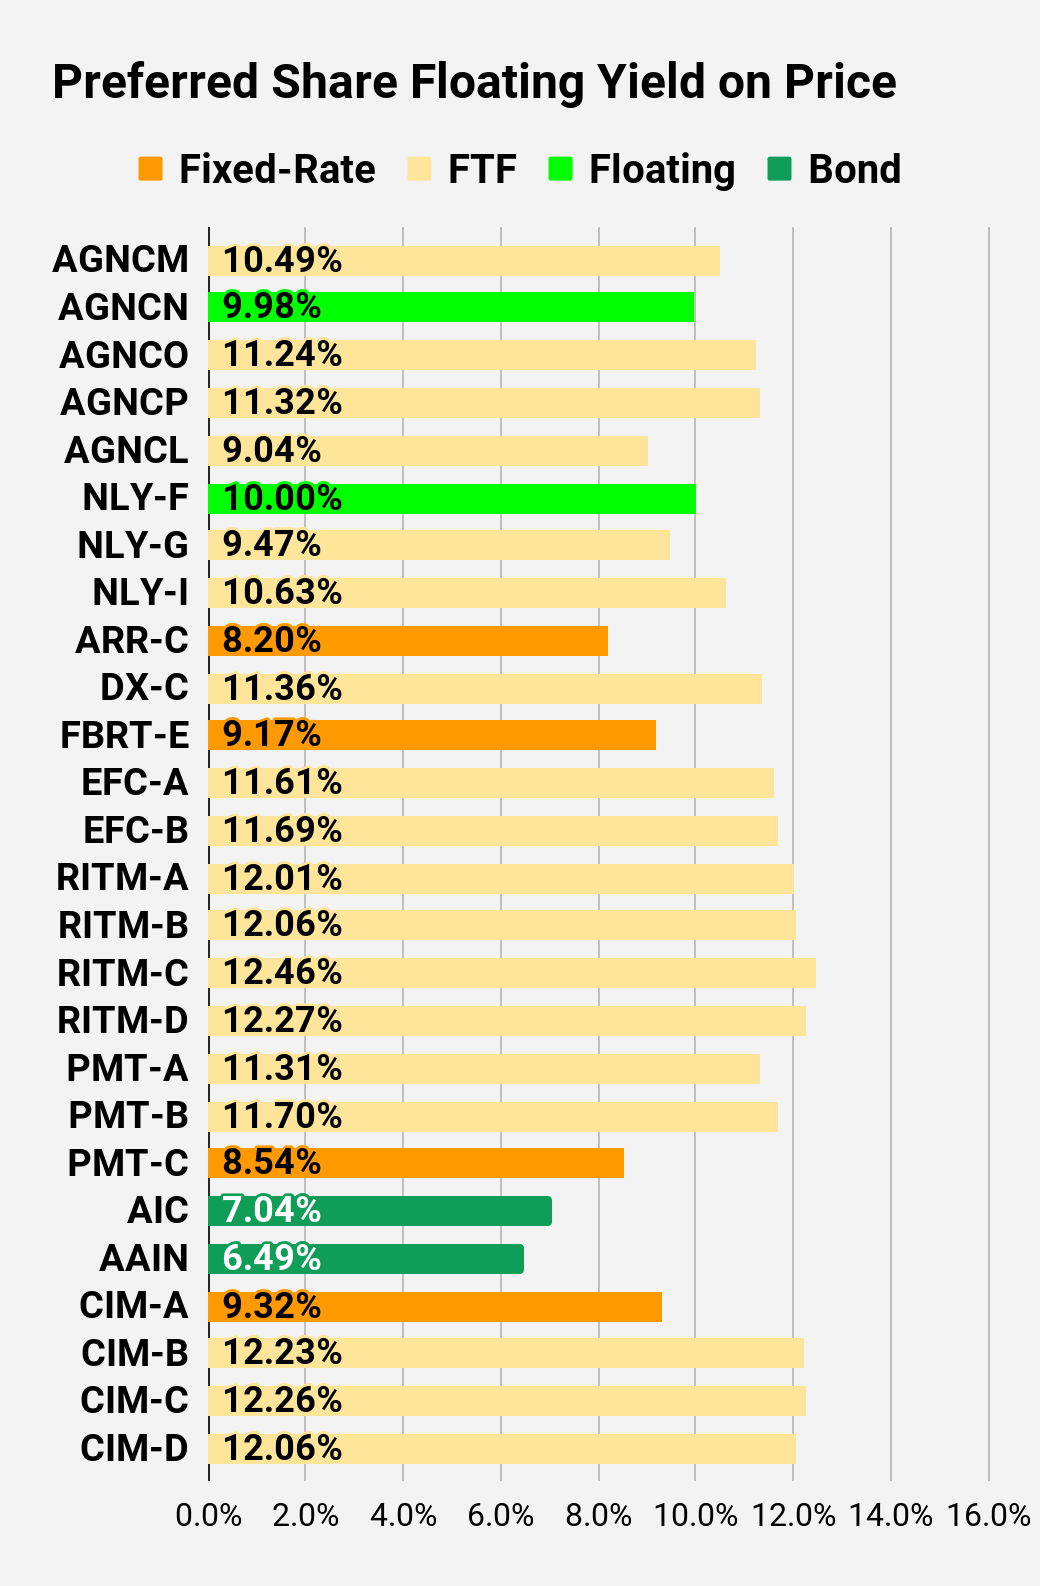
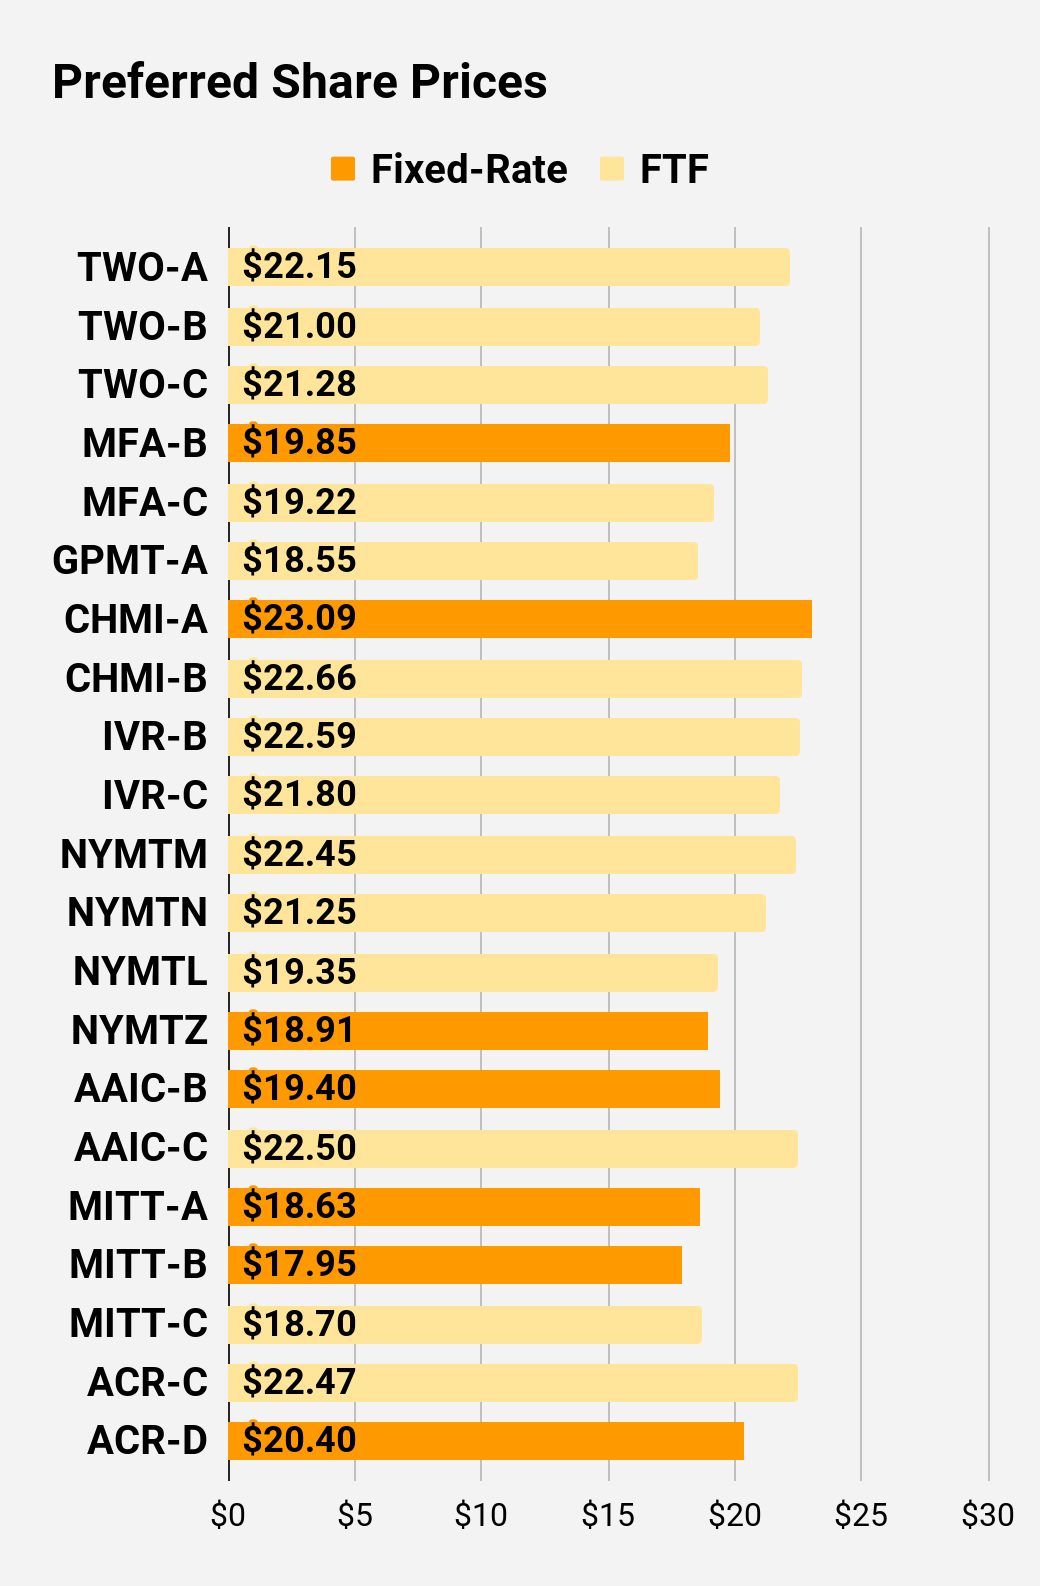
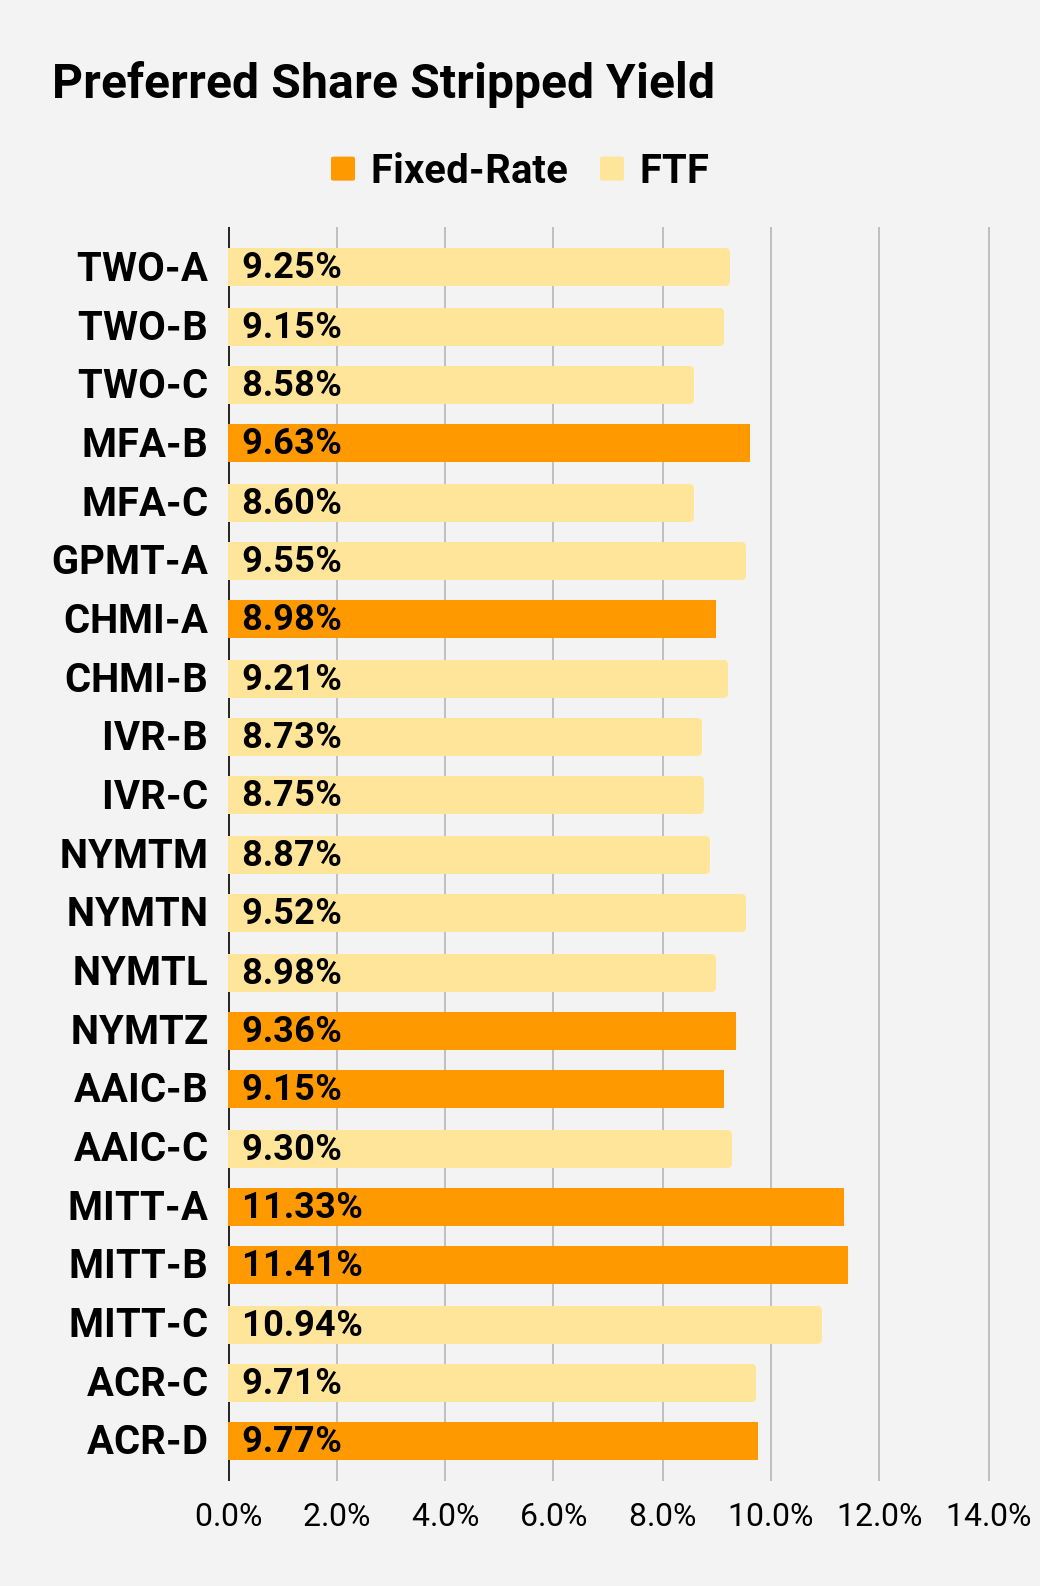
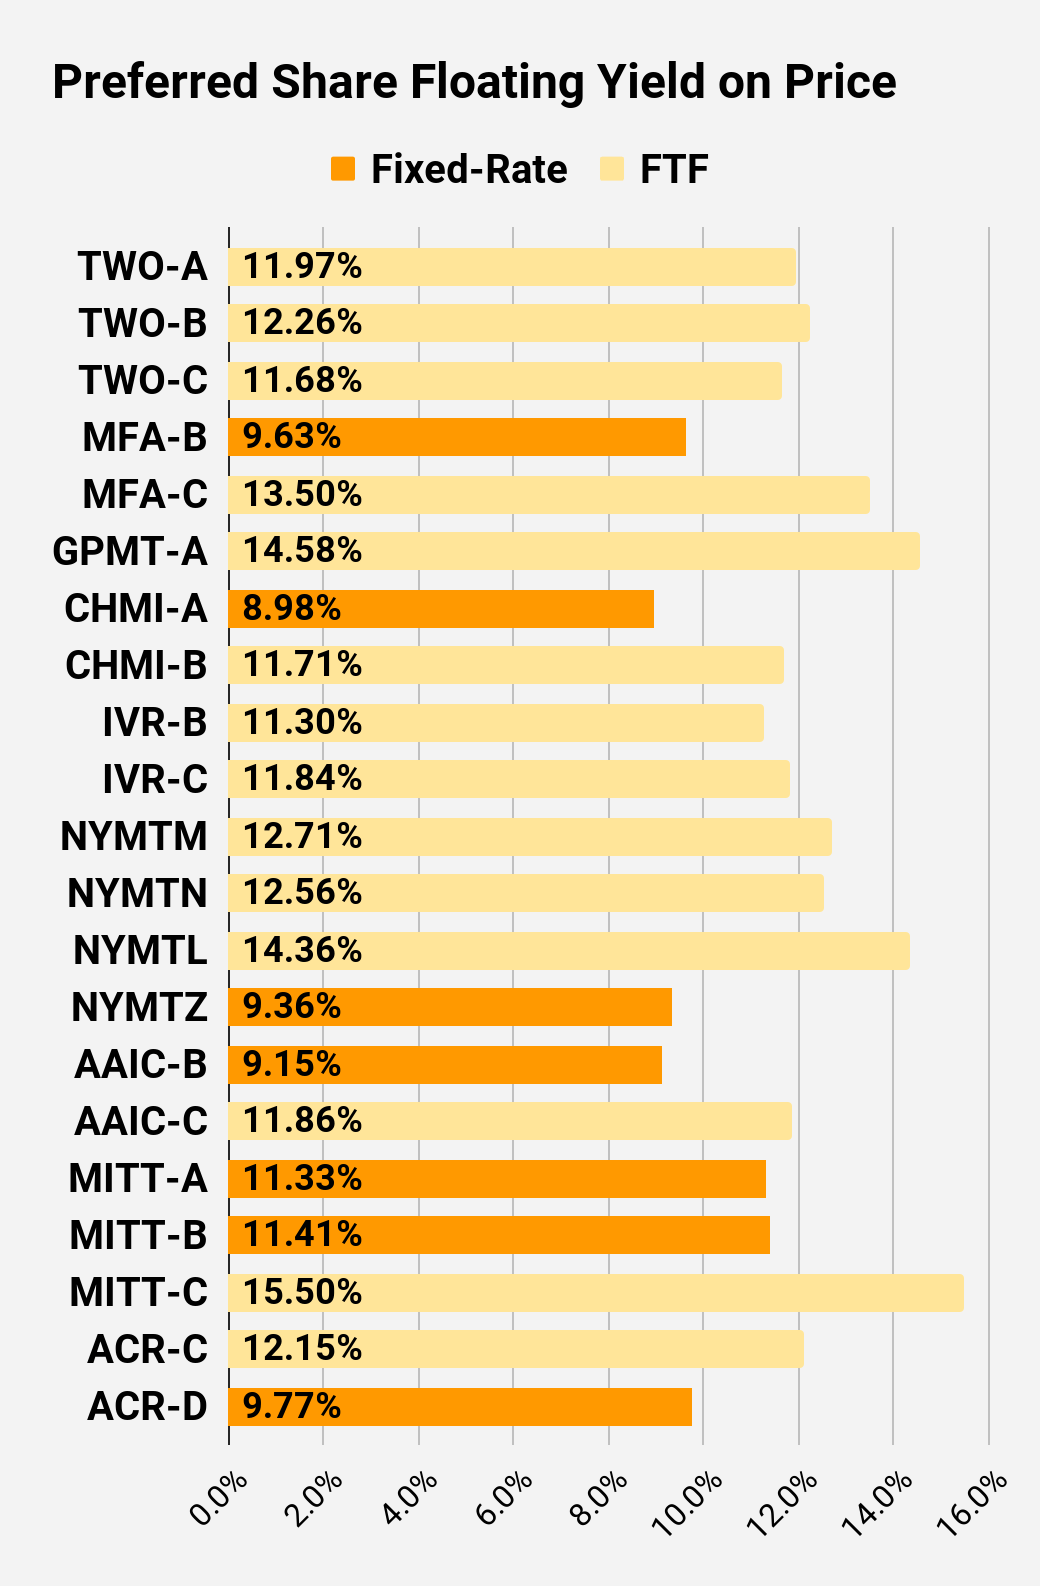
Preferred Share Charts
I changed the coloring a bit. We needed to adjust to include that the first fixed-to-floating shares have transitioned over to floating rates. When a share is already floating, the stripped yield may be different from the “Floating Yield on Price” due to changes in interest rates. For instance, NLY-F already has a floating rate. However, the rate is only reset once per three months. The stripped yield is calculated using the upcoming projected dividend payment and the “Floating Yield on Price” is based on where the dividend would be if the rate reset today. In my opinion, for these shares the “Floating Yield on Price” is clearly the more important metric.
Preferred Share Data
Beyond the charts, we’re also providing our readers with access to several other metrics for the preferred shares.
After testing out a series on preferred shares, we decided to try merging it into the series on common shares. After all, we are still talking about positions in mortgage REITs. We don’t have any desire to cover preferred shares without cumulative dividends, so any preferred shares you see in our column will have cumulative dividends. You can verify that by using Quantum Online. We’ve included the links in the table below.
To better organize the table, we needed to abbreviate column names as follows:
- Price = Recent Share Price - Shown in Charts
- BoF = Bond or FTF (Fixed-to-Floating)
- S-Yield = Stripped Yield - Shown in Charts
- Coupon = Initial Fixed-Rate Coupon
- FYoP = Floating Yield on Price - Shown in Charts
- NCD = Next Call Date (the soonest shares could be called)
- Note: For all FTF issues, the floating rate would start on NCD.
- WCC = Worst Cash to Call (lowest net cash return possible from a call)
- QO Link = Link to Quantum Online Page
| Ticker |
| Price |
| BoF |
| S-Yield |
| Coupon |
| FYoP |
| NCD |
| WCC |
| QO Link |
| P-Link |
| $22.13 |
| FTF |
| 7.84% |
| 6.88% |
| 10.49% |
| 4/15/2024 |
| $5.03 |
| $25.29 |
| Floating |
| 9.95% |
| 9.94% |
| 9.98% |
| 3/14/2023 |
| $0.12 |
| $22.11 |
| FTF |
| 7.42% |
| 6.50% |
| 11.24% |
| 10/15/2024 |
| $5.75 |
| $21.29 |
| FTF |
| 7.26% |
| 6.13% |
| 11.32% |
| 4/15/2025 |
| $7.16 |
| $23.23 |
| FTF |
| 8.43% |
| 7.75% |
| 9.04% |
| 10/15/2027 |
| $10.99 |
| $25.13 |
| Floating |
| 9.89% |
| 9.75% |
| 10.00% |
| 3/14/2023 |
| $0.37 |
| $24.17 |
| FTF |
| 6.82% |
| 6.50% |
| 9.47% |
| 3/31/2023 |
| $1.24 |
| $23.51 |
| FTF |
| 7.29% |
| 6.75% |
| 10.63% |
| 6/30/2024 |
| $4.03 |
| $21.50 |
| 8.20% |
| 7.00% |
| 8.20% |
| 1/28/2025 |
| $7.01 |
| $22.92 |
| FTF |
| 7.60% |
| 6.90% |
| 11.36% |
| 4/15/2025 |
| $5.96 |
| $20.68 |
| 9.17% |
| 7.50% |
| 9.17% |
| 3/14/2023 |
| $4.62 |
| $21.86 |
| FTF |
| 7.79% |
| 6.75% |
| 11.61% |
| 10/30/2024 |
| $6.10 |
| $19.26 |
| FTF |
| 8.20% |
| 6.25% |
| 11.69% |
| 1/30/2027 |
| $12.00 |
| $22.35 |
| FTF |
| 8.45% |
| 7.50% |
| 12.01% |
| 8/15/2024 |
| $5.48 |
| $21.91 |
| FTF |
| 8.19% |
| 7.13% |
| 12.06% |
| 8/15/2024 |
| $5.78 |
| $19.86 |
| FTF |
| 8.08% |
| 6.38% |
| 12.46% |
| 2/15/2025 |
| $8.35 |
| $20.83 |
| FTF |
| 8.46% |
| 7.00% |
| 12.27% |
| 11/15/2026 |
| $10.75 |
| $24.04 |
| FTF |
| 8.60% |
| 8.13% |
| 11.31% |
| 3/15/2024 |
| $3.50 |
| $23.60 |
| FTF |
| 8.62% |
| 8.00% |
| 11.70% |
| 6/15/2024 |
| $4.41 |
| $20.11 |
| 8.54% |
| 6.75% |
| 8.54% |
| 8/24/2026 |
| $11.13 |
| $24.33 |
| Bond |
| 7.04% |
| 6.75% |
| 7.04% |
| 3/14/2023 |
| $1.07 |
| $23.24 |
| Bond |
| 6.49% |
| 6.00% |
| 6.49% |
| 8/1/2023 |
| $2.50 |
| $21.79 |
| 9.32% |
| 8.00% |
| 9.32% |
| 3/14/2023 |
| $3.62 |
| $22.10 |
| FTF |
| 9.19% |
| 8.00% |
| 12.23% |
| 3/30/2024 |
| $5.40 |
| $19.90 |
| FTF |
| 9.89% |
| 7.75% |
| 12.26% |
| 9/30/2025 |
| $10.44 |
| $21.56 |
| FTF |
| 9.42% |
| 8.00% |
| 12.06% |
| 03/30/2024 |
| $5.94 |
Second Batch:
| Ticker |
| Price |
| BoF |
| S-Yield |
| Coupon |
| FYoP |
| NCD |
| WCC |
| QO Link |
| P-Link |
| $22.15 |
| FTF |
| 9.25% |
| 8.13% |
| 11.97% |
| 04/27/2027 |
| $11.48 |
| $21.00 |
| FTF |
| 9.15% |
| 7.63% |
| 12.26% |
| 07/27/2027 |
| $12.57 |
| $21.28 |
| FTF |
| 8.58% |
| 7.25% |
| 11.68% |
| 1/27/2025 |
| $7.35 |
| $19.85 |
| 9.63% |
| 7.50% |
| 9.63% |
| 3/14/2023 |
| $5.53 |
| $19.22 |
| FTF |
| 8.60% |
| 6.50% |
| 13.50% |
| 3/31/2025 |
| $9.44 |
| $18.55 |
| FTF |
| 9.55% |
| 7.00% |
| 14.58% |
| 11/30/2026 |
| $13.23 |
| $23.09 |
| 8.98% |
| 8.20% |
| 8.98% |
| 3/14/2023 |
| $2.16 |
| $22.66 |
| FTF |
| 9.21% |
| 8.25% |
| 11.71% |
| 4/15/2024 |
| $4.84 |
| $22.59 |
| FTF |
| 8.73% |
| 7.75% |
| 11.30% |
| 12/27/2024 |
| $6.31 |
| $21.80 |
| FTF |
| 8.75% |
| 7.50% |
| 11.84% |
| 9/27/2027 |
| $12.13 |
| $22.45 |
| FTF |
| 8.87% |
| 7.88% |
| 12.71% |
| 1/15/2025 |
| $6.49 |
| $21.25 |
| FTF |
| 9.52% |
| 8.00% |
| 12.56% |
| 10/15/2027 |
| $13.25 |
| $19.35 |
| FTF |
| 8.98% |
| 6.88% |
| 14.36% |
| 10/15/2026 |
| $12.10 |
| $18.91 |
| 9.36% |
| 7.00% |
| 9.36% |
| 1/15/2027 |
| $13.10 |
| $19.40 |
| 9.15% |
| 7.00% |
| 9.15% |
| 3/14/2023 |
| $5.87 |
| $22.50 |
| FTF |
| 9.30% |
| 8.25% |
| 11.86% |
| 3/30/2024 |
| $4.97 |
| $18.63 |
| 11.33% |
| 8.25% |
| 11.33% |
| 3/14/2023 |
| $6.83 |
| $17.95 |
| 11.41% |
| 8.00% |
| 11.41% |
| 3/14/2023 |
| $7.49 |
| $18.70 |
| FTF |
| 10.94% |
| 8.00% |
| 15.50% |
| 9/17/2024 |
| $9.77 |
| $22.47 |
| FTF |
| 9.71% |
| 8.63% |
| 12.15% |
| 7/30/2024 |
| $5.77 |
| $20.40 |
| 9.77% |
| 7.88% |
| 9.77% |
| 5/21/2026 |
| $11.12 |
Strategy
Our goal is to maximize total returns . We achieve those most effectively by including “trading” strategies. We regularly trade positions in the mortgage REIT common shares and BDCs because:
- Prices are inefficient.
- Long term, share prices generally revolve around book value.
- Short term, price-to-book ratios can deviate materially.
- Book value isn’t the only step in analysis, but it's the cornerstone.
We also allocate to preferred shares and equity REITs. We encourage buy-and-hold investors to consider using more preferred shares and equity REITs.
Performance
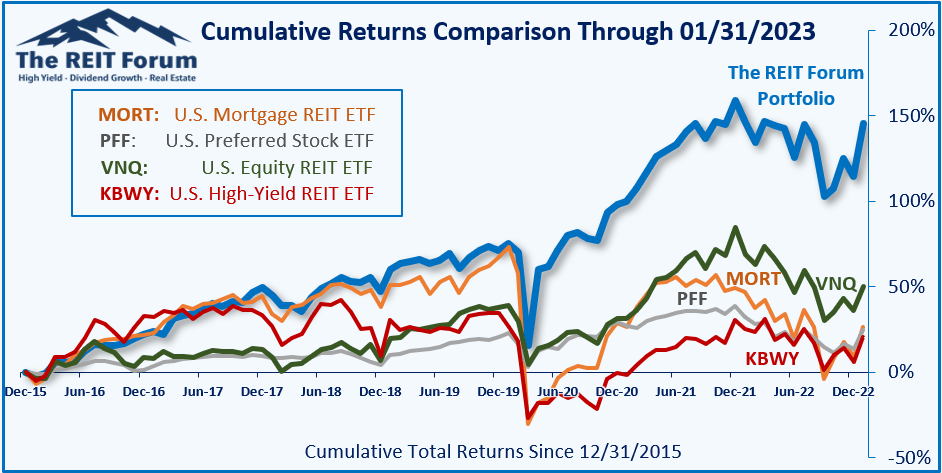
We compare our performance against four ETFs that investors might use for exposure to our sectors:
The REIT Forum
The four ETFs we use for comparison are:
| Ticker |
| Exposure |
| One of the largest mortgage REIT ETFs |
| One of the largest preferred share ETFs |
| Largest equity REIT ETF |
| The high-yield equity REIT ETF. Yes, it has been dreadful. |
When investors think it isn’t possible to earn solid returns in preferred shares or mortgage REITs, we politely disagree. The sector has plenty of opportunities, but investors still need to be wary of the risks. We can’t simply reach for yield and hope for the best. When it comes to common shares, we need to be even more vigilant to protect our principal by regularly watching prices and updating estimates for book value and price targets.
- Ratings: Bearish on CHMI.
For further details see:
Dump This Fat 16% Yield Before The Cut