SPLV - DURA: A 3.40% Yield Haven With Low Valuation And Volatility
Summary
- DURA tracks the Morningstar US Dividend Valuation Index, selecting high-quality, high-yielding companies with attractive valuations. DURA's expense ratio is 0.29% and has $97 million in AUM.
- An unadvertised feature is DURA's low 0.77 five-year beta. Combined with an expected 3.39% dividend yield and a 15.87x forward earnings valuation, you won't find many other similar ETFs.
- This article compares DURA with a few of them like SPHD, LVHD, and SPLV. All three peers have lower earnings and dividend growth and a higher valuation.
- Despite a poor track record, DURA is a solid choice for defensive dividend investors. However, low-volatility ETFs already outperformed last year, and potential rewards may be limited in 2023.
- I've rated DURA a hold, and will recommend another fund that high-yield investors should consider instead.
Investment Thesis
Today, I'm excited to initiate coverage on the VanEck Morningstar Durable Dividend ETF ( DURA ). DURA's objectives include delivering a high dividend yield by selecting U.S. equities with low valuations and strong balance sheets. However, low volatility is an unmentioned feature and a key differentiator. This article will demonstrate how DURA compares fundamentally against peers like SPHD , LVHD , SPLV , and SCHD . DURA's performance track record isn't strong, but I'm asking readers to set that aside and focus on what the portfolio offers today. For conservative dividend investors, I think you'll like what you see.
DURA Overview
Strategy Discussion and Fund Basics
DURA tracks the Morningstar US Dividend Valuation Index , reconstituting semi-annually in March and September and selecting constituents based on their dividend yields, financial health, and valuation. Eligibility is based on the following three initial screens:
- security must have paid a dividend over the last twelve months
- security's dividend must be qualified income (e.g., no REITs)
- security must have a fair value estimate assigned by Morningstar
Furthermore, constituents must pass the following dividend yield, financial health, and valuation screens:
- security must be in the top 50% by trailing twelve-month dividend yield of all qualified dividend payers in the Morningstar US Market Index
- a company must have a Distance to Default score in the top 50% within its peer group. This score combines market data with financial report items to measure a firm's financial stability and is proprietary to Morningstar.
- a company must not be within the 30% most overvalued in the eligible universe, as measured by Morningstar's proprietary Star Score . The Star score adjusts a company's price to fair value ratio by an uncertainty factor.
There is no fixed number of securities permitted in the Index. Instead, the number of securities is subject to the selection and eligibility criteria described above at each reconstitution date. The Index is dividend-dollar weighted, where a security's weight is based on the product of its trailing dividend yield and the number of outstanding shares. Finally, weights are capped at 5% per security, and the ETF has a 0.29% expense ratio and $96.9 million in assets under management.
Sector Exposures and Top Ten Holdings
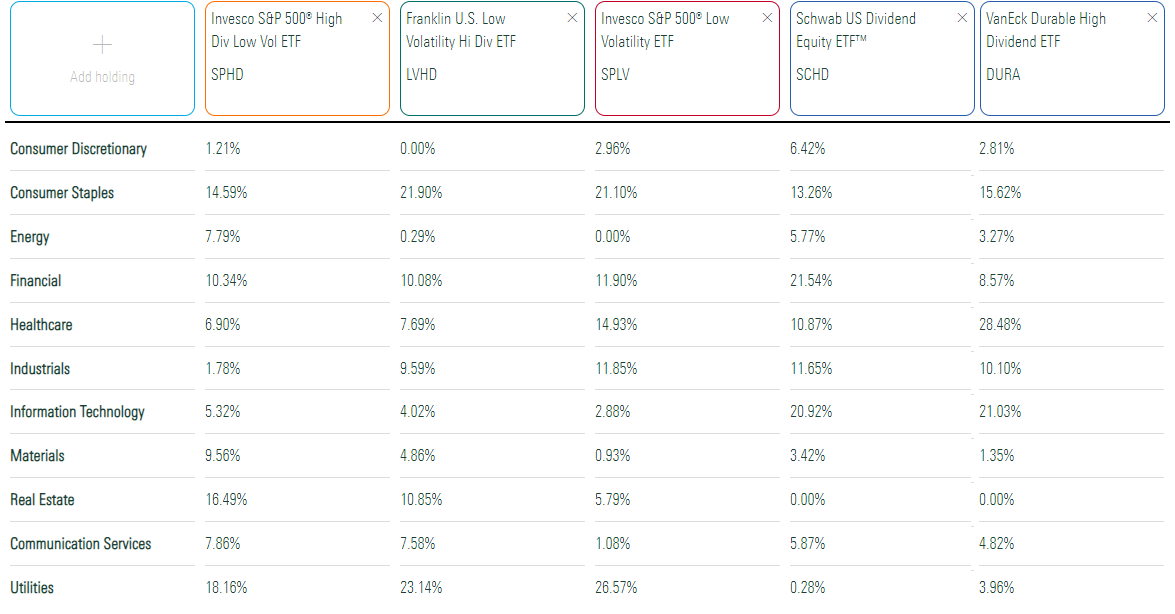
DURA overweights Health Care (28.48%) and Consumer Staples (15.62%) while still maintaining a high exposure to the Technology sector (21.03%). The table below also includes sector exposures for SPHD, LVHD, SPLV, and SCHD. DURA borrows certain aspects of each of these ETFs, described shortly.
Morningstar
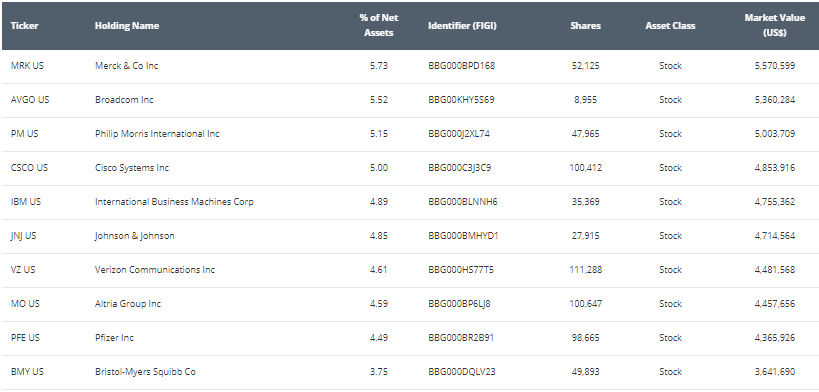
DURA's top ten holdings total 48.58% and are listed below. The ETF breached the 5% limit for several stocks like Merck & Co. ( MRK ), Broadcom ( AVGO ), and Philip Morris International ( PM ). This issue will correct itself at the subsequent semi-annual reconstitution. Pfizer ( PFE ) was a new addition in September after previously failing Morningstar's Distance To Default screen.
VanEck
DURA Performance Analysis
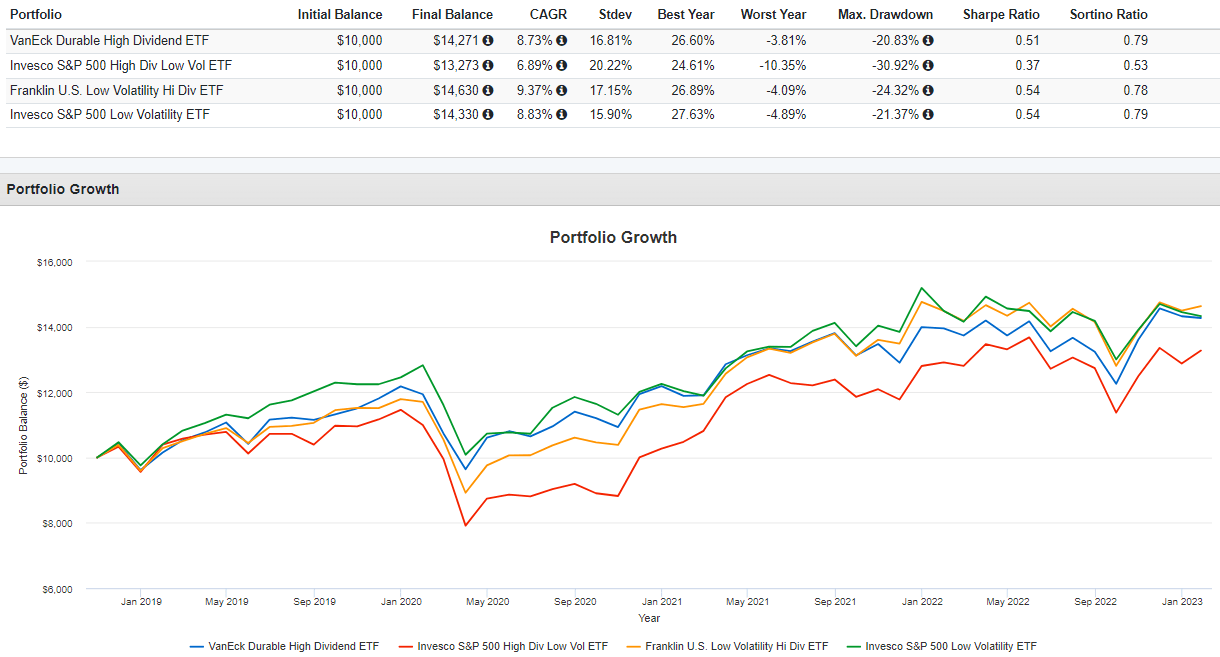
The following chart compares DURA's returns since October 2018 with SPHD, LVHD, and SPLV. The lookback period is short, but DURA's 8.73% annualized returns were pretty decent. LVHD and SPLV outperformed at 9.37% and 8.83%, but SPHD underperformed at 6.89%. I chose these comparators because even though low volatility isn't an objective, DURA still succeeds on that factor. DURA's risk-adjusted returns (Sharpe and Sortino Ratio) are strong, and the ETF lost just 20.83% in the Q1 2020 crash.
Portfolio Visualizer
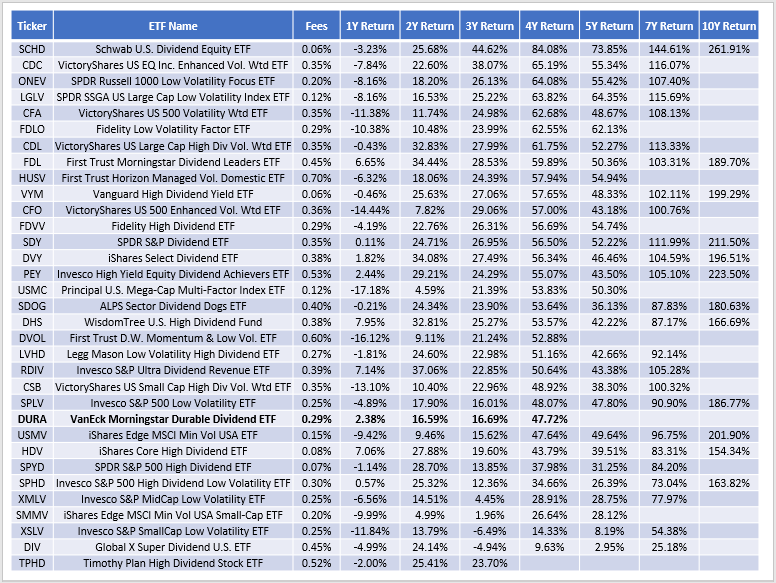
For reference, SCHD's annualized return was 14.33% over this period. I mention this because SCHD offers an excellent combination of dividend yield and growth. While past performance isn't indicative of future results, some investors prefer buying an ETF with a better long-term track record. Here is a look at how competing high-dividend or low-volatility ETFs performed over 1-10 year periods through December 2022. I've sorted the list by four-year returns, as that's how many years ago DURA launched.
The Sunday Investor
DURA's four-year 47.72% return places #24 of 33 in this sample, which doesn't include ETFs with meager trading volume. In the last year, DURA's 2.38% gain was sixth-best, indicating it's likely better suited for investors wanting downside protection. Still, many other high-dividend or low-volatility ETFs have superior track records. If these results aren't a disqualifier, then let's look at the fundamentals of DURA's current portfolio next.
DURA Fundamentals
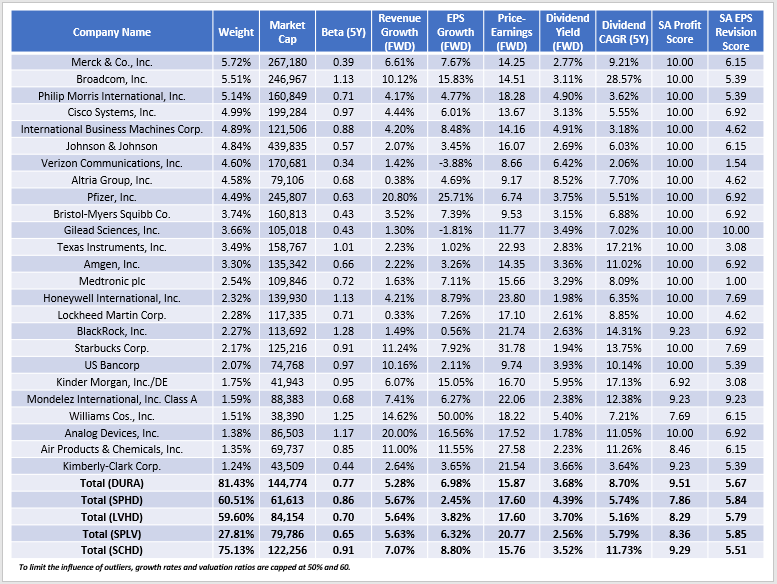
The following table highlights selected fundamental metrics for DURA's top 25 companies, totaling 81.43%. DURA's low 0.77 five-year beta high 3.68% gross dividend yield is a rare combination for a portfolio with a sizeable weighted-average market capitalization ($145 billion). Typically, low-volatility ETFs overweight Utilities, but DURA's exposure to this sector is only 4%.
The Sunday Investor
An advantage to limiting exposure to Utilities is higher potential growth. DURA has an estimated 6.98% sales and earnings growth rate, which may seem small until you consider the alternatives. SPHD's and LVHD's are only 2.45% and 3.82%. SPLV's is closer at 6.32%, and the only other option I could find was the First Trust Value Line Dividend ETF ( FVD ). FVD's five-year beta is 0.72, but its earnings growth rate is lower at 6.59%, its constituents yield only 3.01%, and net distributions will be far lower because of FVD's 0.67% fees.
Besides low volatility and high dividends, DURA trades at an attractive 15.87x forward earnings and has an excellent 9.51/10 Profitability Score. Utilities ETFs like XLU and VPU trade at about 20x forward earnings, and DURA's low exposure to this sector is due to valuation. DURA's six selections, led by Dominion Energy ( D ), trade between 15.18x and 19.30x forward earnings. Most top holdings trade below 25x forward earnings, and although some exceptions exist, DURA is one of the cheapest high-dividend ETFs available.
Despite these positives, I doubt DURA will outperform SCHD in the long run. SCHD's earnings growth rate is better at 8.60%, even though that's low on its own . Furthermore, the two ETFs will provide similar net distributions after fees (approximately 3.40-3.50%), but SCHD's constituents have raised dividends by 11.73% over the last five years compared to 8.70% for DURA. Based on the earlier table, several slow dividend growers occupy top spots in the fund.
Seeking Alpha
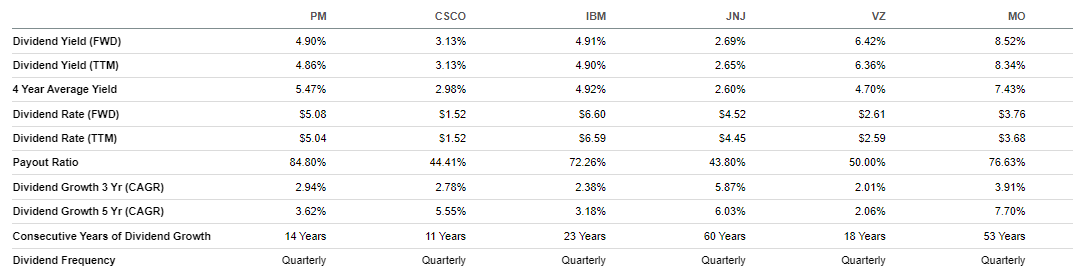
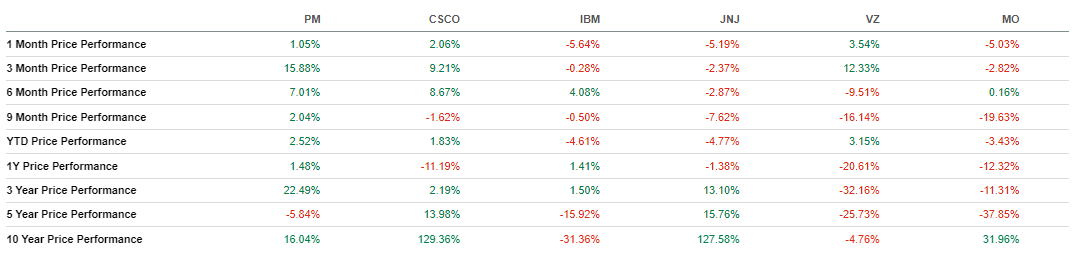
Philip Morris , Cisco Systems ( CSCO ), IBM ( IBM ), Johnson & Johnson ( JNJ ), Verizon Communications ( VZ ), and Altria Group ( MO ) are all dividend achievers with dividend raising streaks between 11-53 years. However, historical dividend growth rates are low and similar to their forecasted earnings growth. This may pressure DURA's 52.90% dividend payout ratio. I'm also concerned that these companies will continue to raise dividends regardless of results to maintain their track records. PM, IBM, VZ, and MO's share prices declined over the last five years and may be yield traps.
Seeking Alpha
Investment Recommendation
DURA is a large-cap dividend ETF expected to yield 3.39% after expenses. Its 0.77 five-year beta, 15.87x forward earnings valuation, and composition that mostly excludes Utilities stocks make it a unique offering that's superior to similar funds like SPHD, LVHD, and SPLV. These low-volatility ETFs typically sacrifice profitability, valuation, growth, and in some cases, all three. However, I like SCHD for its lower expense ratio, similar dividend yield, more robust growth profile, and better long-term track record. SCHD's 0.91 beta is higher, but that's closer to where I want to be, especially after a year when low-volatility ETFs already outperformed. Thank you for reading, and I look forward to discussing this further in the comments section below.
For further details see:
DURA: A 3.40% Yield Haven With Low Valuation And Volatility