CSCO - DURA: An ETF Seeking Dividends With Quality
2023-04-28 18:11:33 ET
Summary
- VanEck Durable High Dividend ETF is a large cap dividend fund with valuation and quality criteria.
- It is well-balanced across sectors, but quite concentrated in its top holdings.
- It looks better than the S&P 500 index in valuation and similar in quality.
- Past performance is average, but price history is too short to make a definitive statement.
This article series aims at evaluating ETFs (exchange-traded funds) regarding the relative past performance of their strategies and quality metrics of their current portfolios. Holdings and their weights change over time, so reviews are updated from time to time.
DURA strategy and portfolio
VanEck Durable High Dividend ETF (DURA) has been tracking the Morningstar US Dividend Valuation Index since 10/30/2018. As of writing, DURA has 73 holdings, a 12-month distribution yield of 3.05% and an expense ratio of 0.29%. Distributions are paid quarterly.
As described by Morningstar , eligible stocks must:
- Have paid a qualified dividend in the trailing 12-month period (real estate investment trust, or REITs, are excluded).
- Have fair value estimate assigned by the Morningstar Equity Research team.
- Be in the top 50% by trailing 12-months dividend yield of all qualified dividend payers.
- Have a Distance to Default score in the top 50% within its peer group (this is a proprietary Morningstar metric).
- Companies in the 30% most overvalued in the eligible universe by the star score metric are excluded (another Morningstar metric).
Some buffering rules are applied to limit turnover. The index is weighted by dividend dollars, with a maximum of 5% by constituent. It is reconstituted semi-annually.
The fund invests almost exclusively in U.S. companies (99.7% of asset value), with 87% of assets in large and mega caps. It is better balanced across sectors than the S&P 500 (SP500). The heaviest sector weighs 20% of asset value, whereas information technology represents 26% of the large cap benchmark. The top five sectors are healthcare (20.15%), technology (17.18%), consumer staples (15.38%), financials (14.93%) and utilities (13.08%). Other sectors are below 8% individually and 19% in aggregate. Compared to the S&P 500, DURA significantly overweights healthcare, consumer staples, and utilities. It underweights mostly technology, consumer discretionary, communication and materials. Real estate is ignored by index constitution.
Sector breakdown (chart: author; data: VanEck, SSGA)
The portfolio is quite concentrated: the top 10 holdings, listed below with fundamental ratios, represent 44% of asset value. The heaviest one weighs 5.25%, so risks related to individual companies are moderate.
| Ticker |
| Name |
| Weight |
| EPS growth %ttm |
| P/E ttm |
| P/E fwd |
| Yield% |
| Johnson & Johnson |
| 5.25% |
| -35.60 |
| 34.09 |
| 15.32 |
| 3.49 |
| Verizon Communications, Inc. |
| 5.01% |
| -0.20 |
| 7.56 |
| 8.27 |
| 16.23 |
| JPMorgan Chase & Co. |
| 4.91% |
| 0.60 |
| 10.11 |
| 9.69 |
| N/A |
| Philip Morris International, Inc. |
| 4.55% |
| -3.12 |
| 17.66 |
| 15.86 |
| 1.76 |
| Pfizer Inc. |
| 4.53% |
| 42.09 |
| 7.08 |
| 11.44 |
| N/A |
| Broadcom Inc. |
| 4.41% |
| 67.70 |
| 21.02 |
| 14.91 |
| 0.77 |
| Altria Group, Inc. |
| 4.39% |
| 89.70 |
| 15.15 |
| 9.35 |
| 1.69 |
| Cisco Systems, Inc. |
| 3.91% |
| -2.22 |
| 17.04 |
| 12.40 |
| 1.40 |
| International Business Machines Corp. |
| 3.90% |
| -67.77 |
| 64.68 |
| 13.46 |
| 2.37 |
| Bank of America Corp. |
| 3.53% |
| -5.37 |
| 8.70 |
| 8.48 |
| N/A |
Ratios from Portfolio123.
Performance
Since inception in October 2018, DURA has underperformed the SPDR® S&P 500 ETF Trust (SPY) by 3.5% in annualized return. Volatility is a bit lower than the benchmark, but the maximum drawdown is similar, as reported in the next table. Anyway, price history is too short to assess the strategy.
| Total Return |
| Annual.Return |
| Drawdown |
| Sharpe ratio |
| Volatility |
| DURA |
| 36.79% |
| 7.26% |
| -33.12% |
| 0.42 |
| 16.63% |
| SPY |
| 58.39% |
| 10.83% |
| -33.72% |
| 0.59 |
| 19.54% |
Data calculated with Portfolio123.
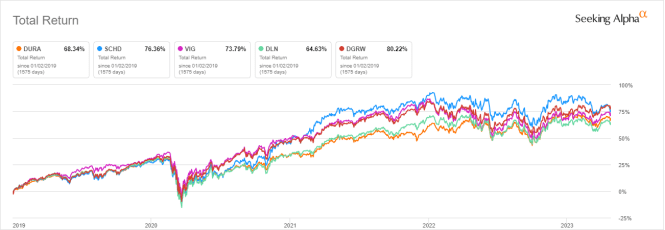
The next chart compares total returns since 1/1/2019 for DURA and 4 other ETFs oriented to dividends with quality criteria:
- Schwab U.S. Dividend Equity ETF ( SCHD )
- Vanguard Dividend Appreciation Index Fund ( VIG )
- WisdomTree U.S. LargeCap Dividend Fund ( DLN ), reviewed here
- WisdomTree U.S. Quality Dividend Growth Fund ( DGRW ), reviewed here .
DURA beats DLN and lags the 3 other funds. Though, differences are moderate and performance is consistent with competitors. Once again, this period is too short to make a statement.
DURA vs. Competitors, total return since 1/1/2019 (Seeking Alpha)
In previous articles, I have shown how three factors may help cut the risk in a dividend portfolio: Return on Assets , Piotroski F-score , and Altman Z-score .
The next table compares DURA with a subset of the S&P 500: stocks with an above-average dividend yield, an above-average ROA, a good Altman Z-score, a good Piotroski F-score and a sustainable payout ratio. The subset is rebalanced annually to make it comparable with a passive index.
| Total Return |
| Annual.Return |
| Drawdown |
| Sharpe ratio |
| Volatility |
| DURA |
| 36.79% |
| 7.26% |
| -33.12% |
| 0.42 |
| 16.63% |
| Dividend quality subset |
| 60.31% |
| 11.13% |
| -36.77% |
| 0.62 |
| 19.65% |
P ast performance is not a guarantee of future returns. Data Source: Portfolio123.
DURA underperforms this dividend quality subset and shows a higher risk in drawdown and volatility. However, ETF performance is real and the subset is simulated. My core portfolio holds 14 stocks selected in this subset (more info at the end of this post).
The sum of annual distributions went from $0.92 per share in 2019 to $0.96 in 2022. It is an increase of 4.3%, whereas the cumulative inflation in the same time has been about 15%, based on CPI. The annualized dividend growth rate of 1.43% is underwhelming.
DURA distributions since 2019 (Seeking Alpha)
Scanning DURA portfolio
The fund is materially cheaper than the S&P 500 index regarding the usual valuation ratios, as reported in the next table (except for price/sales).
| DURA |
| SPY |
| Price/Earnings TTM |
| 16.42 |
| 20.62 |
| Price/Book |
| 2.66 |
| 3.78 |
| Price/Sales |
| 2.76 |
| 2.39 |
| Price/Cash Flow |
| 11.98 |
| 15.41 |
D ata: Fidelity.
I have scanned holdings with the quality metrics described in the previous paragraph. I consider that risky stocks are companies with at least 2 red flags among: bad Piotroski score, negative ROA, unsustainable payout ratio, bad or dubious Altman Z-score, excluding financials and real estate where these metrics are unreliable. With these assumptions, risky stocks weigh about 5% of asset value, which is a good point.
Based on my calculation, the aggregate return on assets and Piotroski F-score are close to SPY's values. These metrics point to a portfolio quality similar to the S&P 500.
| DURA |
| SPY |
| Altman Z-score |
| 2.74 |
| 3.41 |
| Piotroski F-score |
| 5.55 |
| 5.61 |
| ROA % TTM |
| 8.01 |
| 7.53 |
Takeaway
VanEck Durable High Dividend ETF tracks an index of large cap U.S. dividend stocks, screened with some quality criteria and weighted on total dividends paid. Healthcare and technology are the heaviest sectors in the portfolio. The VanEck Durable High Dividend ETF is better balanced across its top sectors than the S&P 500 index, but it is quite concentrated in its top holdings. It looks better than the S&P 500 in valuation, and similar in quality. It has underperformed the large cap benchmark in total return since inception, but price history is too short to assess the strategy. Performance since 2019 is consistent with the competition.
For further details see:
DURA: An ETF Seeking Dividends With Quality