BROS - Dutch Bros Stock Is A Buy (Technical Analysis)
2024-01-02 10:30:17 ET
Summary
- Dutch Bros is a popular coffee chain with a strong customer base and consistent long drive-thru lines.
- Technical analysis suggests that now is a good time to buy BROS stock, as it has rallied off its lows and is trading above the 30-week moving average.
- Bullish indicators include positive volume trends, strong momentum, and outperformance compared to the S&P 500 index.
Dutch Bros ( BROS ) first caught my attention several months ago as there are several in my local area. What drew my interest to the company was that the line at the drive-thru was always long no matter when I went by the store. While I’ve never been a customer of the company, it seemed to me that they had many happy customers. I thought that this could be the type of company that the legendary investor William O’Neil would be interested in owning. In this article, I will outline why I think that now is a good time to start a position in BROS. I will be using technical analysis to show why I think BROS is a buy at current levels. Let’s look at some charts.
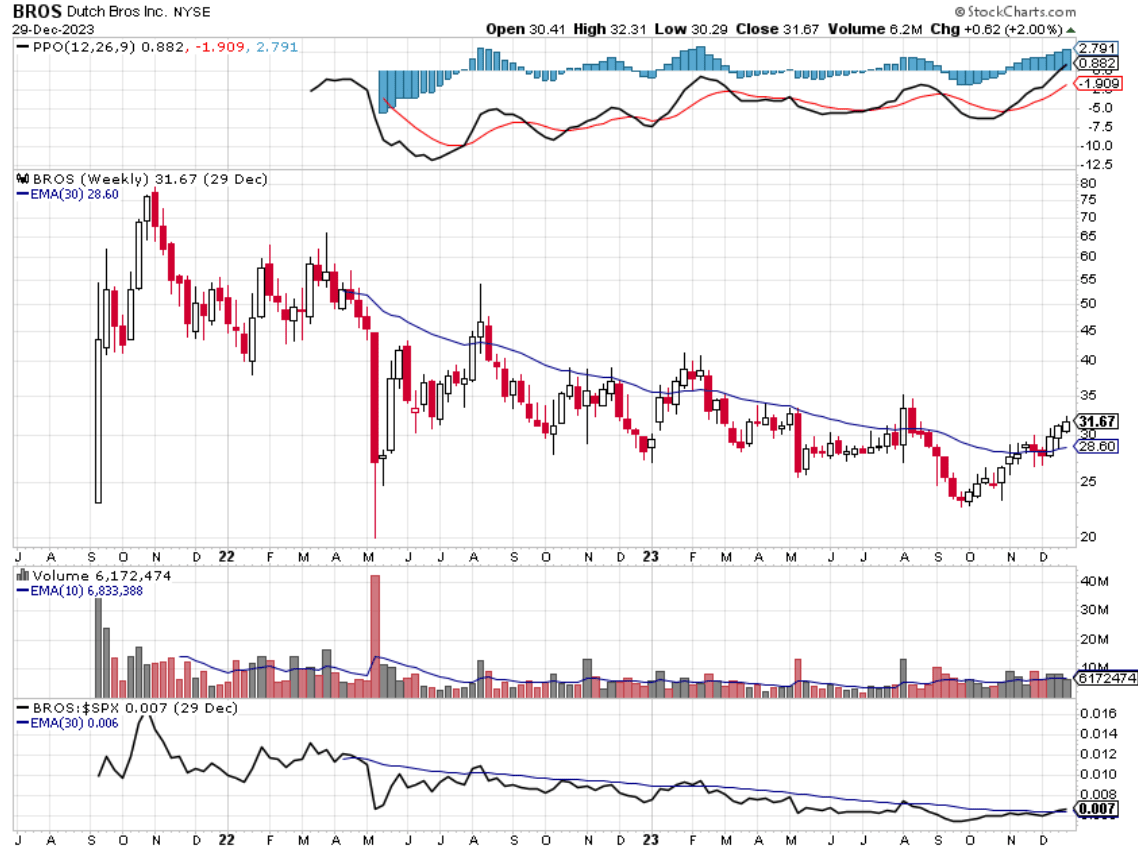
Chart 1 – BROS Weekly Price Chart with 30 Week Moving Average, PPO, Volume, and Relative Strength
Chart 1 shows that BROS went public in September 2021 and in short order BROS went from $23 to just over $81 in a span of seven weeks. Since then, BROS has been in a downtrend. BROS sold off and reached a low in May 2022 of just over $20. It then rallied back to a high of $54 in August 2022, but then again BROS sold off. I recall that O’Neil didn’t like to invest in new companies until several years after they went public because they often sold off after the initial hype of the company. Perhaps that’s what happened to BROS. However, after the low made in September 2023 at $22.66 things began to improve. Since September 2023, BROS has rallied and is now above the 30-week exponential moving average ((EMA)) shown in blue. Also, BROS has closed above the 30-week EMA, five of the last six weeks. That type of consistency hasn’t been seen on the chart before. This to me is a bullish indication. Another bullish indication in the price pane of Chart 1 is that the 30-week EMA is now sloping higher. I want to own stocks that trade above an upward sloping 30-week EMA.
The volume pane is bullish. Since the September 2023 lows, BROS has rallied, and volume has been bullish. Advancing weeks have often occurred with weekly volume being greater than the 10-week volume EMA shown in blue. This bullish volume profile shows that institutional investors are buying the stock. I believe they buy because they think that the company is undervalued in one or more ways at the current price level.
Momentum in BROS is bullish. Looking at the top pane of Chart 1 you can see the Percentage Price Oscillator ((PPO)). This is a common indicator used to show price momentum. Bullish PPO can be seen two ways. When the black line is above the red line that shows bullish momentum. When the black line is above the centerline or zero-line of the chart that also shows bullish momentum. The black line is above the centerline or zero-line for the first time ever on this chart. The most bullish condition is when the black line is above the red line and the black line is also above the centerline of the chart. That is the condition BROS is in now. Momentum is bullish and I prefer to own stocks that are in the most bullish condition regarding momentum.
Another criterion that I use to decide if I want to own the stock is its relative strength to the SP 500 index. As I often say , beating the SP 500 index is difficult. One way to beat the index is to invest in stocks that are outperforming the SP 500 index. The ratio shown in the bottom pane of Chart 1 shows BROS to the SP 500 index along with the 30-week EMA in blue. When the ratio is rising, that means that BROS is outperforming the major index. When the ratio is falling that means that BROS is underperforming the major index. Now the ratio has crossed above the 30-week EMA which is bullish. The ratio has risen from its lows in September 2023 which coincides with its price low and recent rally. The performance of the BROS: ratio has me wanting to own BROS.
While I think that BROS is a stock going higher, I could be wrong. If BROS closes below its 30-week EMA I would be inclined to sell my position or at least substantially reduce the number of shares I own. I would like to keep my losses to no more than 2% of my account equity. That allows me to stay in the game and have money for the next opportunity. I mentioned William O’Neil earlier and he thought the same way. He suggested cutting your position if the stock fell 8-10% below your buy price. Being wrong buying a stock is not a problem. Staying wrong is a problem.
In summary, BROS is a stock that caught my attention due to the number of stores in my local area and the fact that they always seem to be busy. That made me research the stock chart on my favorite timeframe which is the intermediate timeframe. The price action looks bullish as price has rallied off its September 2023 lows and has recaptured its 30-week EMA. The 30-week EMA is also rising which I see as bullish. Volume is bullish and shows that institutional investors have been buying the stock. Momentum is on the side of BROS. The PPO indicator is showing the most bullish condition which supports higher prices. Lastly, BROS is now outperforming the SP 500 index. Owning stocks that are outperforming the major index is the way to outperform the SP 500 index over time.
For further details see:
Dutch Bros Stock Is A Buy (Technical Analysis)