VEA - DXJ: Forward Indicator Is Showing Signs Of Weakness
2023-11-15 22:33:56 ET
Summary
- WisdomTree Japan Hedged Equity Fund ETF has outperformed the S&P 500 this year, delivering a return of about 42% year-to-date.
- DXJ's valuation is still attractive despite strong gains, as Japan's stock market appears to be cheap compared to other developed markets.
- Japan's composite PMI is showing signs of weakness and investors should not neglect this risk.
Introduction
Japan's economy has struggled for several decades since the burst of its equity and real estate bubble in 1989. However, the economy appears to be in a much better shape now and the economic growth momentum is building up lately. Will this trend continue? In this article, we will look at WisdomTree Japan Hedged Equity Fund ETF ( DXJ ) and provide our analysis and recommendations.
Investment Thesis
DXJ invests in about 450 Japanese large-cap value stocks. Despite its strong performance in 2023, its valuation still appears to be quite attractive. In addition, we anticipate money will continue to flow out of China and invest in Japanese stocks due to China's uncertain economic conditions and tensions between the U.S. and China. However, there are signs of weakness in Japan's composite PMI. To mitigate this risk, we think a pullback will provide a better investment opportunity.
YCharts
Fund Analysis
DXJ has outperformed the S&P 500 this year
Let us begin by reviewing how DXJ performed in the past few years. Unlike most equity funds that suffered a dramatic decline in 2022, DXJ's fund price has been quite stable. In fact, DXJ still delivered a positive return of 2.8% in 2022. This was much better than the S&P 500's loss of about 19.5% in 2022. In 2023, DXJ has again outperformed the S&P 500 index, posting a return of about 42% year-to-date. In contrast, the S&P 500 index only delivered a return of 17.3%. Other developed market funds such as Vanguard FTSE Developed Markets ETF ( VEA ) only delivered a return of about 7.4%, much inferior to DXJ.
YCharts
Valuation is still attractive despite strong gains
Despite a strong performance in 2023, is DXJ still undervalued? Here, we will analyze this by using Warren Buffett's Indicator.
What exactly is the Warren Buffett's Indicator? According to Warren Buffett, we can quickly evaluate whether the broader stock market is overvalued or not by looking at the total market capitalization to GDP ratio of a country's stock market. Due to central banks expanding their balance sheets significantly over the past decade, we think this ratio should be revised to include the total assets of the central banks. Therefore, the equation needs to be revised to be:
total market capitalization / (GDP + assets)
According to Buffett, if this ratio is below 75%, the market valuation is cheap. If it is within the range of 75% to 90%, the market's valuation is fair. If this ratio is above 90%, the market's valuation is overvalued. If it is above 120%, the market is very expensive.
Below is a table that shows this revised Warren Buffett indicator in 10 major developed markets. As can be seen from the table, Japan's total market capitalization (GDP + total asset) ratio is 64.03%. This ratio is below the fairly valued range of 75%~90%. Therefore, Japanese stocks are still attractive even after the impressive performance in 2023. When compared with other developed markets, its stock market is only higher than Germany's 33.09% and Italy's 22.43%. United States, Canada, and Switzerland even have ratios above 100%. This suggests that Japan's stock market appears to be cheap. Since DXJ includes 450 large-cap Japanese stocks, we believe it is a good representation of the broader Japanese stock market. Hence, we think DXJ is undervalued.
| GDP ($ Trillion) |
| Buffett Indicator: TMC/(GDP + TA) Ratio |
| USA |
| 27.6 |
| 124.4% |
| Germany |
| 4.21 |
| 33.09% |
| Japan |
| 3.71 |
| 64.03% |
| UK |
| 3.10 |
| 75.44% |
| France |
| 2.88 |
| 73.3% |
| Canada |
| 2.03 |
| 125% |
| Italy |
| 2.08 |
| 22.43% |
| Australia |
| 1.59 |
| 81.51% |
| Netherlands |
| 1.03 |
| 88.81% |
| Switzerland |
| 0.87 |
| 110.7% |
Source: GuruFocus.com
Money will likely continue to flow from China to Japan
According to a Goldman Sachs Group report, which cited data for the first half of 2023, foreign buying of Japanese equities has exceeded that of Chinese peers for the first time since 2017. The reason behind this is that many fund managers are selling Chinese stocks and turning to Japanese stocks. There are several reasons why these managers are shifting their focus to Japan. First, geopolitical tensions and Chinese government's unpredictable economic policies make it difficult to invest. Second, China's economy appears to face some structural issues such as extremely high household debts and this will limit its GDP growth. In contrast, Japan is in much better shape with reasonable corporate and household debts. Looking forward, it will take many years for China to fix its structural issues. Hence, money will likely continue to flow out of China and many of these capitals will seek investment opportunities in Japan. Therefore, we think DXJ's portfolio of Japanese stocks will benefit from this trend.
Japan's PMI now showing some signs of weakness
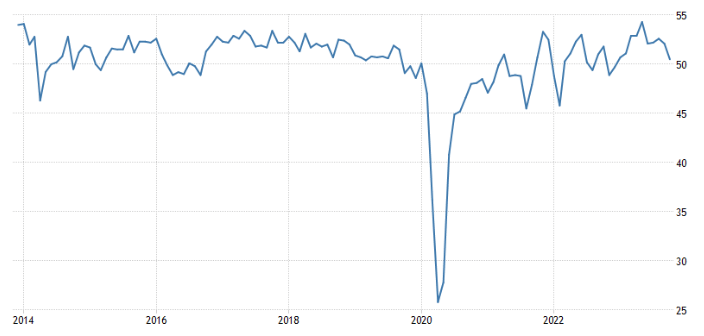
Despite some pros we have discussed, there are also worrisome trends investors need to be aware of. While Japan's composite PMI data, a forward-looking indicator, is still above 50, it appears to be weakening lately. For reader's information, a PMI measure of 50 or above means that the economy is expanding. In contrast, a measure below 50 means that the economy may soon enter a contraction. As can be seen from the chart below, since Japan's composite PMI reached a peak of nearly 55 six months ago, it is on a downward trend. October's composite PMI of 50.5 is significantly lower than September's 52.1. Therefore, we need to watch this trend closely for the PMI figure in November.
Japan's central bank may soon tighten its monetary policy
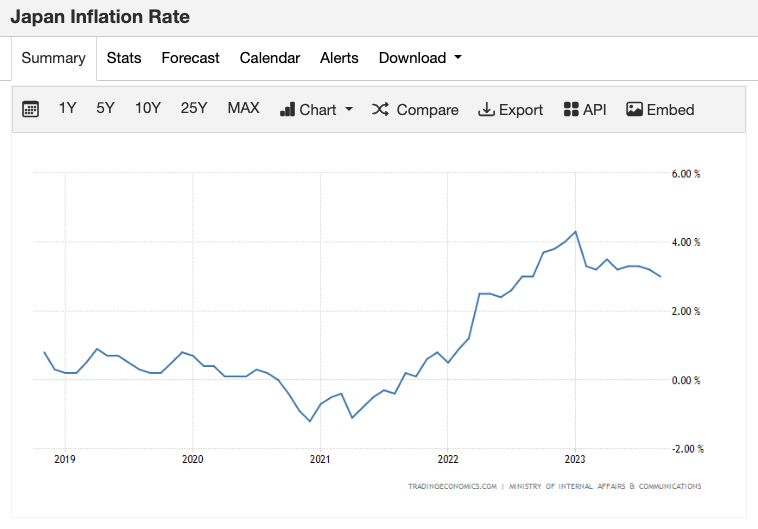
Another area investors need to pay attention to is Japan's monetary policy. Japan is one of the few countries in the world that has not yet raised the rate. This is because the country had very low inflation in the past few decades. However, the country's inflation has been consistently above 2% since early 2022. This means that the country may need to consider ending its ultra-loose monetary policy and begin the path of tightening. Although this is likely not an issue in the near term, investors should keep in mind a shift in policy will cause the equity market to react negatively.
Investor Takeaway
DXJ has an attractive valuation. However, we think investors need to be cautious as the composite PMI is showing signs of weakness. Therefore, we think investors should patiently wait for a pullback to mitigate this risk.
For further details see:
DXJ: Forward Indicator Is Showing Signs Of Weakness