DT - Dynatrace: Growing Competition Hinders Valuation
2023-08-13 10:32:00 ET
Summary
- Dynatrace has experienced a significant increase in profitability, with a net margin of 5.6% in 2023 compared to -27% in FY2019.
- However, despite the company's strong revenue growth, particularly in its subscription segment, growth is starting to be limited by competition.
- We believe the company's upside is limited, given its high valuation compared to peers.
In this analysis of Dynatrace, Inc. ( DT ), we delve into the company's robust profitability, which has exhibited a remarkable upswing from a -27% net margin in FY2019 to an impressive 5.6% in 2023. This transformation is particularly intriguing given its status as a compact, high-growth software firm, boasting a five-year historical average of 24% net margin.
Our analysis encompasses several key facets. We commence by examining the company's revenue growth trajectory across different segments and evaluating its positioning within the competitive APM market landscape. A comparative assessment compared to other major software enterprises aids in gauging the extent of Dynatrace's scale and significance. Furthermore, we analyzed the company's customer base dynamics and patterns of expenditure growth. In a bid to ascertain its competitive edge, we aggregate and evaluate customer ratings and product performance scores, pitting them against those of competitors. This process aids in evaluating whether Dynatrace has significant pricing power and its capacity to grow its margins. Lastly, our analysis extends to the company's operating expenses, employing an in-depth expense analysis to ascertain if its enhanced margins are a result of operational improvements.
Small Software Company with Rapid Growth
| Revenue Breakdown ($ mln) |
| 2018 |
| 2019 |
| 2020 |
| 2021 |
| 2022 |
| 2023 |
| Average |
| Subscription |
| 257.6 |
| 349.8 |
| 487.8 |
| 656.6 |
| 870.4 |
| 1,083 |
| Growth % |
| 36% |
| 39% |
| 35% |
| 33% |
| 24% |
| 33.4% |
| License |
| 98.8 |
| 40.4 |
| 12.7 |
| 1.4 |
| 0.1 |
| 0 |
| Growth % |
| -59% |
| -69% |
| -89% |
| -96% |
| -100% |
| -82.5% |
| Service |
| 41.7 |
| 40.8 |
| 45.3 |
| 46.9 |
| 59.0 |
| 75.2 |
| Growth % |
| -2% |
| 11% |
| 3% |
| 26% |
| 27% |
| 13.1% |
| Total Revenue |
| 398.0 |
| 431.0 |
| 545.8 |
| 705.0 |
| 929.5 |
| 1,158.5 |
| Growth % |
| 8% |
| 27% |
| 29% |
| 32% |
| 25% |
| 24.1% |
Source: Company Data, Khaveen Investments
Dynatrace ’s software focuses on application performance monitoring which...
...is the practice of tracking key software application performance metrics using monitoring software and telemetry data.
Furthermore, APM software is used...
...to ensure system availability, optimize service performance and response times, and improve user experiences.
In other words, APM software enables IT teams to track and manage factors affecting app performance and help prevent customer dissatisfaction, brand and revenue loss and decreased efficiency.
Based on the table, Dynatrace’s total revenue grew strongly at an average of 24.1% over the past 6-year period. The company’s Subscription revenues supported its growth at an average of 33.4% while its License revenues decreased steadily as the company shifted from a perpetual licensing model to a subscription-based one. Moreover, its Service revenues grew at an average of 13.1% but only represented a small portion (6%) of its total revenue.
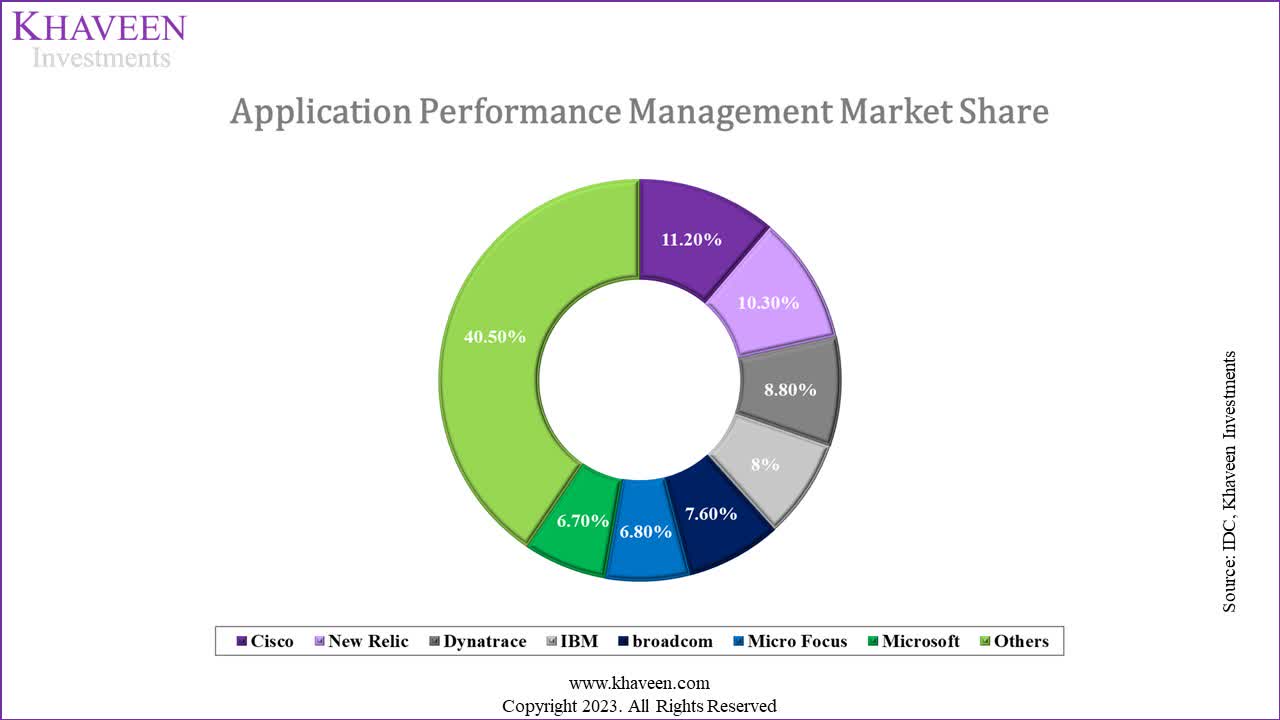
Based on the IDC, Dynatrace had a market share of 8.8% in 2018 in the APM market which placed it in third place and only trailing behind Cisco AppDynamics ( CSCO ) and New Relic ( NEWR ) but ahead of IBM ( IBM ) and Broadcom ( AVGO ). In 2020, New Relic overtook the top spot to become the market leader with a 12.2% market share. Moreover, according to Research and Markets , the APM market was valued at $7.9 bln in 2022 and is forecasted to grow at an 11.5% CAGR. Based on the company’s 2022 revenues, this translates to a share of 11.8%, an increase compared to its share of 8.8% and highlights the company’s strengthened position in the APM market.
Despite the company’s high growth, the company remains relatively small with revenues of only $1.2 bln despite the company being among the top companies in the APM market based on market share. For comparison, when we looked at all the 39 US-listed large cap Software companies ($10 bln in market cap and above), they have an average annualized revenue of $12.02 bln which is more than 10x larger than Dynatrace’s revenue. Thus, we believe that the company has not reached the size to produce economies of scale.
Company Data, Khaveen Investments
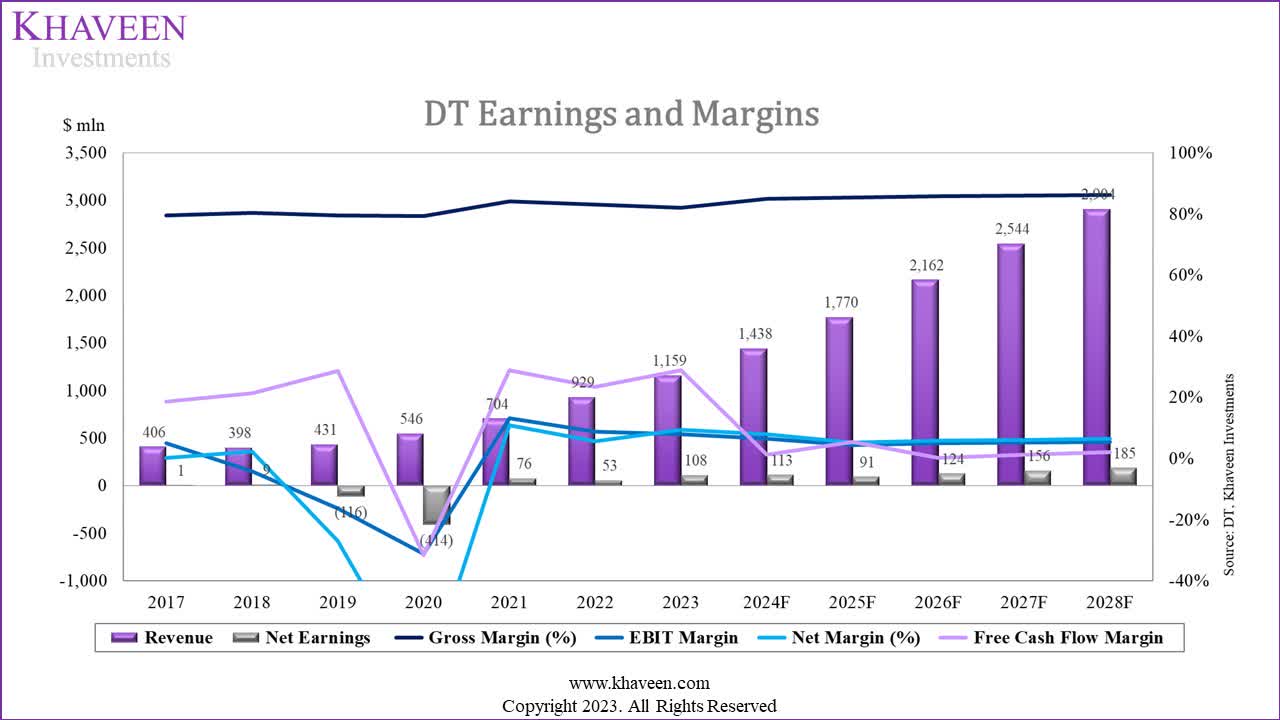
To verify that the company’s profitability was not due to economies of scale, we computed into the chart the company’s profit margins over the past 7 years which shows gross margins have been flat with an average of 81% which indicates that its margins growth was not due to economies of scale.
Solid Product Capabilities but Strong Competition
| Dynatrace Revenue Breakdown ($ mln) |
| 2020 |
| 2021 |
| 2022 |
| 2023 |
| Average |
| Number of Customers |
| 2,700 |
| 2,900 |
| 3,300 |
| 3,600 |
| Growth % |
| 7.4% |
| 13.8% |
| 9.1% |
| 10.1% |
| Average Revenue per Customer ( 000s) |
| 202.1 |
| 243.1 |
| 281.7 |
| 321.8 |
| Growth % |
| 20.3% |
| 15.9% |
| 14.3% |
| 16.8% |
| Total Revenue |
| 545.8 |
| 705.0 |
| 929.5 |
| 1,159 |
| Growth % |
| 27% |
| 29% |
| 32% |
| 25% |
| 28.6% |
Source: Company Data, Khaveen Investments
In the past four years, Dynatrace had notable growth in both its customer base and revenue per customer, contributing to overall growth in its total revenue. Its customer growth had an average of 10.1% whereas average revenue per customer had stronger growth at an average of 16.8% in the period. Overall, Dynatrace had an average annual revenue growth rate of 28.6% and its growth was contributed by both customer and revenue per customer growth. Notwithstanding, its revenue per customer growth had been slowing each year in the past 3 years but was still higher than customer growth.
Furthermore, we compared the company against its competitors in terms of average customer and product capability ratings from Gartner.
| Company |
| Customer Ratings |
| Gartner Product Capability Ratings |
| Number of Reviews |
| Dynatrace |
| 4.5 |
| 4.5 |
| 1,458 |
| Cisco AppDynamics |
| 4.5 |
| 4.5 |
| 911 |
| Moogsoft |
| 4.2 |
| 4.3 |
| 9 |
| Splunk ( SPLK ) |
| 4.3 |
| 4.6 |
| 1,372 |
| Micro Focus |
| 4.1 |
| 4.3 |
| 12 |
| BMC |
| 4.3 |
| 4.2 |
| 14 |
| Sciencelogic |
| 4.6 |
| 4.5 |
| 29 |
| New Relic |
| 4.5 |
| 4.6 |
| 1,333 |
| OpsRamp |
| 4 |
| 4.4 |
| 30 |
| Digital.ai |
| 4.5 |
| 4.4 |
| 65 |
| SolarWinds |
| 4.3 |
| 4.4 |
| 230 |
| Zenoss |
| 4.4 |
| 4.4 |
| 18 |
| Digitate |
| 4.3 |
| 4.6 |
| 17 |
| Average |
| 4.35 |
| 4.44 |
| 5,498 |
Source: Gartner , Khaveen Investment
Based on the table above, in terms of customer ratings based on a 75 th percentile, the top 3 companies are Sciencelogic in first place with 4.6/5 but only has 29 reviews, this is followed by a four-way tie between Dynatrace, Cisco, New Relic and Digital.ai. However, when referring to the number of reviews, Dynatrace has the highest number of reviews at 1,458, thus indicating higher reliability of its customer rating.
Moreover, in terms of product capability ratings, Splunk and New Relic both are tied at first having the highest score of 4.6/5 with the second and third highest number of reviews respectively. Although Digitate also has a rating of 4.6, we excluded it as it only has 17 reviews. This is followed by Dynatrace with 4.5 for product capabilities and is tied with Cisco AppDynamics but Dynatrace has a higher number of reviews.
Overall, although we believe Dynatrace has the highest customer satisfaction with the highest rating and number of reviews, we believe it is edged out by Splunk and New Relic in terms of product capabilities.
Furthermore, Dynatrace operates as part of the broader ITOM market which has 3 categories which include IT Delivery Automation, IT Experience Management and APM. As highlighted above, APM involves monitoring, analyzing and enhancing the efficiency of software applications. Dynatrace products are specialized towards APM and support more than 650 technologies based on its website including Adobe ( ADBE ), Salesforce ( CRM ) and SAP ( SAP ) as well as cloud platforms such as Azure ( MSFT ), AWS ( AMZN ) and Google Cloud ( GOOG ).
AIOps technology involves the use of machine learning and is applied by companies for their IT operations which refers to an organization's IT infrastructure, systems, applications and services. Companies use AIOps solutions to assist in identifying and resolving IT issues. The IT systems in companies “produce immense volumes of log and performance data that can impede an IT team's ability to identify and resolve incidents” according to TechTarget. AIOps platforms gather diverse data from sources like logs, and network traffic. Application logs track events and errors which helps troubleshoot. Using Machine Learning algorithms, it analyzes data for anomalies, patterns, and predictions, distinguishing genuine issues from noise. AIOps conducts root cause analysis to pinpoint problem origins, enabling proactive prevention. Through efficient collaboration, AIOps inform relevant teams and automate issue resolution. However, AIOps complements and aids IT teams in saving time from manual processes and analyses massive datasets rather than replacing them as AIOps tools have limitations such as false positives or are unable to solve issues/ anomalous events outside its scope.
In the context of APM where Dynatrace operates, AIOps enables companies to manage their IT systems such as the use of various integrated software applications for the operations of the business in various departments. For example, the customer service team uses different CRM software from supply chain management departments using ERP software but is integrated with the company’s system to facilitate the customer order flow. AIOps’s application includes issue detection by analyzing data from integrated software such as anomalous errors rates, conducting root cause analysis to troubleshoot the cause of the issue, for example, a surge in server load and generating automated responses such as scaling up server resources or suggestions for the IT team to solve the underlying issue.
For Dynatrace, the company features its proprietary Davis AI engine as described below and had expanded its causal AI for security use cases and enhanced its predictive AI as stated in its latest earnings briefing. Furthermore, the company highlighted its new generative AI capabilities through Davis Copilot .
Dynatrace customers have used Davis AI for years to tie server side observability with user impact, deterministically reduce hundreds of alerts to single problems, and automate the root cause analysis process in large scale and complex cloud native environments. - Rick McConnell, CEO
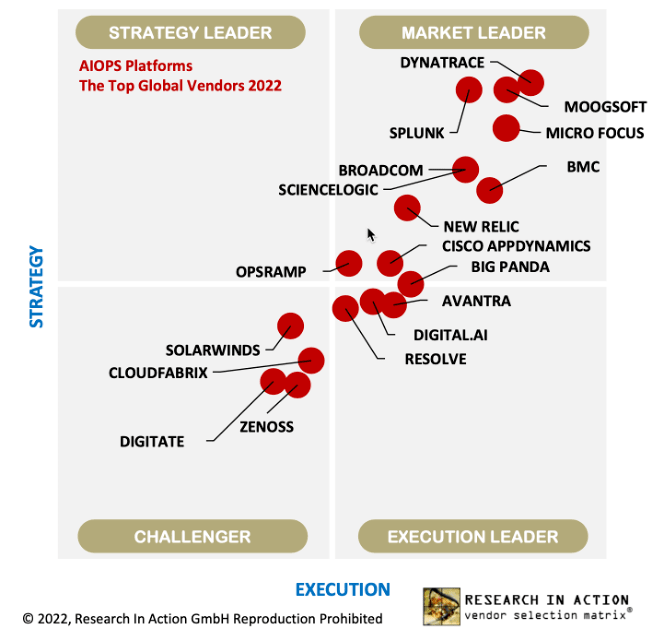
Reflecting the company’s strong AIOps capabilities, Dynatrace had been ranked as the top leader based on Research in Action for AIOps in IT operations. Additionally, Gartner and Forrester Wave also ranked Dynatrace as the top company in AIOps for IT operations. According to BCC Research, AIOps was valued at $3 bln in 2021 and is projected to grow at a CAGR of 26.1%.
However, in 2022, Microsoft introduced its AiDice solution which is its AIOps and is in-built for the Azure platform. Microsoft’s AIOps solution focuses on infusing AI into cloud computing systems to improve its availability, reliability, performance, efficiency and security. In 2023, Microsoft introduced Application Insights which provides APM capabilities in addition to its existing Azure Monitor which is a monitoring tool for Azure users. Therefore, we believe this could be a threat to APM companies as Microsoft could be expanding more aggressively in this area. Existing APM companies such as Dynatrace and Moogsoft have their AIOps solutions integrated with cloud platforms such as Azure which could pose a threat if Microsoft’s in-built AIOps solutions are further developed.
All in all, we determined that the company has high customer ratings against competitors as well as strong product capabilities in APM and AIOps which the company had been focusing on expanding on. However, we believe that the company could face competitive threats from existing players such as Splunk and New Relic in terms of product capabilities with higher scores as well as competition from larger software companies expanding their APM capabilities like Microsoft. As such, we believe that while the company managed to grow its spending per customer impressively, its slowing growth could indicate it does not benefit from significant pricing power or the ability to upsell amid tough competition.
Margins Improved as SG&A Expenses Normalized
Furthermore, we analyzed the company’s expense analysis in the chart below to determine whether the company’s profitability had improved due to lower operating expenses % of revenue.
Company Data, Khaveen Investments
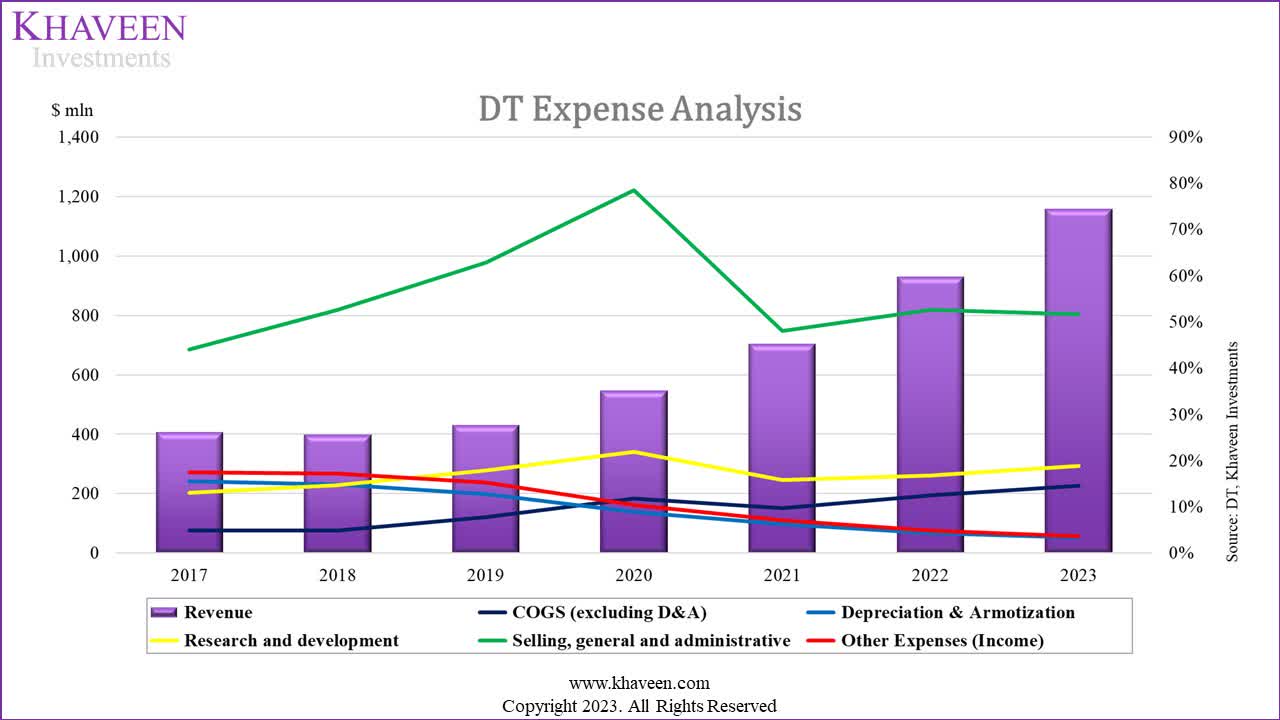
Based on the chart above, the company’s largest expense is SG&A which accounted for 51.6% of revenue in 2023. The company’s SG&A expenses had increased from FY2017 and peaked in FY2020. Following that, its SG&A expenses decreased to 48% of revenue in FY2021 from 78% in the prior year.
According to the company’s annual report, this is as the...
...decrease was primarily due to lower share-based compensation of $60.5 million and lower travel expenses of $11.1 million, partially offset by a 25% increase in headcount.
Additionally, its General and Administrative expenses were lower
...primarily due to a decrease in share-based compensation of $65.8 million and lower transaction costs of $18.3 million primarily related to the initial public offering completed in fiscal 2020.
| Stock-based compensation ($ ‘000s) |
| 2018 |
| 2019 |
| 2020 |
| 2021 |
| 2022 |
| 2023 |
| Average |
| Sales and marketing |
| 7,536 |
| 24,673 |
| 84,698 |
| 24,153 |
| 35,957 |
| 51,147 |
| General and administrative |
| 9,180 |
| 28,135 |
| 80,425 |
| 14,640 |
| 29,400 |
| 35,938 |
| Total SBC Related to SG&A |
| 16,716 |
| 52,808 |
| 165,123 |
| 38,793 |
| 65,357 |
| 87,085 |
| SG&A Expense |
| 209,300 |
| 270,700 |
| 428,200 |
| 337,700 |
| 488,700 |
| 598,000 |
| SBC % of Total SG&A |
| 8.0% |
| 19.5% |
| 38.6% |
| 11.5% |
| 13.4% |
| 14.6% |
| 17.6% |
Source: Company Data, Khaveen Investments
Based on its annual report, we compiled its stock-based compensation for SG&A from 2018 to 2023. As seen, stock-based compensation peaked in 2018. By calculating the SBC as a percentage of SG&A, in 2018, SBC accounted for 8.0% of SG&A and surged to 38.6% during 2020 but has moderated reaching 14.6% in 2023 with an average of 17.6%.
Therefore, the company’s decrease in SG&A in FY2021 had been attributed to lower stock-based compensation which decreased by 74%. This is because the company had an IPO in Aug 2019 which is its FY2020. In FY2022 and FY2023, the company’s SG&A expense % of revenue had not increased to the level seen in FY2020. Thus, we believe the company’s surge in SG&A expense in FY2020 was a one-off event due to its IPO. However, following the IPO, the average SBC compensation % of SG&A of the company reached 14.6% in 2023 and is below its average of 17.6%. Following its IPO, we expect its SG&A expenses as % of revenue to remain stable as it had only increased slightly following its IPO and not increased to the levels prior to 2020.
Furthermore, the company’s other expenses had decreased over the past 7 years which contributed to an improvement in its net margins by 13%. However, we expect the decreasing other expenses not to continue supporting its margin improvement as it now represents a small portion of revenue at 4% of revenue and instead maintain its stable net margins at a 3-year average of 8.6%.
Risk: Slower Growth
We believe one of the main risks to the company’s outlook is the competition from larger software players including Cisco which we highlighted had slightly higher product capability ratings from Gartner as well as Microsoft with its recent expansion in APM and AIOps across the cloud. We believed intensifying competition could pose a threat to its long-term outlook. Based on its latest earnings briefing, management guided an increase to its full-year revenue growth at 21% compared to 20% previously but is still lower compared to its past 4-year average of 28% amid cautious enterprise spending.
Verdict
To conclude, despite being one of the top companies in the APM market, the company is still relatively small compared to 39 US-listed large-cap software companies with an average annualized revenue of $12.02 bln, over 10 times larger than Dynatrace's revenue. We believe this suggests the company has not reached the size for economies of scale as evidenced by its consistent gross margins. However, we determined that the company has high customer ratings and product capabilities in APM and AIOps which it is continuing to focus on expansion. Yet, we believe competition from rivals like Splunk, New Relic, and larger software firms like Microsoft could pose challenges. While spending per customer increased, we see slowing growth might reflect weak pricing power and fierce competition.
We determined that its profitability margin improvement over the past 4 years is attributed to normalized SG&A spending. The FY2021 decrease was due to a 74% drop in stock-based compensation. Following the company’s IPO, SG&A expenses as % of revenue had normalized and remained stable, and we expect it unlikely to improve further with strong competition. Besides that, other expenses decreased over the past 7 years which led to a 13% net margin improvement. However, we expect the declining trend in other expenses will not sustain continued margin improvement as it now only accounted for 4% of revenues. Furthermore, despite the improved guidance from the company, its 21% growth outlook for 2023 is below its 4-year average and we believe competitive pressures could affect its long-term outlook. With a forward P/S of 9.61x which is significantly higher than the Sector average, we do not believe there is much upside to be obtained.
| Dynatrace P/S (Forward) |
| Sector P/S (Forward) |
| 9.61x |
| 2.72x |
Source: Seeking Alpha
Therefore, we based our price target on the low range of analyst consensus of $52 from TipRanks , with an upside of 8%, thus we rate the company as a Hold.
For further details see:
Dynatrace: Growing Competition Hinders Valuation