KCG - East 72 - Virtu Financial: From Lust To Loathing
2023-10-19 09:05:00 ET
Summary
- Virtu Financial is the sole listed US-based liquidity provider, operating in commodities, options, and forex markets.
- The company has faced regulatory scrutiny and legal claims from the SEC, which has impacted investor sentiment.
- Despite challenges, Virtu has a strong capital management strategy, including dividends and share buybacks, and has the potential for future growth in the market-making industry.
The following segment was excerpted from this fund letter.
Virtu Financial Inc ( VIRT )
In one guise or other, in January 2024, assuming Dynasty Trust is still holding, I will be into my SEVENTH year of having exposure to Virtu Financial Inc., though not necessarily continuously. Given what Virtu does, even allowing for cycles in its earnings, that’s a long time.
Virtu Financial, with an equity market capitalisation at end September 2023 of just overUS$2.8billion 1 and with $1.8billion of long-term debt due in 2029, is the sole listed US based “liquidity provider”. Liquidity providers, or market makers, are a controversial industry of financial market “plumbers” who are receiving extra unwanted and tainted publicity with the release of the movie “Dumb Money” 2 regarding the meme stock explosion of securities like Game Stop and AMC Entertainment in early 2021. The March quarter of that year was Virtu’s second most profitable ever, measured by “daily profit”. The short term “sugar-hit” has provided a longer-term hangover – an SEC enquiry and proposed tighter regulation.
Whilst many of its competitors, by dint of financial regulation have to make public disclosures, VIRT make more than any other in its business. And when your industry is full of mathematical, analytical, programming geniuses, additional disclosure is not what you want. So it is always with trepidation that our desire to invest in a stunningly profitable, hefty return on capital, highish barrier to entry business, is tainted by the fact the investment is in the only US publicly listed business 3 .
VIRT have pulled back on certain elements of disclosure since 2019 & 2020 whilst providing other elements of non-financial papers which assist in providing the ability to judge their performance over the short term; we will discuss these aspects as we delve into how Virtu make their money.
In assessing Virtu’s publicly listed history from April 2015 onwards, despite the business being developed to advantage by asset sales, strong access to debt markets and two notable acquisitions, investor valuation of Virtu’s earnings has declined sharply. The lust of market making profits in 2014-2015 has turned into a loathing due to competition, rapid development of alternative products - such as zero-day options - attracting the retail speculator, and an aggressive regulator diverted by simplistic public opinion and potentially seeking to pull down what to us looks like an extraordinarily efficient market structure.
It has meant that VIRT has had to run hard, despite being in a phenomenally competitive position amidst the democratisation (retail participation) in stock trading, which enabled it to reap outsized benefits in 2021. Innovation moves extraordinarily rapidly in markets: trends in exchange traded products are to Virtu’s advantage. However, they have lagged in the options area, especially single stock options rather than index options. Given several competitors have grown up in the options area (notably Susquehanna) the slower pace of development is mildly concerning.
We put forward the case of why we hold Virtu as a Top 10 position in Dynasty Trust by describing the business, its history and acquisitions, the regulatory threat to Virtu, the ability of the company to earn super-profits for brief periods, its aggressive capital management initiatives, cost disciplines and an assessment of appropriate valuation metrics.
What’s a liquidity provider?
Whilst VIRT operates across commodities, options and fx, the easiest way to explain the business is via US equities, VIRT’s largest individual component of trading income, when last specifically disclosed in 2018. There are 16 US equity “on-exchanges” 4 – the largest obviously being NYSE and NASDAQ – upon which an equity order can be transacted on a broker-to-broker agency basis on behalf of the principal client. There are obvious momentary arbitrage possibilities between markets. Virtu’s role is to act as a liquidity provider to obtain for their clients - who may have an arrangement with Virtu which involves payment for the client’s order flow (PfOF) – a security price inside the NBBO (National Best Bid Offer) price.
Correctly executed, every participant in the transaction should benefit. This is especially the case in less liquid securities where VIRT can make a market but obviously takes on principal holding risk.
The genesis of VIRT and its cohort stems from “Reg NMS” 5 instituted in 2005 by US SEC designed to modernise the structure of US equity markets as they fragmented, via four key pillars:
- Protecting client orders to prevent execution at worse prices than available on the newly created National Best Bid and Offer (NBBO);
- Improved access to national quotations;
- Quotations in increments of $0.01 if the shares trade at over $1.00
- Allowing revenue to accrue to organisations which promote improved market data access
Reg NMS was a genuine response to the increased importance of effective order routing; by liquidity providers and other broker/dealers consolidating the various exchanges, both liquidity (stock available at or near a given price), spread (difference between bid and offer) and latency (speed) aimed at being improved.
The technology required to perform this role is highly significant; VIRT spends ~$38million a year on internally generated “programming” which is amortised over a maximum of three years. We make significant adjustments to Virtu’s stated earnings to fully expense capitalised software expenses, but add back amortisation, including that pertaining to acquired intangibles . We do not adjust for capital expenditure (except in our cash flow projections) which is also hefty being in the high $20millions per annum to run all of the requisite technology. The good news is that the bottom-line differences between stated earnings and our adjustments are not great.
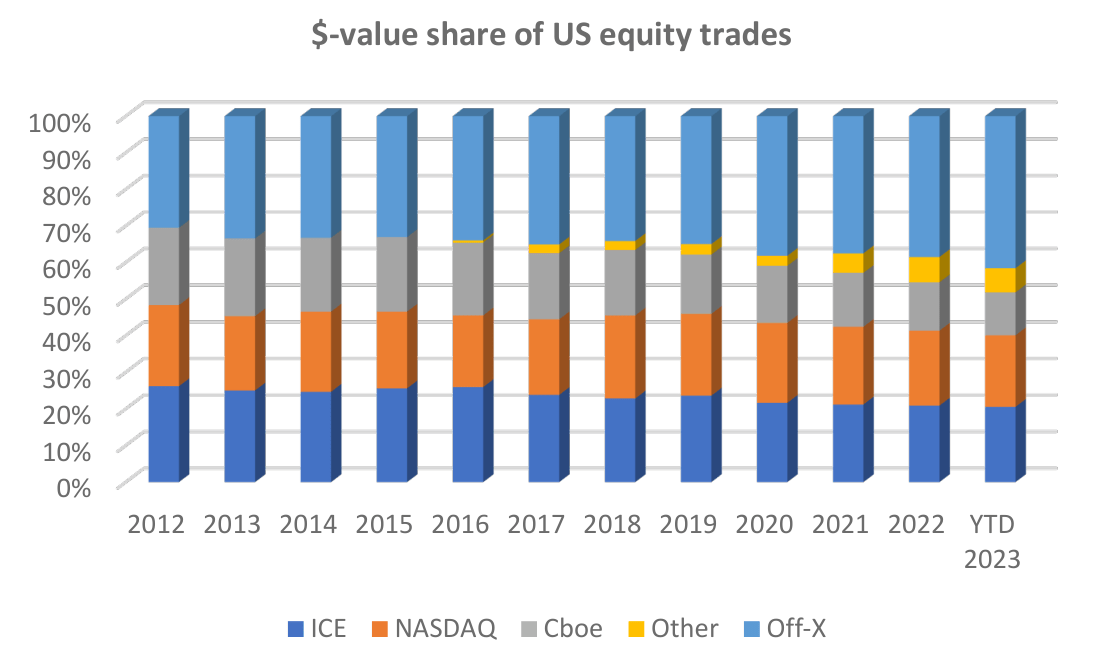
The secular growth story for Virtu in US equities is the manner in which off-exchange trading (matching markets characterised by the moniker “dark pools”) has proliferated over the past few years to now account – in the June quarter 2023 - for over 40% of stock exchange values traded in USA. This is against a backdrop where between 2012 to the first half of 2023, average daily traded value has grown 173% - or 10.5% per annum 6 - though flattened recently.
However, the secular top-line picture is driven by four key influences, outlined in a 2015 presentation 7 around the time of listing, namely:
- Increasing prevalence of electronic trading, especially with growth in exchange traded funds and particularly options;
- A larger number of exchange venues in which to operate across foreign exchange, commodities, crypto-currency, equities and fixed interest;
- Virtu’s own capability to grab higher market shares and “capture” – the latter being a higher return per dollar traded; and
- Volatility; in general, the more volatile the market, the greater the opportunity for profit
Gaining public statistics on the proportion of off-exchange trades by participant is extremely difficult. What we do know is that roughly 75% of off-exchange volume is carried out by non-ATS (non Alternative Trading System 8 ) participants such as single dealer platforms, wholesalers, and broker crossing/capital commitment structures; in other words, Virtu and its direct wholesale competitors such as Citadel, Jane Street and 2-Sigma.
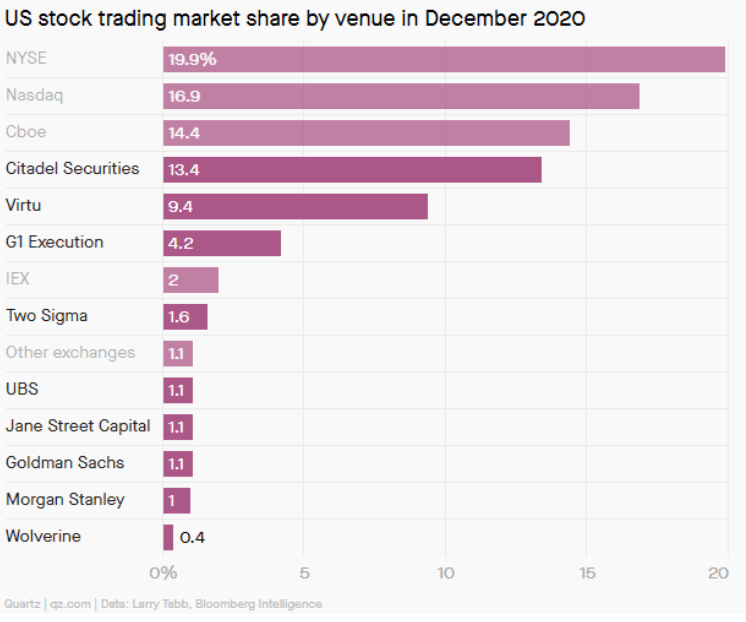
Think it through: if Virtu has a significant market share within the ~40% of equity business carried out off-exchange, and within the 75% of THAT business carried out via non-ATS participants, then a very small number of firms are cutting up some 30% of US equity value traded between them. In an article published in February 2021, “Quartz” assisted by data from Bloomberg, estimated trading by share (volume, not value) to give Virtu over 9% of US equity trades in December 2020, behind that of Citadel which it estimated to be doing nearly as much volume as Cboe:
The non-ATS players like Virtu are especially strong in lower priced securities, holding 93% market share in stocks trading below $1 and over 75% in $1 - $10 priced securities traded off-exchange
– a major benefit when retail investors and speculators are more active.
Virtu’s history
Virtu was founded in 2008 by Vincent Viola and Doug Cifu, the latter still with the firm as CEO. In May 2011, Virtu merged with Madison Tyler Holdings 9 which had been founded in 2002 by Viola and David Salomon 10 . Virtu paid US$536million for the business with Silver Lake committing $250m, Viola $20m and $305million in debt via a new term loan facility. Virtu has never been afraid of leverage, still isn’t and, in our view, has been extremely proficient at using it appropriately in a capital management context.
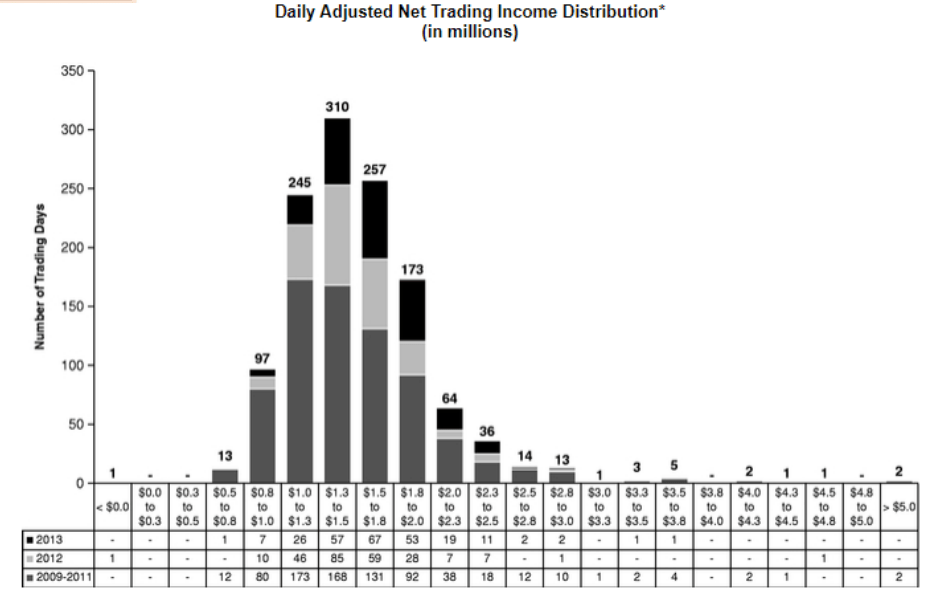
In 2014, Virtu moved to enact an IPO, and submitted an S-1 filing on 10 March 2014 – a document which created no little comment, notably in respect of a famous chart on S1’s page 3 showing that of 1,238 days between 2009-2013, the “firm” (including Madison Tyler) had lost money trading on only one, creating lustful thoughts by other financial market participants.
Source: Virtu Financial S-1 March 2014
The advent of two books – Scott Patterson’s “Dark Pools” in July 2012 but specifically the more widely read and marketed “Flash Boys” by Michael Lewis (March 2014) caused a degree of controversy, leading to the original IPO to be postponed.
The public offering was regenerated in April 2015 with a float at $19/share (pre costs) of just under 14% of the capital, raising $360m. The current slightly complex ownership structure of the business emanates from the IPO. Holders of the publicly traded Virtu Financial Inc (after stock issues and buybacks) now hold around a 58% economic interest in Virtu Financial LLC through 94million single vote Class A shares in the business. Control of the business is held via 60million Class D shares, all of which are held by the Viola interests and represent a 37% economic interest, but over 85% of votes given their 10vote/share attribute. Viola also owns nearly half of the 8.8million single vote Class B shares.
Silver Lake exited at the IPO although certain Silver Lake partners maintained an interest in Virtu, who have also had a long standing relationship with Temasek, the Singapore Government’s overseas investment arm.
The first day’s trading closure at $22.18 rated the 2015 year’s “normalised earnings per share” of $1.35/share 11 at a 16.4x P/E suggesting investors felt the company, at the time, had a competitive advantage within a growing market. This P/E has close to halved.
The shares generally traded in the mid $20s for most of the first year, before commencing a downward trend in the latter part of 2016, reaching a low of ~$13.25 in October 2016. This decline in the share price broadly corresponded with the commencement of a period of extremely low realised volatility in US equity markets (see below), despite the fact that for a few quarters, VIRT’s net trading income as a percentage of net trading capital held up very well.
KCG acquisition
This share price decline presaged a tumultuous calendar 2017 for market makers, with the afore mentioned extraordinarily low volatility measures. As a response to these conditions, in April 2017, VIRT acquired the publicly listed Knight Capital Group ( KCG ) for ~$1.4billion, funded by a new debt issue and $750m (48million share) stock placement at $15.60 a share (gross) to Temasek ($125m), North Island Holdings (the vehicle of certain ex-Silver Lake partners) GIC (Singapore) and PSP Investments (public sector pension fund) in Canada.
KCG 12 had been publicly listed since early 1999, with a split adjusted IPO price of $17.50 reaching heights of $60 in early 2000. The company morphed through various different eras of market making, and the growth of hedge funds, with the shares generally being moribund, reflecting the significant decline in profitability of the company from its calendar year 2000 peak pre-tax income of over $400million. Profitability did start to improve in the mid 2000’s until a fateful day on 1 August 2012.
That day, KCG’s automated order routing system experienced a significant failure, effectively stemming from a failed new software deployment; the firm lost $440million in a single day and the shares fell from $10.25 to $2.58 over two days. KCG was rescued by an effective consortium of Jefferies Financial 13 , Blackstone and GETCO five days later with the use of preferred stock.
The aftermath of Virtu’s KCG purchase is a near master-class in cost and capital management within the financial sector. Estimated cost synergies at the time of purchase of $208million were vastly exceeded 14 , with the saving run-rate estimated at annualised $340million by end 2018; moreover, VIRT paid down long term debt, through capital release and the sale of a major subsidiary, Bondpoint.
| US |
| 30 Jun 17 |
| 30 Sep 17 |
| 31 Dec 17 |
| 31 Mar 18 |
| 30 Jun 18 |
| 30 Sep 18 |
| 31 Dec 18 |
| Net trading capital |
| 361 |
| 1,358 |
| 1,313 |
| 1,494 |
| 1,441 |
| 1,308 |
| 1,423 |
| Long term debt |
| 509 |
| 1,667 |
| 1,389 |
| 1,121 |
| 1,047 |
| 931 |
| 907 |
| TOTAL AVAILABLE CAPITAL |
| 870 |
| 3,025 |
| 2,702 |
| 2,615 |
| 2,488 |
| 2,239 |
| 2,330 |
Effectively KCG provided a significant adjacent addition to Virtu’s existing market making skill set into a larger client base and the addition of new algorithmic tools. Hence, there were significant cost synergies and only minor revenue dis-synergies.
Integrated Technology Group ( ITG ) acquisition
The acquisition of KCG made Virtu a slightly greater hostage to market volatility than management felt was desirable; results dipped into losses in Q3 2017 with the cost base still high from the KCG acquisition but also realised volatility (see later) falling below 10% in the quarter. In the subsequent seven quarters from the KCG acquisition, realised volatility in US equities was below 10% in four of those periods.
The sharp dip in Q3 2017 reflects the increased capital arising from the acquisition of KCG; however, there is a clear decline in the returns available on capital from a given level of implied VIX volatility, partly as a result of competitive pressures.
ITG brought a business less reliant on volatility, more on volumes (via commissions); in its own words at the time “ITG is a global financial technology company that …empowers traders to reduce the end-to-end cost of implementing investments via liquidity, execution, analytics and workflow technology solutions.” On VIRT’s analysis at the time, ITG would increase the level of execution services as a percentage of net trading income from ~ 10% at acquisition to around 37% on a pro-forma basis.
This hasn’t actually occurred; in the three full years 2020-2022 since acquisition, execution services net trading income has amounted to $1.38billion – only 24% of the total $5.65billion. For sure, these years includes two outrageous periods of market making profitability (Q1& Q2 2020; Q1 2021) but execution services was still only 28% of revenue in CY2022.
As was the case with KCG, there have been significant personnel and rental cost synergies which were to be gleaned in the first year of the acquisition – some $133million, primarily composed of personnel and occupancy savings, along with data processing and IT savings – 20% of the then cost base. To be fair, measuring the impact was swamped by the events of FY2000, VIRT’s most profitable year ever.
What is the theoretically available market making profit pool to Virtu & its linkage to VIX?
The easiest way to look at Virtu’s market making business is through the mirror of US equities, given that we know it is Virtu’s largest trading arena; however, the same concepts apply across all of its markets in commodities, global equities by individual market and f/x.
In US equities, Virtu market making directly benefits from two factors:
-
- (higher) transaction volumes and values; and
- (wider) bid-offer spreads within the market.
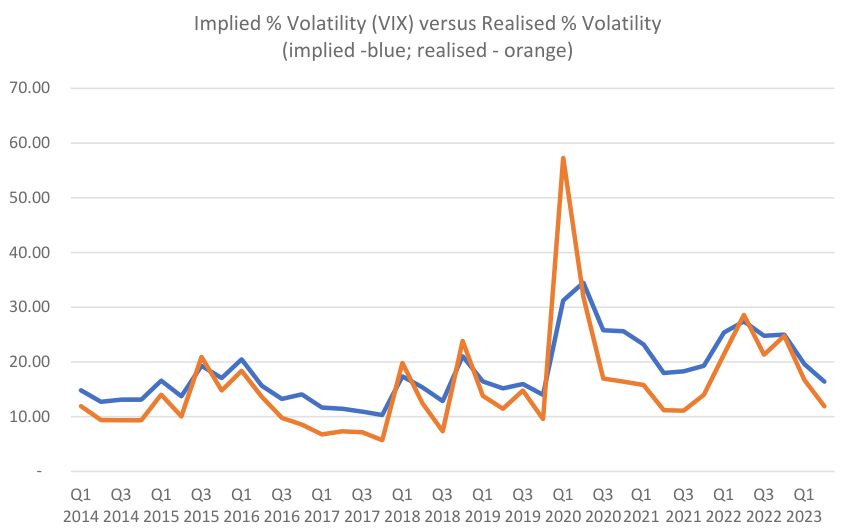
Typically, these attributes occur in more volatile markets, thereby leading to a positive correlation between Virtu profitability and measures of volatility, such as VIX. Unfortunately, this tends to be over-simplistic, given that VIX is a predictive measure, not an actual measure of volatility at a point in time. As the graph below shows, there are significant divergences between implied (predicted) volatility and actual measured volatility; only in the most volatile periods (e.g. Q1 2020) does realised volatility exceed the price you pay to protect against it (VIX/options):
For maximum benefit to Virtu, high volumes and wide spreads need to be present in the “appropriate” stocks; high volumes in tight bid-offer stocks are not as useful as in mid- cap/smaller cap counterparts with wider spread subject to volumes (e.g. Q1 2021).
As a guide to the available market per day, we have taken numbers from Virtu’s own published surveys of bid-offer spreads 15 , averaged the disclosed S&P500 and Russell 2000 spreads and applied that average to the dollar value traded per day 16 . This is extraordinarily rough but acts as a guide.
By way of example, in Q4 2022, average daily volume across all exchanges and off exchange was 11.174billion shares, at an average price of $43.68 for average daily value of $488billion. The median bid offer spread, simply averaging the roughly 5.3bp on S&P500 stocks and 19.9bp on Russell 2000 stocks was 12.6bp. This can be applied to the market value traded to give a potential pool of profit if you captured every single spread on every S&P500 and Russell 2000 stock of about $616million daily .
In that quarter, Virtu’s global market making generated gross profit of $313million or 5million per day (63 days). Clearly, that money was earned globally and in other high volume, high volatility asset classes, notably commodities, so it’s only an equivalent. VIRT noted that they had not fully taken advantage of “opportunities” in that quarter – borne out against prior quarters even on these very rudimentary calculations.
Estimated available spread on US equities (per day figures)
| Volume/day millions |
| Av. price |
| Value/day |
| Av. Spread (bps) |
| Available spread () |
| VIRT NTI/day () |
| EQUIVALENT percentage |
| 3Q2021 |
| 9,763.0 |
| $ 52.42 |
| 511.7 |
| 9.67 |
| 495.0 |
| 6.16 |
| 1.24% |
| 4Q2021 |
| 10,782.1 |
| $ 54.70 |
| 589.8 |
| 11.02 |
| 649.9 |
| 8.02 |
| 1.23% |
| 1Q2022 |
| 12,880.3 |
| $ 55.77 |
| 718.3 |
| 12.78 |
| 918.1 |
| 8.42 |
| 0.92% |
| 2Q2022 |
| 12,584.9 |
| $ 48.63 |
| 612.1 |
| 11.50 |
| 703.8 |
| 6.39 |
| 0.91% |
| 3Q2022 |
| 10,899.2 |
| $ 43.89 |
| 478.4 |
| 10.45 |
| 500.1 |
| 6.21 |
| 1.24% |
| 4Q2022 |
| 11,174.2 |
| $ 43.68 |
| 488.0 |
| 12.62 |
| 615.7 |
| 4.97 |
| 0.81% |
| 1Q2023 |
| 11,784.0 |
| $ 44.31 |
| 522.2 |
| 11.83 |
| 617.9 |
| 6.64 |
| 1.07% |
| 2Q2023 |
| 10,755.5 |
| $ 46.35 |
| 498.5 |
| 11.58 |
| 577.4 |
| 4.94 |
| 0.86% |
Source: SIFMA/Cboe Markets/Virtu Financial compiled by East 72 Management
Our analysis shows that there is not a strong correlation over quarterly periods, even between realised VIX and spreads, most notably in Q2 2022 over recent periods (high VIX, low opportunity). We accept that in periods of extremes, such correlation does hold true but the mechanical following and pricing of VIRT shares based of movements in VIX, is not borne out as a strategy. As a guide, we analyse two periods of extremes below in some detail.
When financial markets go off the rails, Virtu profitability can be extreme.
Extreme volatility: COVID – Q1 2020
Over the course of Q1 2020, Virtu generated $802million of market making revenues, which added to $171million of execution services revenue and $31million of other revenue, yielded the company a $1billion revenue quarter for the first and only time. Deducting clearing fees, interest and dividends expense (on short sales) and the last ever disclosed payment for order flow costs ($62.3million in the quarter), Virtu earned “adjusted net trading income” of $784.5m in the 62 day quarter - $12.65million per day.
This was more than double the daily adjusted net trading income per day since Q2 2018 of $6.184m, when ITG was acquired. In itself, that looks very good, but the three releases made by Virtu regarding the ongoing Q1 2020 results show an astonishing picture of astounding profits to be generated by the business in a conducive environment:
| Released |
| Period covered |
| () ANTI† |
| Trading days |
| ANTI/day |
| 3 March 2020 |
| 2/1/2020 - 28/2/2020 |
| 235 |
| 40 |
| 5.875 |
| 20 March 2020 |
| 2/3/2020 – 19/3/2020 |
| 279 |
| 14 |
| 19.9 |
| 7 May 2020 |
| 20/3/2020 – 31/3/2020 |
| 270 |
| 8 |
| 33.8 |
| 784 |
| 62 |
| 12.65 |
† adjusted net trading income as defined – mid point of disclosed guidance
In the most volatile and rapidly moving part of the quarter – effectively the last week or so of March 2020, Virtu were making ANTI/day of nearly $34million – nearly five and a half times the average under its current (post ITG) structure. That vast increase in “revenue” is piled on to of a largely (not wholly) fixed cost base (see below), immensely leveraging the bottom line; in that quarter, despite a $50million variable increase in employee costs, ANTI was applied onto a cash cost base – excluding depreciation, amortisation and debt interest - of only $261million. This racked up cash profits before interest of $523million in only 62 days on an average capital base (debt and equity) of $3.7billion in the period: an effective 118% annualised return.
Meme stocks: “Dumb Money” – Q1 2021
The beginning of 2021 saw a new equity market phenomenon: an explosion in the stock prices of numerous companies with (generally accepted) compromised businesses – either operationally, financially or both – which in many cases had been heavily short sold by professional investors and subjected to immense short squeezes. The poster child of the group
- the electronic games retailer Game Stop ( GME ) – advanced from $2.60 at end October 2020 (adjusted for subsequent 4:1 stock split on 22 July 2022) via $4.70 at year end December 2020 to around $10 in mid-January 2021 to a peak of $120 ($480 on a pre stock split basis) on 28 January 2021.
Prices of GME and other meme stocks were driven by various influences:
-
- Ease of access to trade via apps such as Robinhood;
- Ease of access at all investors levels via ability to purchase fractional shares;
- Outsized short sale positions by selected hedge funds forcing a known scramble to cover amidst margin calls; and
- Use of non-traditional social media channels to keep speculators enthused.
Virtu – whilst paying away over $62million in the quarter to access the order flow of firms whose clients were the retail speculators – was a massive beneficiary due to the sheer volume of shares traded by these firms via Virtu. Consolidated equity volumes in US averaged 14.65billion shares a day – compared to 10.9billion in 2020 and the 10year average of just over 8billion a day; Interactive Brokers, the major firm for retail investors (not Robinhood speculators) saw its retail volume average 5billion shares a day in Q1 2021 – over four times the level in the previous quarter.
Virtu benefitted in two ways – the massive volume of retail clients transacted through its platform but also the extremely wide spreads due to the volatile nature of the securities being transacted. Market wide volatility was actually quite low. Hence, from a business perspective this was a particularly fertile environment for the Virtu business model. VIRT generated net trading income of $11.9million a day, over the quarter, its second highest ever, of which a then record of $2.5billion came from execution services.
Capital management: an intrinsic part of the Virtu story
As we noted at the time of acquisition of Madison Tyler in 2011, Virtu has sought to “juice” the intrinsic returns from its market making (in particular) by applying a level of financial leverage and other capital management techniques – dividends and stock buy-back. Through the business performance of the last few years, the theory is very sound. In our opinion, it has been the execution which has been lacking, especially in retiring equity.
Virtu has been very proficient at re-leveraging the business through new debt issuances at lower interest rates and lighter covenants; that tactic is now more difficult, but the legacy of their activities is strong. Virtu’s main core debt is a $1.8billion facility installed in January 2022 with seven-year maturity – $257million remains subject to floating rates at SOFR +3% but the residual $1,525milllion sits at an average 4.52% via the swap market.
On the equity front, Virtu has run a steady state dividend policy since Q3 2015, paying $0.24 per quarter ($0.96 per annum); since the IPO, Virtu has returned $7.92 per share (42% of the IPO price) in dividends. Given the Viola family ownership and (presumably) their desire for cash flow, the controlling shareholder is receiving just shy of $62million in dividends per annum.
So, if the debt issuances and dividend policy is reasonable, any issues with capital management lay with the share buy-backs by the company. In simple terms, it has been far too aggressive; rather than hoarding cash from the beneficial periods in 2020 and 2021, in the past three years (11 quarters at the time of writing) Virtu has bought back just over 41million shares out of the TOTAL capital of 193.4million at 30 September 2020 or 21.4%.
In theory nothing wrong with that, but the company has expended close to $1.1billion at an average price of $26.33 . Over a 50% premium to the currently prevailing price. This is partly because of a fit of enthusiasm buying back over 9.7million shares in Q1 2022 at an average price of $32.18 - Just too expensive. Overall, since listing VIRT has retired 46million shares out of the float capital of 138.4million. This effectively negates the equity issued to acquire KCG (48million shares). The problem: the buy-back price has been at a 67% premium to the issuance price. Not what you want to see.
Given the current share price just above $17 (see analysis below), we hope the Virtu board has preserved enough cash to retire equity at these far lower prices, as well as the $156million a year dividend commitment 17 .
Looking at the analysis below, so long as conditions improve marginally over the next few months, even back to moderate levels, we believe they have.
Profitability – well below 2020 & 2021 but low ROIC still acceptable
We formulate our profit figures for Virtu differently to the company. Unfortunately, VIRT adds back share-based compensation in its “adjusted normalised” figures , which we do not, and does not take account of money spent on software which they capitalise. However, the company does depreciate equipment, amortises the purchased intangibles and has various other aspects which are “abnormal” in nature. We are keen to get a perspective of cash return on total capital, before interest costs and depreciation.
All up, the GAAP accounts have over $130million per annum in non-cash costs of ALL amortisation and depreciation; this compares to roughly $27million of capital expenditure and $38million costs per annum attributable to capitalised software. So exactly half of the equivalent GAAP charges.
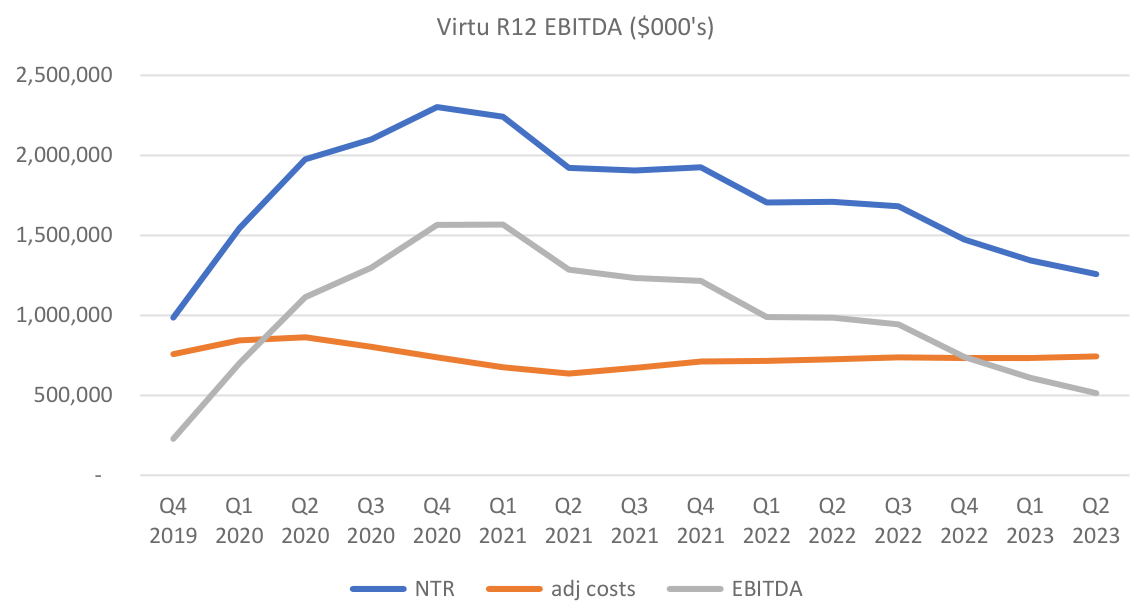
Making all of these adjustments, on a rolling twelve-month basis, which incorporates two very reasonable quarters (Q3 2022 and Q1 2023) with two very modest ones (Q4 2022 and the latest reported Q2 2023), shows Virtu earned “cash profits” before financing costs and tax of $512million – its lowest level since the “no volatility” markets of 2019. This still represents a 13% cash return on total average debt and equity capital of 13% - striking when most of the debt capital is swapped out to be fixed at just above 4.5%.
Even annualising the two worst quarters in the past (reported) twelve-months to June 2023 would see Virtu earning a cash profit (pre interest and tax) of $370million and still able to cover the $0.96/share annual dividend from cash flow.
As the chart below shows, Virtu is a very fixed cost business, with the occasional “spike” in the way of profit share in an exceptional quarter (e.g. Q1 2020). On our numbers, cash operating costs + software have been steady at $715m - $745m since the integration of ITG was completed in 2020 and markets settled after the early 2021 excitement.
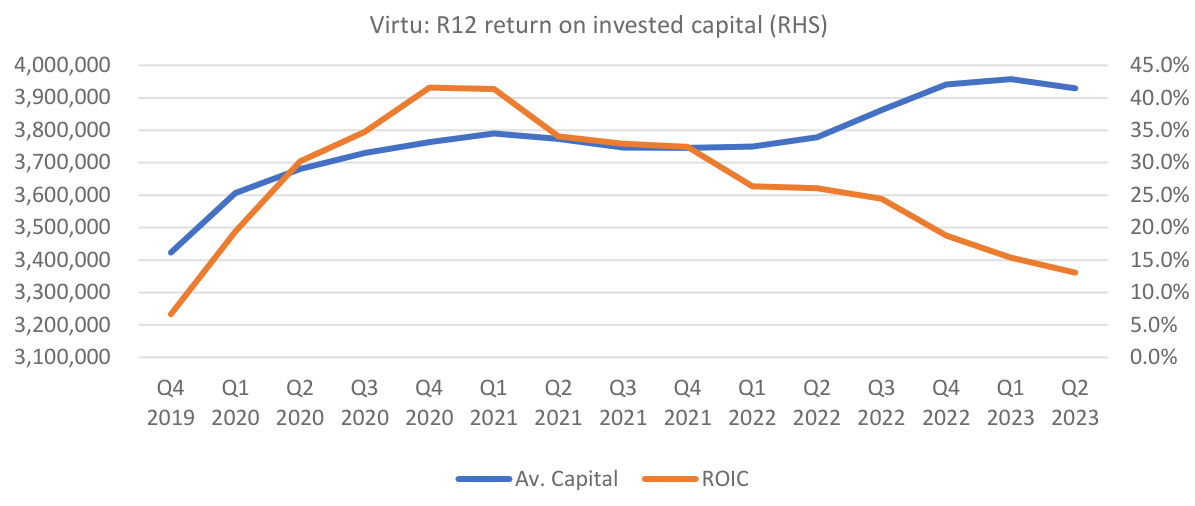
Taking a rough path through the numbers, Virtu needs to generate revenue of just over 20%pa on total capital to pay for overheads and a total of ~23%pa to pay for overheads, interest costs of debt capital and capital expenditure. Since the bedding down of ITG, it has roughly earned trading and commission returns of twice that level on a base currently around $3.8billion.
Both of the above charts clearly show Virtu is at a low(ish) point compared to recent times in respect of profitability and returns. Yet at a market capitalisation of $2.8billion, even when underearning, the company is minting a free cash flow yield on equity of 10-11%. 18 In rough terms, it is paying out half of this in dividends ($156m at $0.96 per share) still leaving $140million to buy back stock. At prevailing prices, that is very close to 5% of the capital per annum.
The free cash flow figures equate to an adjusted profit after tax which we would be confident of capitalising of ~$327million, equivalent to exactly $2/share; the end quarter price of $17.27 represents a P/E of 8.6x our adjusted trailing 12month number of far from adequate earnings.
So why is Virtu stock so bombed out?
From our return charts above, Virtu’s profitability seems close to a low point since the “appalling” 2019 period where equity markets in the US moved up on extremely low volatility, leaving very little scope for market making profits. The prevailing environment in 2023 seems rather different, so there is some hope for a respite and a return to more normal bid-offer spread/volatility in market making and adequate volume for execution services.
Given the cycles inherent within the business, any expectation of improvement would usually see the price multiple for the stock expand slightly to account for a low(ish) point in the cycle – not so here. Remember in the last twelve months, on our adjusted numbers, Virtu earned less than one-third of the Q1 2021 peak cash profit before interest and tax of $1.57billion.
There are three possible explanations for this:
-
- Regulatory environment;
- Specific legal claims lobbed at Virtu by the SEC; and
- Potential perception that Virtu is not well placed in a highly competitive if growing industry.
SEC Equity Market Structure Proposals
Whilst the 2021 “meme-stock” boom was an enormous short term positive for market makers, the gradual disclosure of payments for order flow and the eventual decisions by many firms to stop new open positions in Game Stop (amongst others) precipitated a perception amongst retail traders that the market was rigged against them With new relatively new, commission free platform, Robinhood being a major beneficiary of the trading boom, it admissions over the quantum of fees received from PfOF led to enquiries and eventual settlement deals with SEC.
In the wake of the meme-stock demise, SEC investigated a number of practices from the period and in mid-2022 presaged a significant overhaul of stock trading. In December 2022, SEC put forward new Equity Market Structure proposals which are the most radical since the NMS overhaul of 2005. Whilst the “industry” – exchanges and wholesalers (like Virtu) are generally in favour of greater quote transparency and a selected reduction in “tick” sizes, more politically motivated attempts to change the system have been vehemently opposed. The most aggressive comments have been against a SEC’s proposed new retail auction system whereby wholesalers would bid for customer orders from the initiating broking, rather than have the broker award them to wholesalers as part of a PfOF or other contractual arrangement.
Looking from the outside, even with exceptional technology, the auction system appears ridiculously unwieldy, and unnecessary with other acceptable proposals enhancing market transparency which the industry believe is acceptable.
Virtu (and others) response is that the “retail auction” proposal would actually widen spreads and make markets more opaque. Further, most of the wholesalers and exchanges want any changes to “best execution” protocols delayed to accommodate the impact of changes on tick sizes and enhanced order execution information.
In our view, the original extreme fear over SEC proposals has dissipated, and should start to decline further over time, with a unanimous view from all major market players.
Specific legal claims against Virtu
As the most publicly clear company detrimentally impacted by SEC-proposed legislative change, Virtu (mainly via CEO Douglas Cifu) commenced a campaign to see the proposals watered down. The campaign – commencing in June 2022 – became increasingly vitriolic and personal as a result of Virtu’s views not just about potential legislative change but the manner in which SEC was promulgating the proposals – in Virtu’s view, with inadequate public discussion. Virtu sued SEC to gain further details and around its Q3 2022 results was particularly scathing over SEC’s behaviour, specifically that of SEC Chair Gensler who it accused of being political rather than regulatory.
There is little doubt that SEC has concerns over PfOF and the dominance of a small number of firms in the off-exchange business (read Citadel and Virtu), SEC have now brought forth various charges against Virtu – made public in September 2023 regarding potential breaches of Virtu “internal information barriers” between January 2018 and April 2019. Virtu’s attempts to settle with SEC have been unsuccessful and the case will proceed to court. In a statement on 12 September 2023, Virtu explicitly linked the case with their prior criticism and legal action regarding the Equity Market Structure proposals.
In our view, investors have been put off Virtu by its aggressive stance, even though on cold evaluation, the chances of a materially financially damaging impost against the company appear remote.
Competitive environment
Aside from the cyclically depressed trading conditions over twelve months, with slowing volumes - year to date (end August statistics) show traded value down 17% over 2022 (although the off- exchange values in the same period have fallen by only 8.6%), there is an increasing perception that in some areas Virtu is not innovating quickly enough against strong competition.
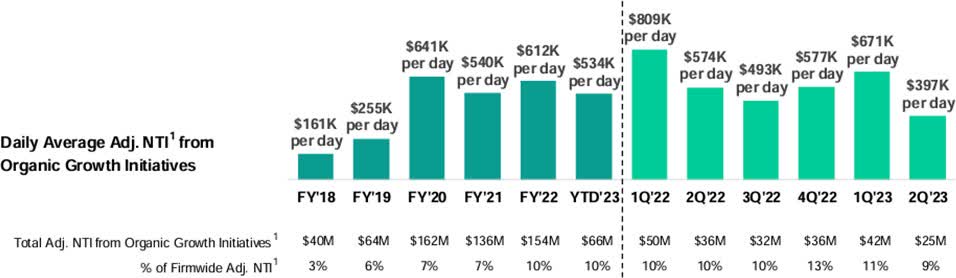
At each quarterly earnings briefing, Virtu disclose daily adjusted net trading income from “new initiatives” which are currently defined as options market making, ETF 19 block trading and crypto. Clearly the results will fluctuate with overall market environments, but the type of strong growth expected from a low/zero base hasn’t really materialised, and the initiatives have (currently) petered out at around 10% of overall NTI/day:
On a rolling twelve-month basis, the latest addition of $135million is well down on FY22, which is baffling given the visible growth in the options market, where Virtu appear to be focused on index rather than single stock options. Given the credentialled competitosr in the options market, there is a genuine fear that Virtu will potentially have to seek out an expensive acquisition at a time they are under-earning. We have confidence that Virtu are proceeding diligently but would prefer to see more visible initiatives.
Conclusion
Virtu is at an interesting competitive juncture. The “lit” exchange owners – ICE (NYSE), Nasdaq and Cboe – all of whom are publicly listed, are chasing growth in the NON exchange market either in mortgages ( ICE ), data provision ( CBOE ) or areas like workflow and indices (NASDAQ). All trade on forward P/E multiples of 17 – 21x FY2024 earnings to reflect the value of data or their new initiatives; if Virtu trades at 8x P/E, one might reasonably argue whether their other activities are VERY heftily valued given their equity exchange earnings are also not growing.
Investors seem to be reasoning that Virtu has limited scope to grow or has “lost its mojo” and worry about its bickering with the regulator. Whilst cognisant of these arguments, we see the long-term results of others in the sector and believe once the regulatory fog clears, investors – and given the Viola family control, perhaps even a corporate – will see the clear value in the stock.
In the meantime, the 5.6% dividend yield and voracious share buy back regime should provide a floor under the shares awaiting more conducive spread conditions.
Footnotes1 Includes all share classes totalling 163m shares including 68.8million unquoted securities 2 In USA on 29 September; Australia on 26 October 2023 3 Flow Traders, with a greater focus on ETF market making, based in Amsterdam, is listed on that market. We have a small holding.\ 4 NYSE, NYSE Arca, NYSE National, NYSE Chicago, NYSE American, NASDAQ, NASDAQ BX, NASDAQ PHLX, Cboe BZX, Cboe EDGX, Cboe BYX, Cboe EDGA, Investors Exchange ( IEX ), Members Exchange ( MEMX ), Long Term Stock Exchange (LTSE) and MIAX Pearl. Source: SIFMA Insights “Market Structures” September 2021 5 Regulation National Market System 6 Source: SIFMA/Cboe| 7 Sandler O’Neill presentation 18 June 2015 8 An ATS acts similar to a stock exchange matching buys/sells from subscribers. Virtu is a founding participant, with eight other major firms of Members Exchange ( MEMX ) – a market similar to this. 9 “Virtu Announces Merger with Madison Tyler and Strategic Growth Investment from Silver Lake” BusinessWire 31 May 2011 10 NOT David Solomon of Goldman Sachs11 GAAP earnings adjusted for IPO costs etc. 12 An excellent piece on the history of KCG by Bishr Tabbaa can be found at “ 44 ” 13 Leucadia, the Jefferies parent, repeated the exercise in January 2015 on FXCM, a fx dealer caught out by the SNB “unpegging” surge in the Swiss franc on 15 January 2015 14 VIRT’s compensation ratio ran at ~23% of net trading income; KCG’s was >40%. 15 Monthly “Global Market Structure” newsletters at Thought Leadership 16 Source: Cboe Exchange via SIFMA 17 Given withholding tax, we would far prefer share buy backs at prevailing prices. 18 Cash profit $510m – capex ($30m) – interest ($85m) – tax ($98m) = $297m/market value equity $2800m 19 Exchange traded funds Copyright and Disclaimer©Other than material being the property of its respective owners, this presentation is copyright 2023 East 72 Management Pty Ltd. All Rights Reserved. You may not reproduce parts of this work without permission, which can be sought by email, but you are free to distribute the work in its entirety with full attribution. This communication has been prepared by Andrew Brown and East 72 Management Pty Limited (E72M) (ACN 663980541); E72M is Corporate Authorised Representative 001300340 of Westferry Operations Pty Limited (AFSL 302802) of which Andrew Brown is a Responsible Manager. While E72M believes the information contained in this communication is based on reliable information, no warranty is given as to its accuracy and persons relying on this information do so at their own risk. E72M and its related companies, their officers, employees, representatives and agents expressly advise that they shall not be liable in any way whatsoever for loss or damage, whether direct, indirect, consequential or otherwise arising out of or in connection with the contents of an/or any omissions from this report except where a liability is made non-excludable by legislation. Any projections contained in this communication are estimates only. Such projections are subject to market influences and contingent upon matters outside the control of E72M and therefore may not be realised in the future. This update is for general information purposes; it does not purport to provide recommendations or advice or opinions in relation to specific investments or securities. It has been prepared without taking account of any person’s objectives, financial situation or needs and because of that, any person should take relevant advice before acting on the commentary. The update is being supplied for information purposes only and not for any other purpose. The update and information contained in it do not constitute a prospectus and do not form part of any offer of, or invitation to apply for securities in any jurisdiction. The information contained in this update is current as at 30 September 2023 or such other dates which are stipulated herein. All statements are based on E72’s best information as at 30 September 2023. This presentation may include officers and reflect their current views with respect to future events. These views are subject to various risks, uncertainties and assumptions which may or may not eventuate. E72M makes no representation nor gives any assurance that these statements will prove to be accurate as future circumstances or events may differ from those which have been anticipated by the Company. |
Editor's Note: The summary bullets for this article were chosen by Seeking Alpha editors.
For further details see:
East 72 - Virtu Financial: From Lust To Loathing