EWBC - East West Bancorp: Not The Time To Be Overly Bullish (Technical Analysis)
2023-07-06 05:55:41 ET
Summary
- East West Bancorp has reported strong growth and beat bottom-line estimates, leading some investors to believe its shares have been unfairly impacted by the banking crisis.
- However, technical analysis suggests a bearish trend, with the bank's 10-month average moving down to test the 40-month average and no evidence of a bullish crossover in the stock's long-term MACD & histogram.
- Despite a recent rally, EWBC's shares are unlikely to cross the $62 level on any near-term rally due to broken long-term support and the impact of inflation on real gains.
Intro
East West Bancorp, Inc. ( EWBC ) came across our desk from a screen we ran where the objective was to find fundamentally strong companies with attractive valuations. The regional bank continues to report strong top-line growth numbers and recently beat the consensus bottom-line estimate in Q1 of this year. Shares now trade with a trailing book multiple of 1.2 and the bank has returned 1.8% off its growing asset base over the past 12 months. These are solid numbers especially when one considers the expected 10%+ bottom-line growth rate this year (EPS of $8.75). Moreover, these numbers along with heavy insider buying in May of this year have led many investors in believing that shares of East West Bancorp have unfairly been punished as a result of the banking crisis earlier this year.
While this may be true, let's delve into the bank's technicals which in our view are a summation of the fundamentals of the company. East West Bancorp has a long history so let's start off with the monthly chart spanning back to 2003.
Long-Term Chart
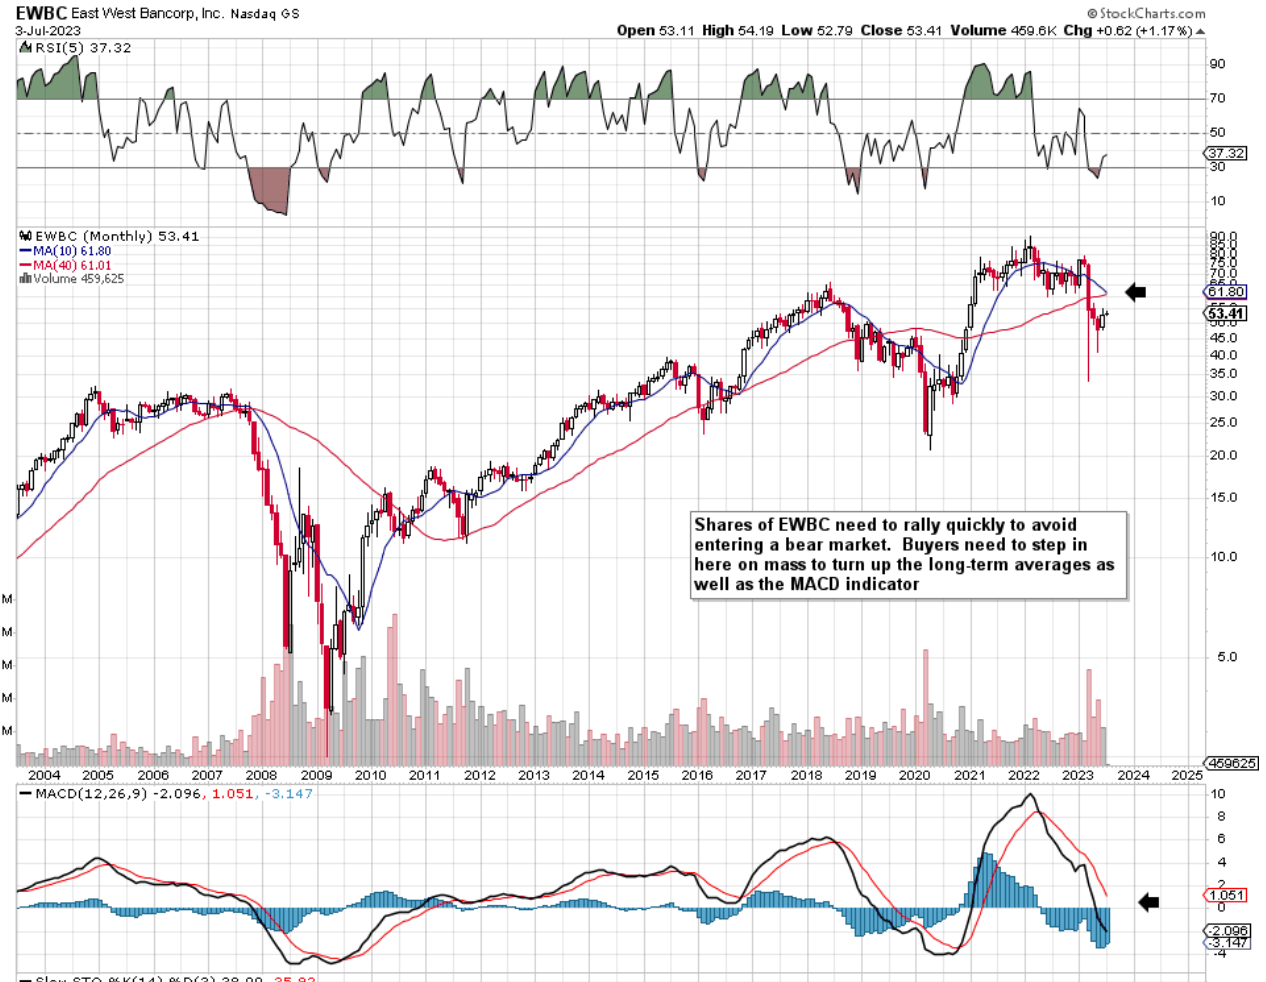
Although EWBC has been making higher lows and higher highs since shares bottomed back in the great recession of 2009, this bullish pattern is now in jeopardy. What we mean by this is that lower prices in EWBC over the past 18 months or so have resulted in the bank's 10-month moving average moving down to test the corresponding 40-month average. We use these averages on long-term charts to decipher whether the stock in question remains in a bull market or not. As we witnessed both in 2007 & 2019, long-term bearish crossovers resulted in much lower prices in the months that followed. Suffice it to say, if the bank's 10-month average ($61.80 at present) moves significantly below the corresponding 40-month average ($61 at present), this would be a bearish signal for EWBC.
Another worrying trend in the stock's long-term MACD & histogram. This indicator is noteworthy on long-term charts due to the dual purpose of the indicator (Momentum & Trend) as well as the sizable amount of information this indicator is able to digest. As we see below, we see no evidence as of yet that a bullish crossover is on the cards here any time soon. The long-term histogram remains depressed so given the trend that is already in motion here (bearish), EWBC's share price may have to go lower here before buyers step in in earnest.
EWBC long-Term Technicals (Stockcharts.com)
Intermediate 5-Year Chart
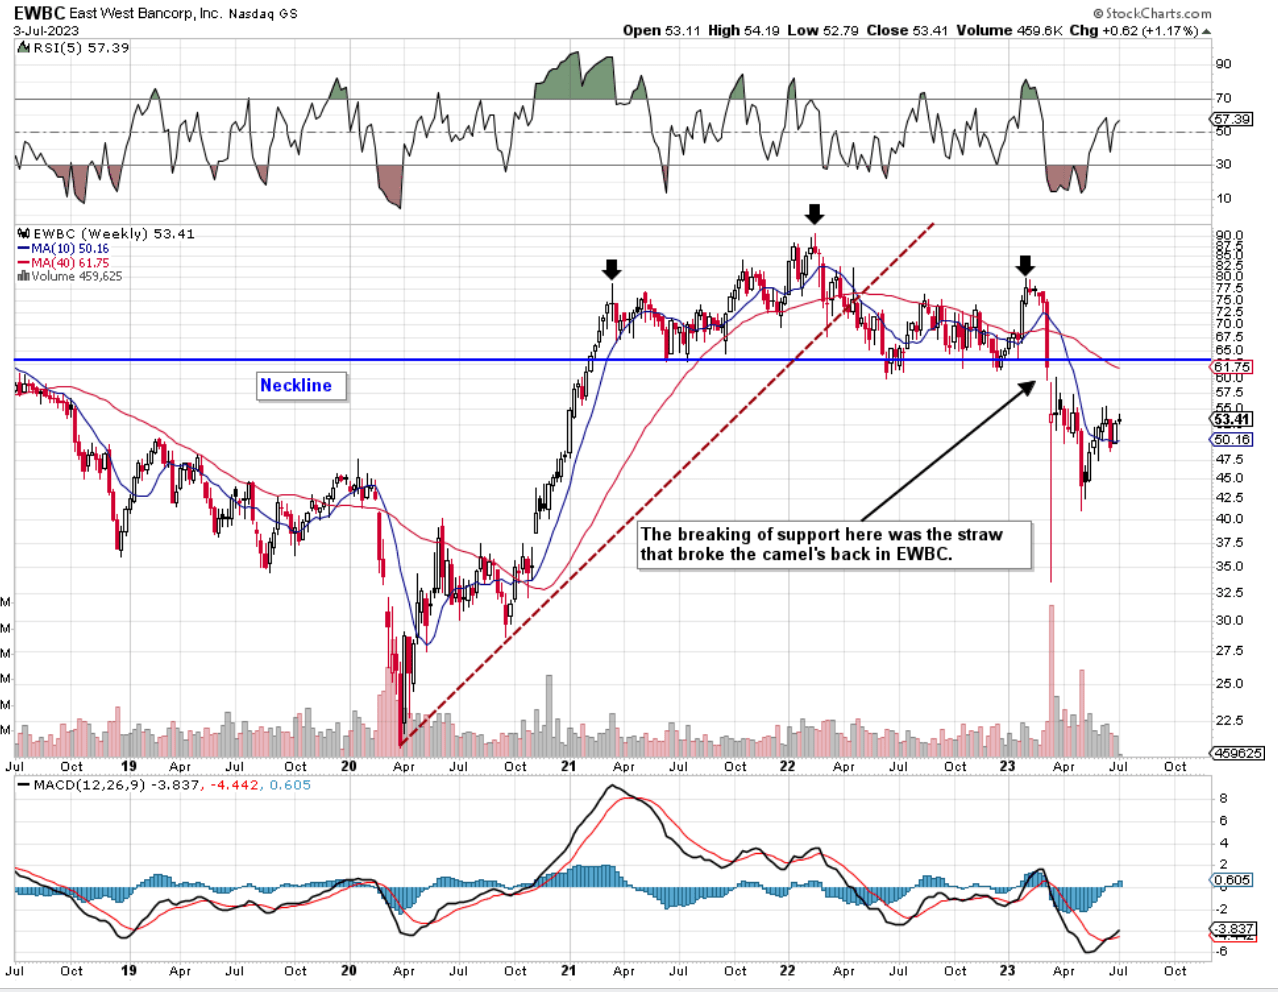
As we see from EWBC's weekly chart below, shares look like they recently completed a head & shoulders topping pattern. The 'giveaway' sign was the breaking of the neckline on strong volume which ended up hurling shares briefly under $40 a share. Over the past nine weeks or so, we have seen shares make a comeback but here is where investors need to be careful for the following reason.
The 'head & shoulders topping pattern is pretty reliable in that it invariably takes place when the sustained pattern of higher highs and higher lows eventually comes to an end. Therefore, what the charts are letting us know here (given how oversold shares are at present) is that EWBC could very well rally back up toward the neckline resistance level of roughly $62 a share. This would equate to a 15% increase in EWBC's current prevailing share price ($53+) but this is not a given at this stage (As necklines always do not get tested). The most important takeaway however is even if we get a bear-market rally in EWBC over the upcoming months, shares now should not cross that $62 level on any near-term rally (as long-term support has now been broken). This is where investors need to size up the risk/reward profile in EWBC at present especially given how inflation continues to drive a wedge between nominal gains and real gains in the investing landscape at present.
EWBC Head & Shoulders Topping Pattern (Stockcharts.com)
12-Month Short-Term Chart
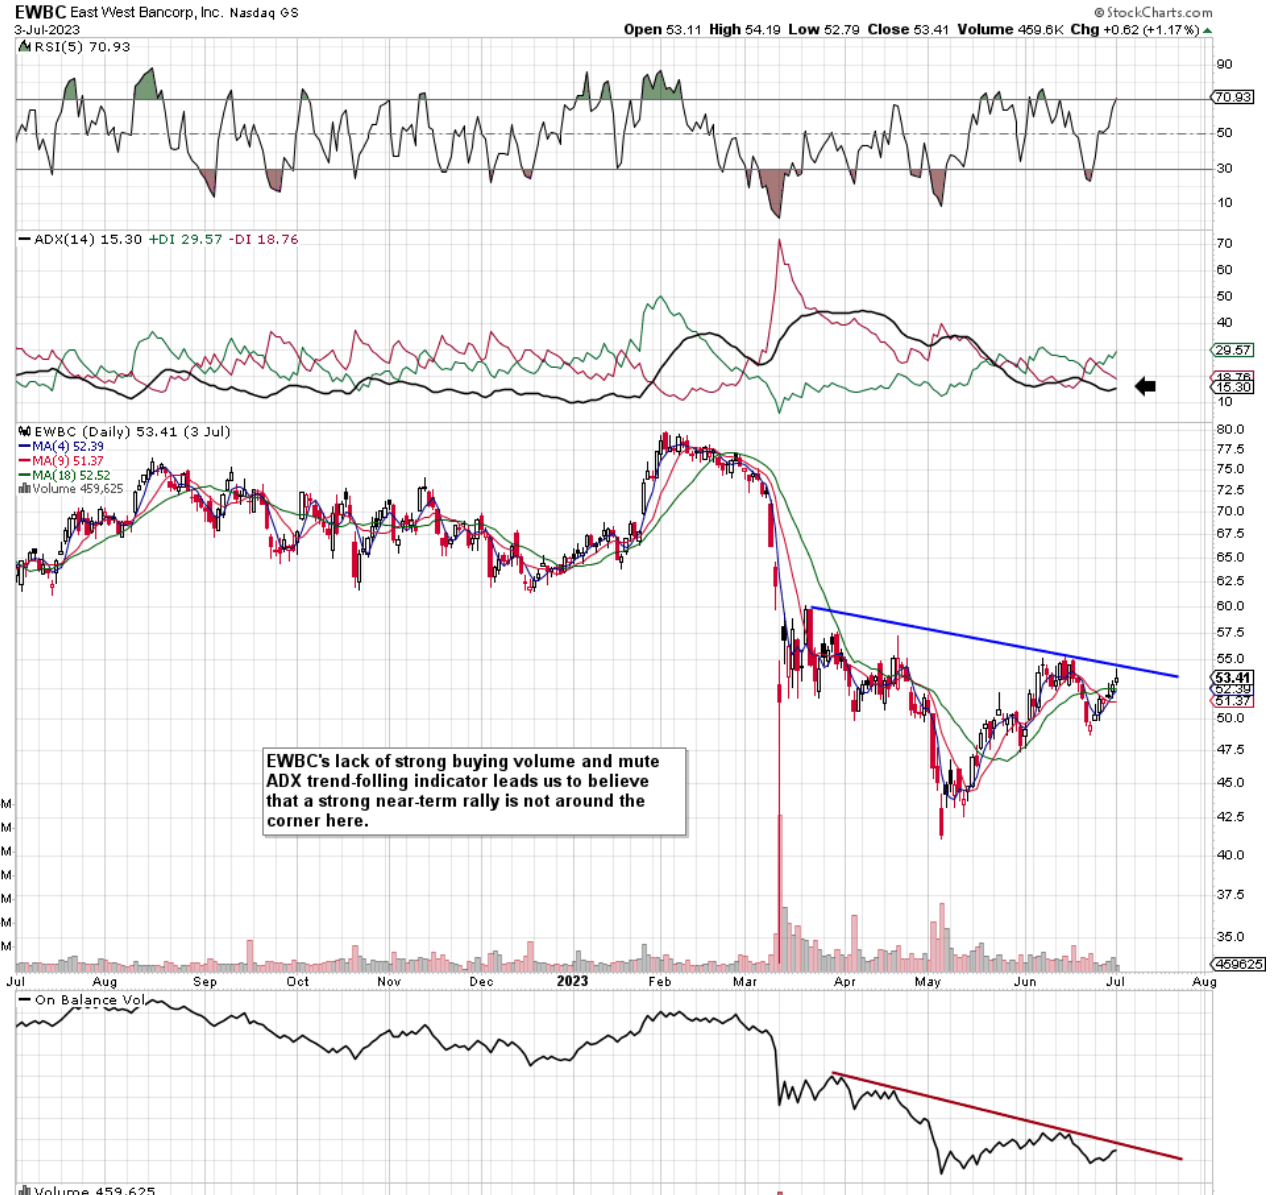
On EWBC's near-term chart, we see that shares (as a result of the sustained up move since early May) are now testing overhead resistance as depicted by the trendline below. However, the absence of strong buying volume (which obviously ties in with the low ADX readout at present) would be reasons enough for us not to buy into this current up move. This premise ties into what we mentioned earlier concerning how inflation impacts real gains in a stock portfolio. Suffice it to say, we do not want to be invested in names that are not trending irrespective of how sound the bank's fundamentals may be at this present moment in time.
EWBC 12-Month Chart (Stockcharts.com)
Conclusion
Therefore to sum up, although East West Bancorp's attractive valuation and strong profitability profile may attract investors here, the bank's technicals are demonstrating that a sustained rally may be difficult to achieve here. Let's see what Q2 brings. We look forward to continued coverage.
For further details see:
East West Bancorp: Not The Time To Be Overly Bullish (Technical Analysis)