OXLC - ECC: Avoid The Riskiest Part Of The CLO Structure (Rating Downgrade)
2023-10-31 23:31:48 ET
Summary
- Eagle Point Credit Company has experienced middling total returns in the past year despite its high yield.
- ECC show classic signs of being amortizing 'return of principal' funds. Total returns of 6-8% cannot fund 18% yields.
- ECC's subordinated position within the CLO structure and potential for elevated defaults in the leveraged loan space warrant caution for investors.
About a year ago, I wrote a cautious article on the Eagle Point Credit Company ( ECC ). While ECC and its peer, Oxford Lane Capital ( OXLC ), paid very attractive distribution yields, when I look at the total return performance of these funds, I came away less than impressed. I also noted that both ECC and OXLC charged high total expenses, which may eat away at investors' capital in the long-run. Since my article, ECC's shares have lost 15.8% in price, and is flat in total returns (Figure 1).
Figure 1 - ECC have tread water since my recommendation (Seeking Alpha)
ECC's weak performance has come amidst a large rebound in risk appetites and benign credit conditions since last summer, which begs the question, what will happen if credit conditions deteriorate and loan defaults start to pile up?
ECC Overview
It is easy to fall in love with ECC and OXLC, as many investors and analysts on Seeking Alpha evidently have done. Who doesn't like investments paying a forward distribution yield of 18.8% and 20.8% respectively?
The issue I have is whether ECC and OXLC pay a sustainable distribution yield or are they simply amortizing 'return of principal' funds that do not earn their yields.
According to an Eaton Vance whitepaper , "the best measure of whether a fund has earned its distributions is the change in its NAV net of distributions. Regardless of how distributions are characterized, if a fund’s NAV increases, the fund earned its distribution. If not, the fund did not earn its distribution – the economic concept of return of principal." Regardless if you are an 'income investor' or 'total return investor', I highly recommend you read the linked article.
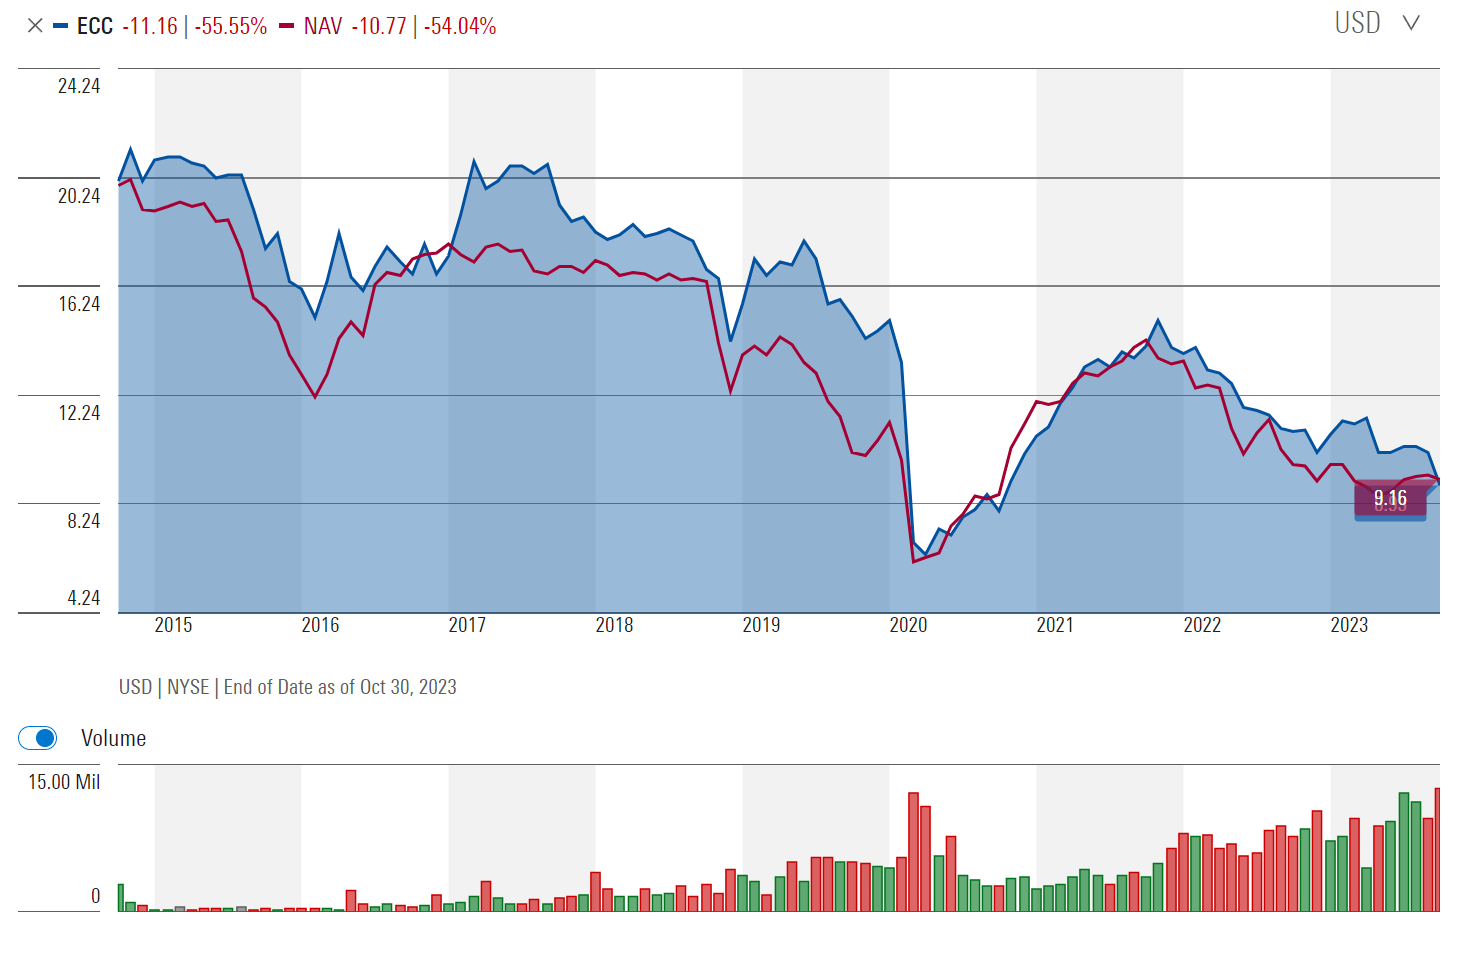
Looking at ECC's NAV since inception, the conclusion is quite clear, ECC is an amortizing 'return of principal' fund (Figure 2). The fund's NAV has shrunk by 54% since inception, and its stock price has followed suit by declining 55.6%.
Figure 2 - ECC's NAV has shrunk by 54% since inception (morningstar.com)
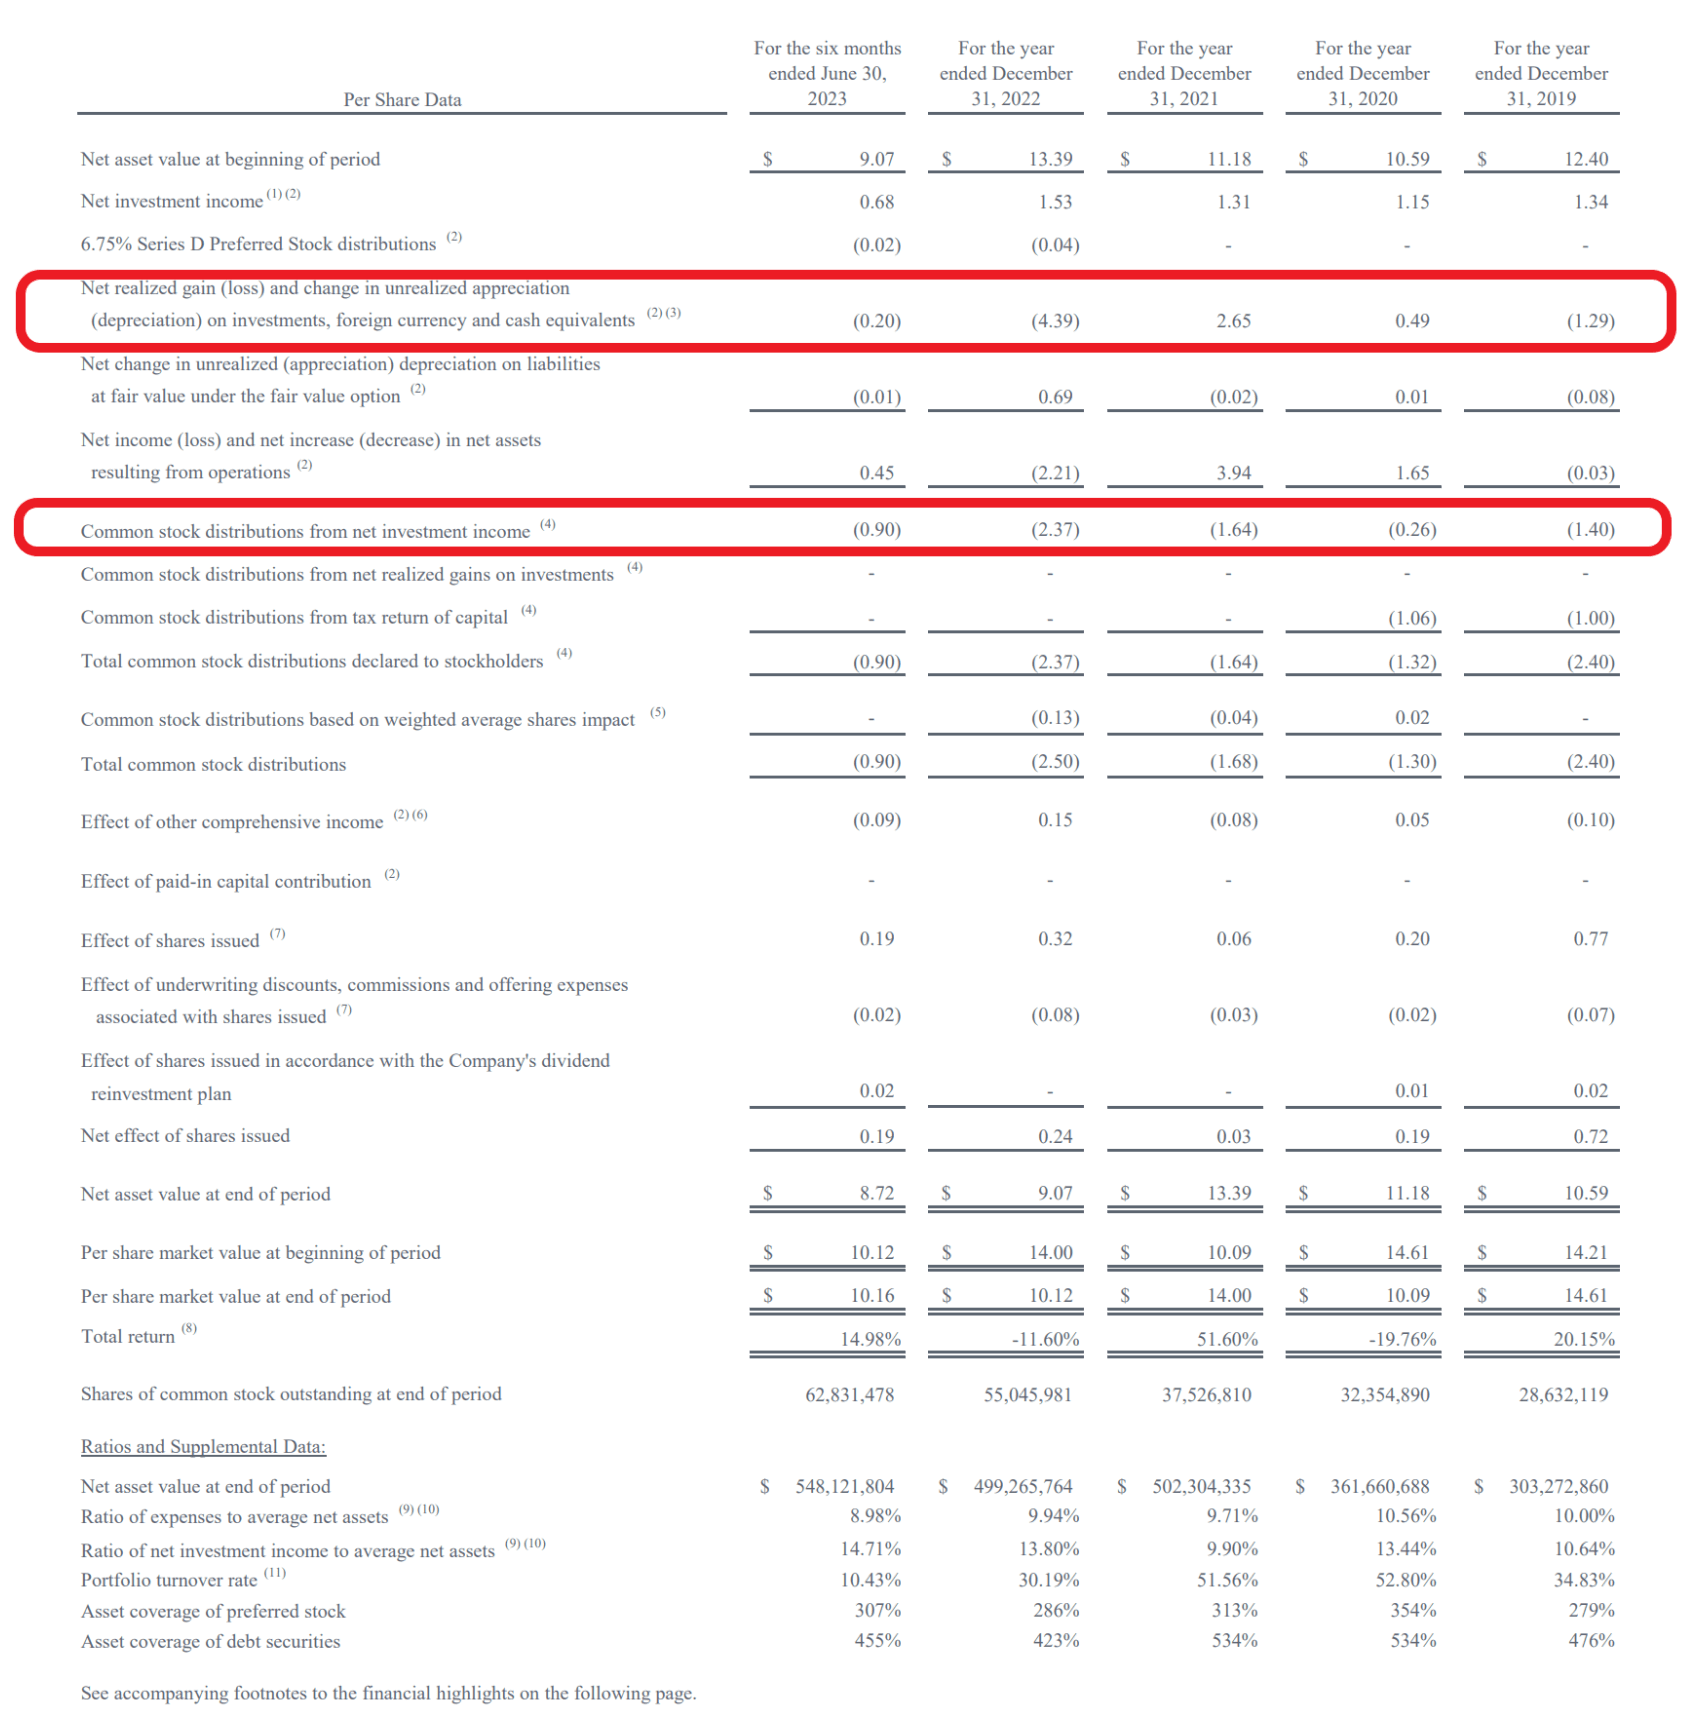
Some analysts point to the fact that ECC's distribution is funded from net investment income ("NII"), so its high distribution yield must be 'fully covered' (Figure 3). But they neglect to mention that in the past 4 and a half years, ECC also recorded $2.74 / share in realized and unrealized losses on investments.
Figure 3 - Don't ignore realized and unrealized losses on investments (ECC semi-annual report)
Beware How Managers Are Incentivized
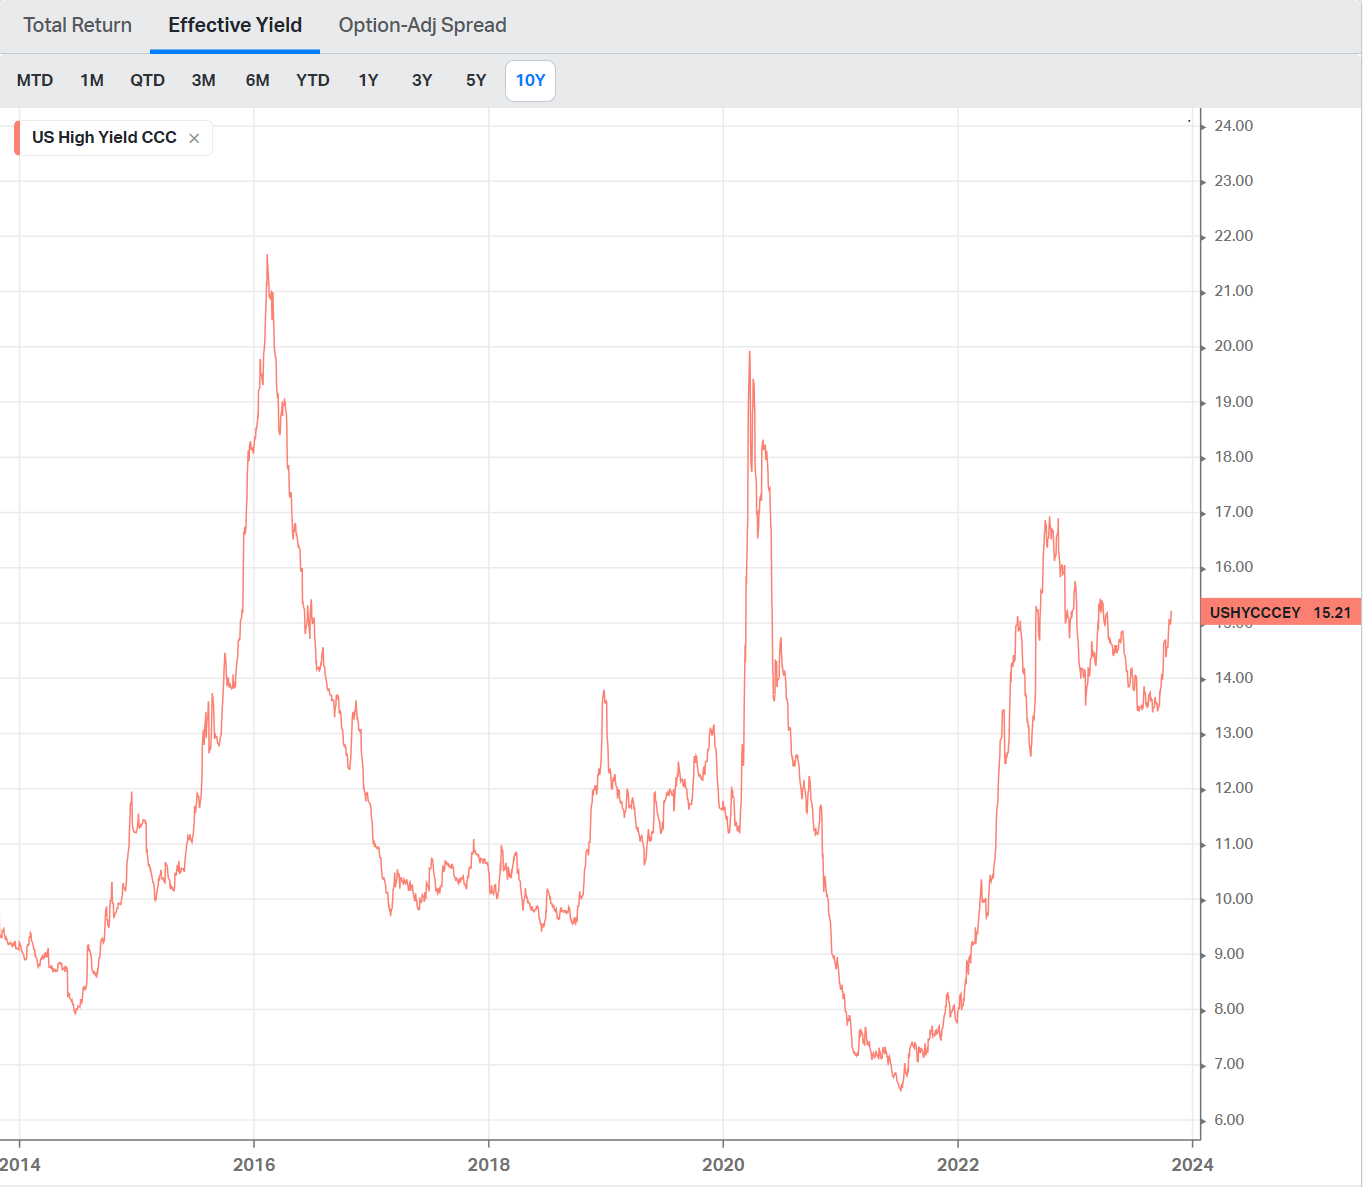
As a reminder for those not familiar with how credit instruments work, yields and credit risk often go hand in hand. An investment that pays a very high yield is often riskier, and may lead to increased credit losses to achieve those yields. For example, investors can buy CCC-rated junk bonds yielding over 15% today (Figure 4).
Figure 4 - CCC-rated bonds yield over 15% (koyfin.com)
But CCC-rated credits also have a cumulative default rate of 42% over 3 years (Figure 5). So adjusted for defaults, total returns are far less than the 15% 'yield'.
Figure 5 - Cumulative defaults by initial credit rating (S&P Global)
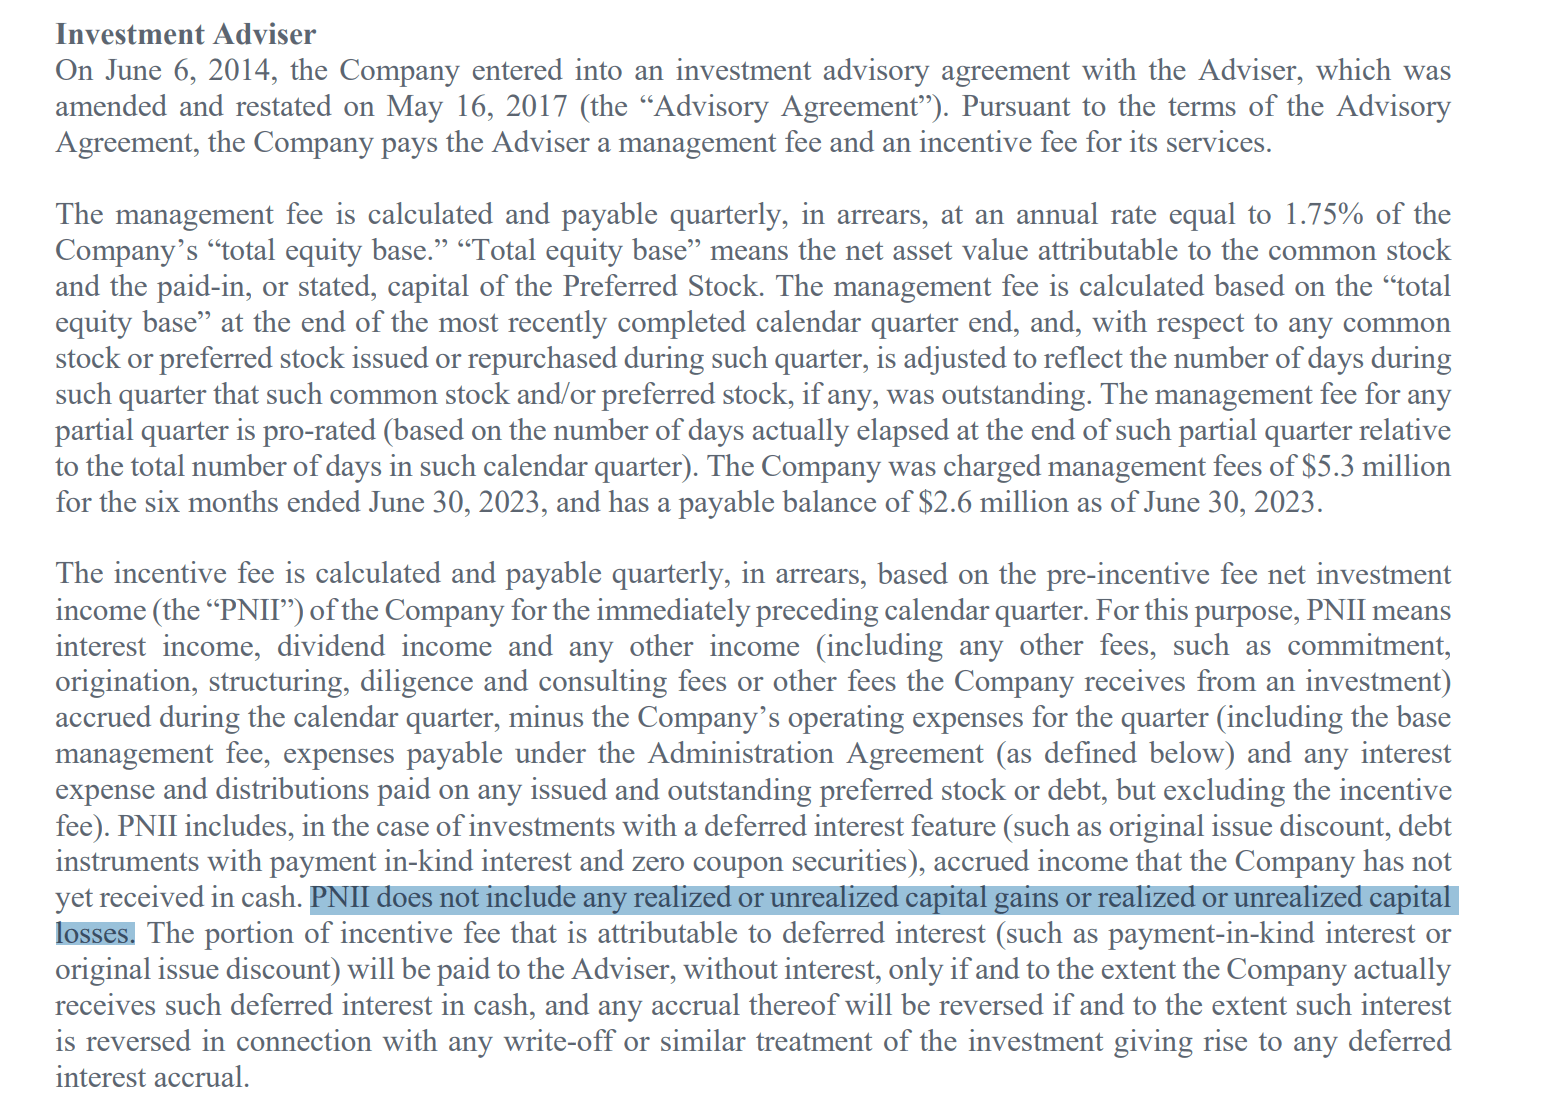
Unfortunately, it appears the managers of ECC (and OXLC for those that read the fine print) are paid incentive fees based on NII, and not total returns (Figure 6). Hence the managers may be more focused on generating high NII to maximize their incentive fees earned.
Figure 6 - ECC's incentive fees ignore realized and unrealized losses on investments (ECC semi-annual report)
Mid-Single Digit Total Return Not Enough To Fund 18% Yield
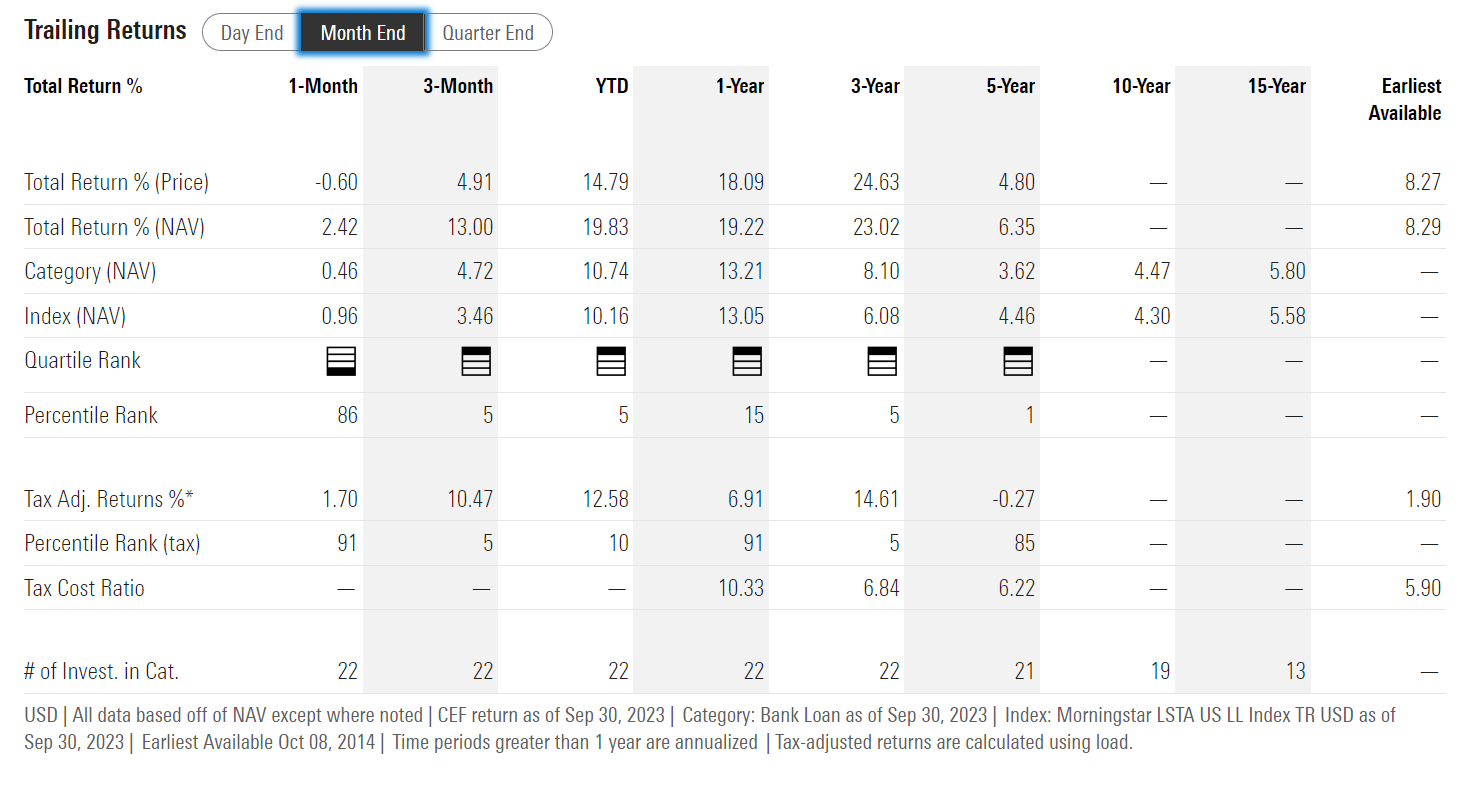
Speaking of total returns, it's not that ECC's total returns are horrible. Over a 5 year horizon and since inception, ECC has delivered 6.4% and 8.3% average annual returns respectively to September 30, 2023, which are respectable for credit-focused investments (Figure 7).
Figure 7 - ECC historical returns (morningstar.com)
The issue I have is simply the wide gap between ECC's 18%+ distribution yield and 6-8% total returns. If investors are comfortable earning 6-8% average annual total returns over a cycle, then by all means, choose ECC.
Historical IRRs Also Suggest High Single Digit Total Returns
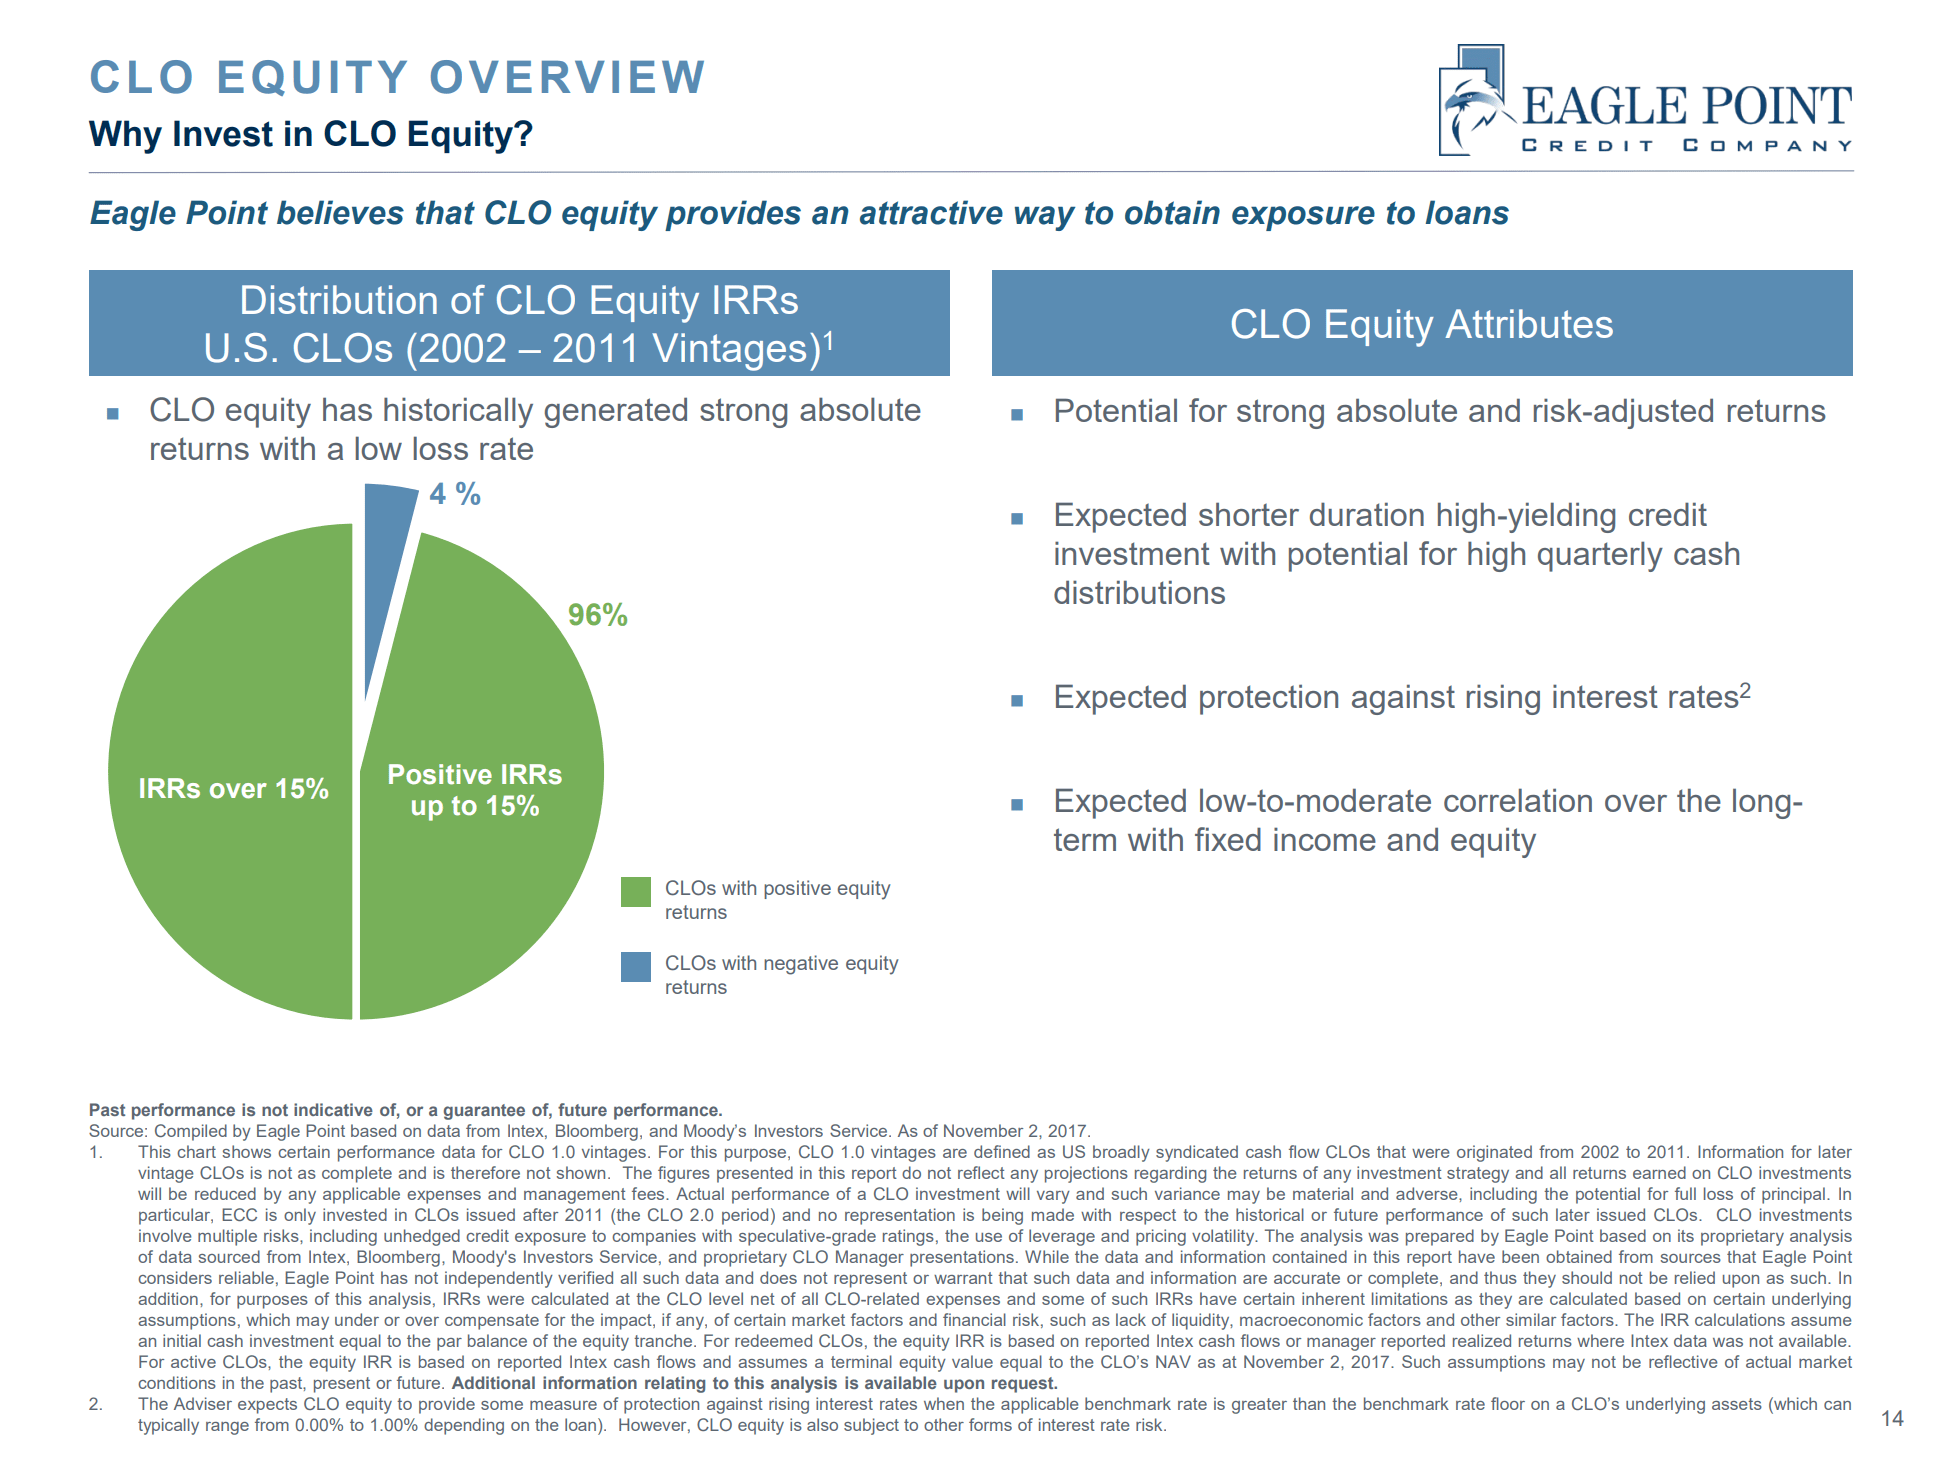
To figure out what kind of returns can be reasonably expected from the CLO equity asset class, we can also look at what ECC management says. In its investor presentations, ECC has a slide showing that about half of CLO 1.0 (those issued from 2002 to 2011) equity tranches have IRRs > 15%, half have IRRs up to 15%, and 4% have negative IRR (Figure 8). Using a weighted average approach, investors should expect gross IRRs in the low-double-digit ("LDD") range for a portfolio of CLO equities.
Figure 8 - CLO equity historical performance (ECC investor presentation)
If we then subtract ECC's management and incentive fees of 3-4% p.a. (management fees of 1.75% plus incentive fees that are often double or more of management fees), we again arrive at a high-single-digit ("HSD") net return to common shareholders, which is exactly what ECC has delivered historically (Figure 7 above).
Loan Loss Forecast Warrants Caution
However, there are also storm clouds on the horizon warning investors against putting too much capital into CLO equities. To understand why, we must first review the CLO structure and where ECC and OXLC stand within it.
Collateralized Loan Obligations or "CLOs" for short, are synthetic bonds created from packaging dozens to hundreds of leveraged loans and then tranching the pool of loans into securities with varying credit and cash flow characteristics (Figure 9). This securitization process allows Wall Street bankers to create highly rated investment grade debt securities from non-investment grade leveraged loans. Readers who want to learn more about CLOs can consult some of my prior articles or this primer from Pinebridge.
Figure 9 - CLO overview (pinebridge.com)
Within the CLO structure, rated debt tranches (AAA to BB in Figure 9 above), are protected from losses by structural enhancements such as overcollateralization and interest diversion. What this means in plain English is that cashflows collected from the pool of loans are used to pay interest to the most senior tranches first (AAA downwards in the capital structure), while credit losses are applied to the most junior tranches first (equity upwards).
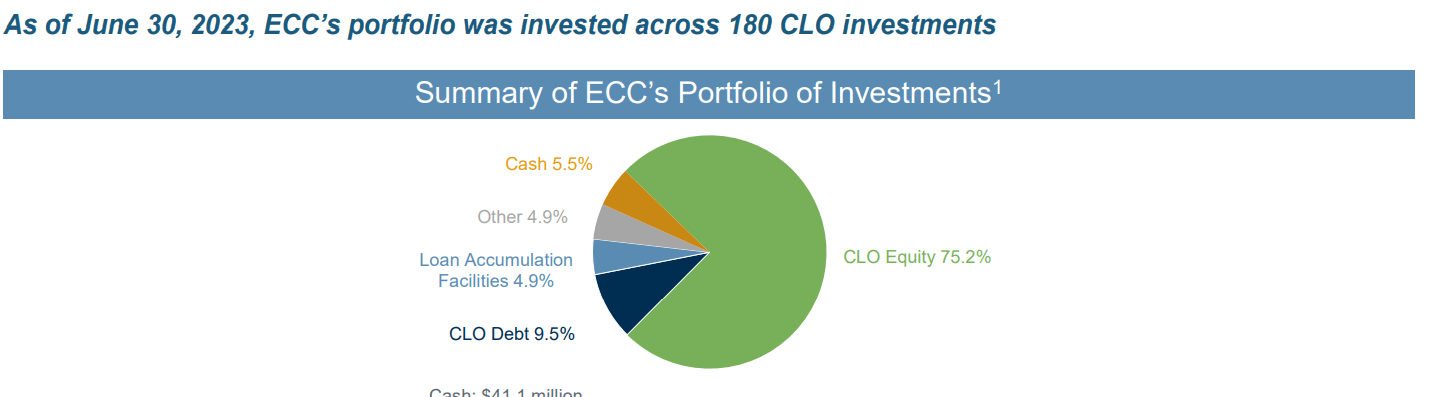
Investment funds like ECC and OXLC primarily invest in CLO equity tranches, which are the riskiest and highest yielding securities within the CLO structure. ECC has 75% of its portfolio invested in CLO equities and OXLC has 95% (Figure 10).
Figure 10 - ECC has 75% exposure to CLO equities (ECC investor presentation)
Although some analysts have compared CLOs to the infamous Collateralized Debt Obligations ("CDOs") that partly caused the Great Financial Crisis ("GFC") in 2008, the reality is that CLOs are generally much safer compared to CDOs. While both CLOs and CDOs are synthetic securities created by packaging low-rated assets into investment structures where highly rated securities can be created and sold to yield hungry investors, CDOs were narrowly focused on a single sector (real estate) whereas CLOs are broadly diversified across the economy.
That is why even through the Great Financial Crisis, hardly any rated CLO tranches defaulted. According to data from S&P Global, only 40 out of 4,322 originally rated CLO tranches defaulted, or 0.9% (Figure 11).
Figure 11 - Hardly and CLO debt tranches have defaulted (S&P Global)
However, what is not captured in S&P's data is the default rate of CLO equity tranches. To date, I have not seen any reliable data detailing historical default rates of CLO equity tranches, except for the IRR data provided by ECC. If any reader or analyst can point me to some independent statistics, I would be most grateful.
What we do know is that the cumulative default rates through GFC get progressively higher as we move down through the CLO structure, from 9 out of 783 BBB-rated CLO tranches ultimately defaulting (1.1%) to 22 out of 565 BB-rated tranches (3.9%) and 3 out of 28 B-rated tranches (10.7%). So it is not unreasonable to expect a cumulative default rate in the high teens or more for CLO equity tranches.
Ultimately, default rates of CLO securities are directly influenced by the credit performance of the underlying leveraged loans. If leveraged loans experiences elevated defaults, then CLO equity securities will inevitably suffer, since they are used to provide overcollateralization for the debt tranches.
A recent report from the credit rating agency Fitch sees leveraged loan losses of 4.0-4.5% in 2023 and a cumulative 7.5-9.0% default rate between 2023 and 2024 (Figure 12).
Figure 12 - Fitch sees elevated leverage loan defaults (Fitch)
This will take leveraged loan losses close to the crisis levels experienced during the COVID-pandemic (Figure 13). If underlying leveraged loans experience 7-9% defaults over the next 2 years, then many CLO equity tranches may experience elevated losses.
Figure 13 - Historical leveraged loan default rates (Morningstar)
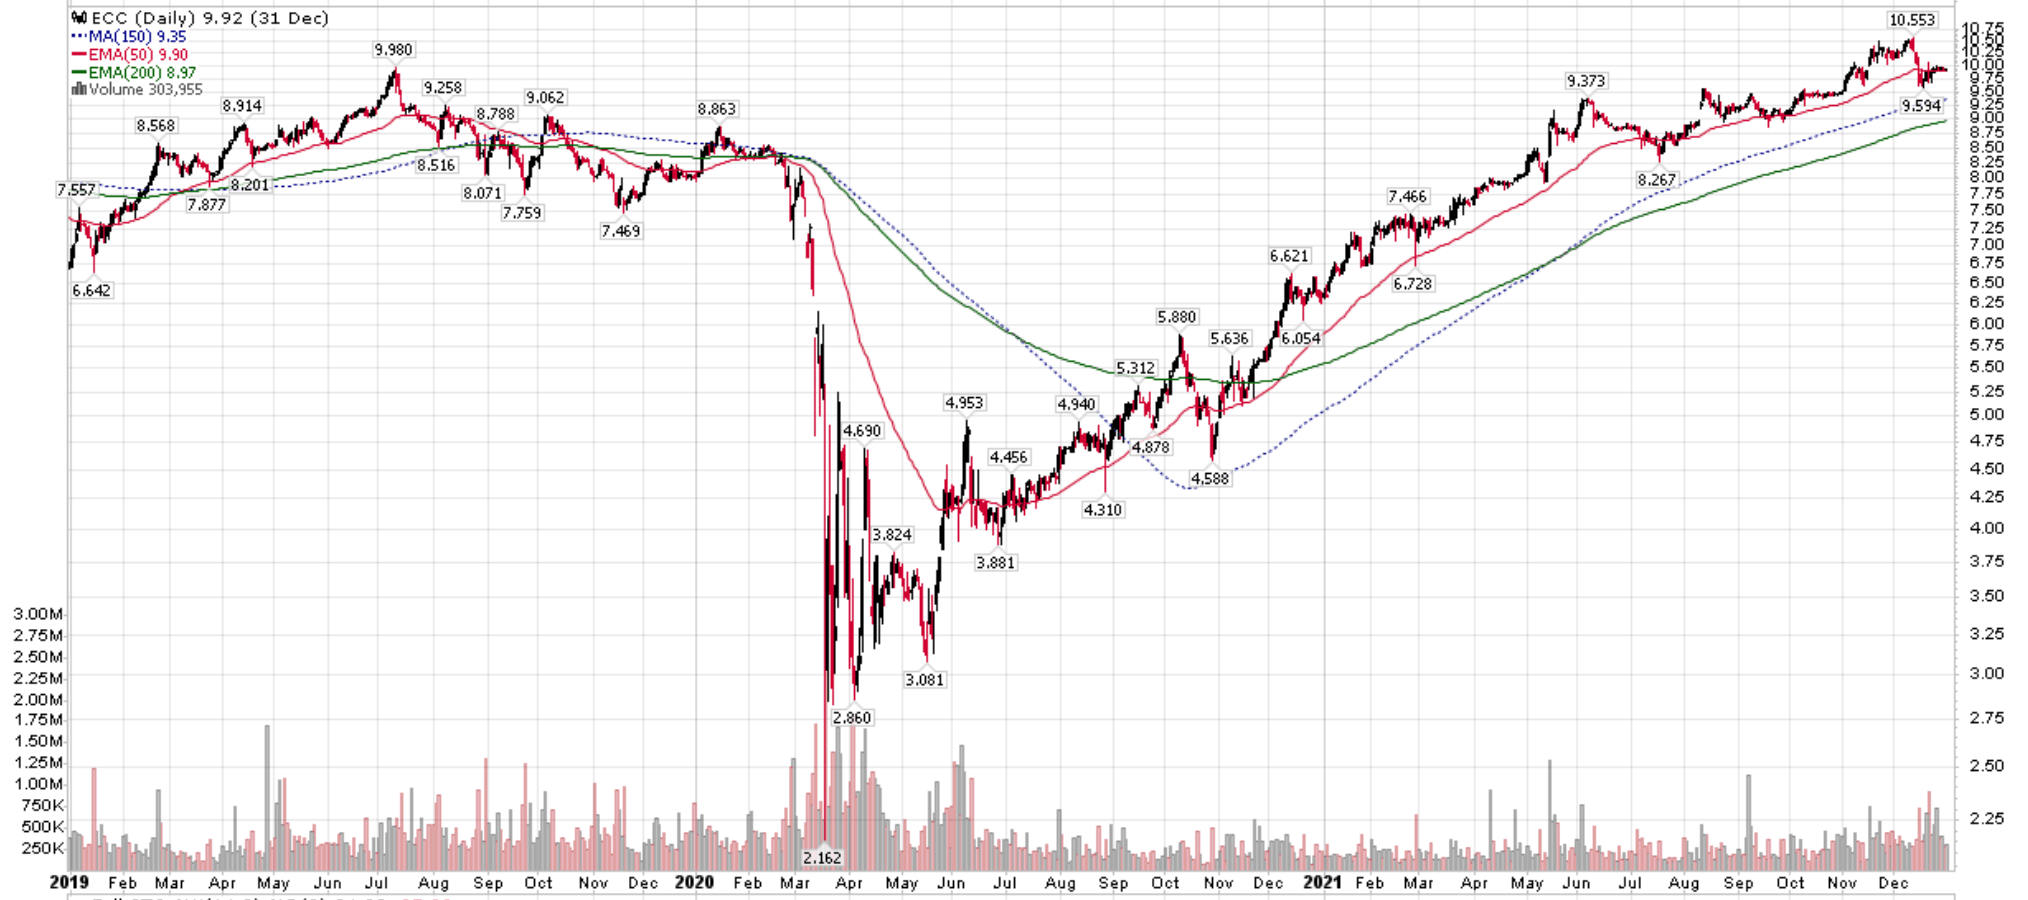
For those that were not involved with ECC during 2020, the COVID-pandemic was not a happy time period for ECC investors (Figure 14).
Figure 14 - Historical ECC stock price (stockcharts.com)
ECC As A Leveraged Play On BKLN
The way I view ECC and OXLC is very simple. I like to think of ECC and OXLC as extremely leveraged plays on the leveraged loan asset class. In fact, if we compare the total returns of the Invesco Senior Loan ETF ( BKLN ), the Janus Henderson AAA-CLO ETF ( JAAA ), and the Janus Henderson B-BBB CLO ETF ( JBBB ), we can see the varying degrees of leverage each 'class' of CLO securities have relative to the underlying leveraged loans.
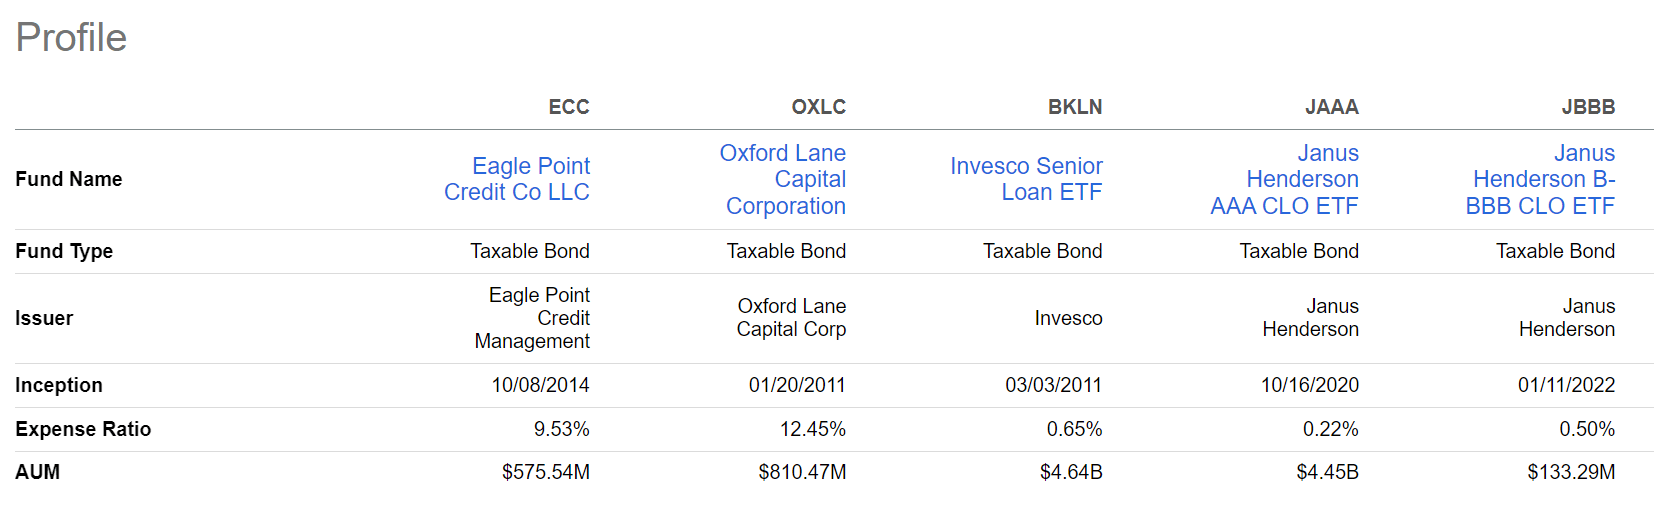
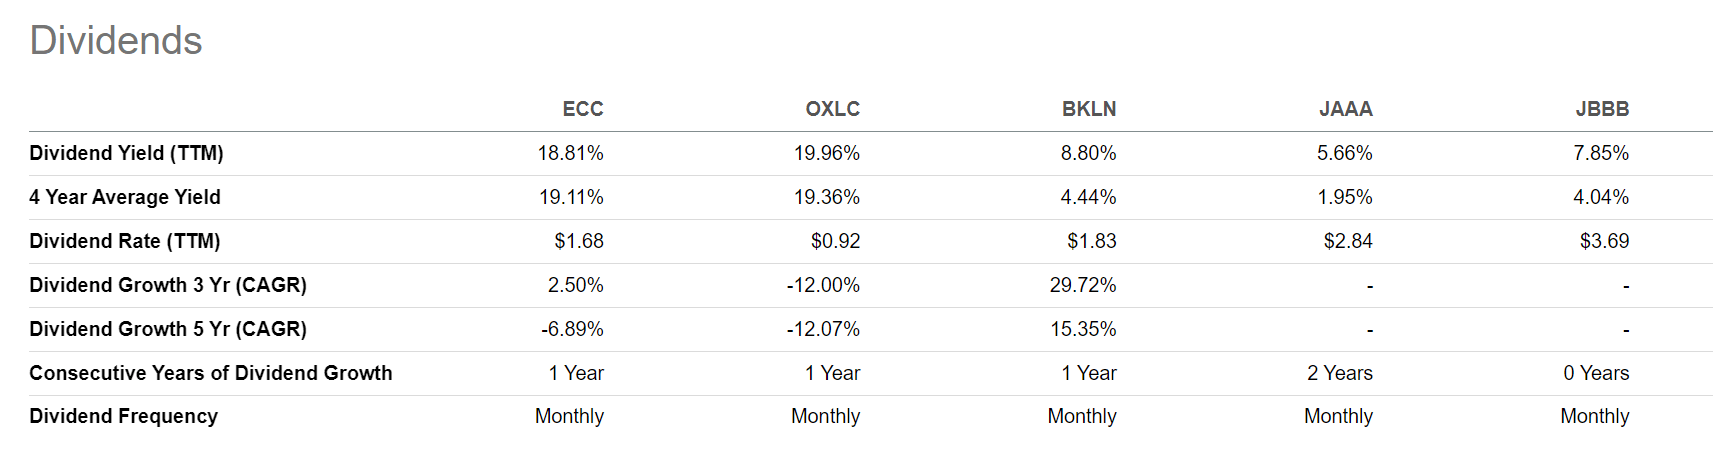
The BKLN ETF invests in a diversified portfolio of leveraged loans, the building blocks to CLOs. JAAA invests primarily in AAA-rated CLO tranches. JBBB invests in B- to BBB-rated CLO tranches. Figure 15 compares the fees of the varying funds while Figure 16 compares their distribution yields.
Figure 15 - ECC vs. peers, fees and structure (Seeking Alpha) Figure 16 - ECC vs. peers, distribution yields (Seeking Alpha)
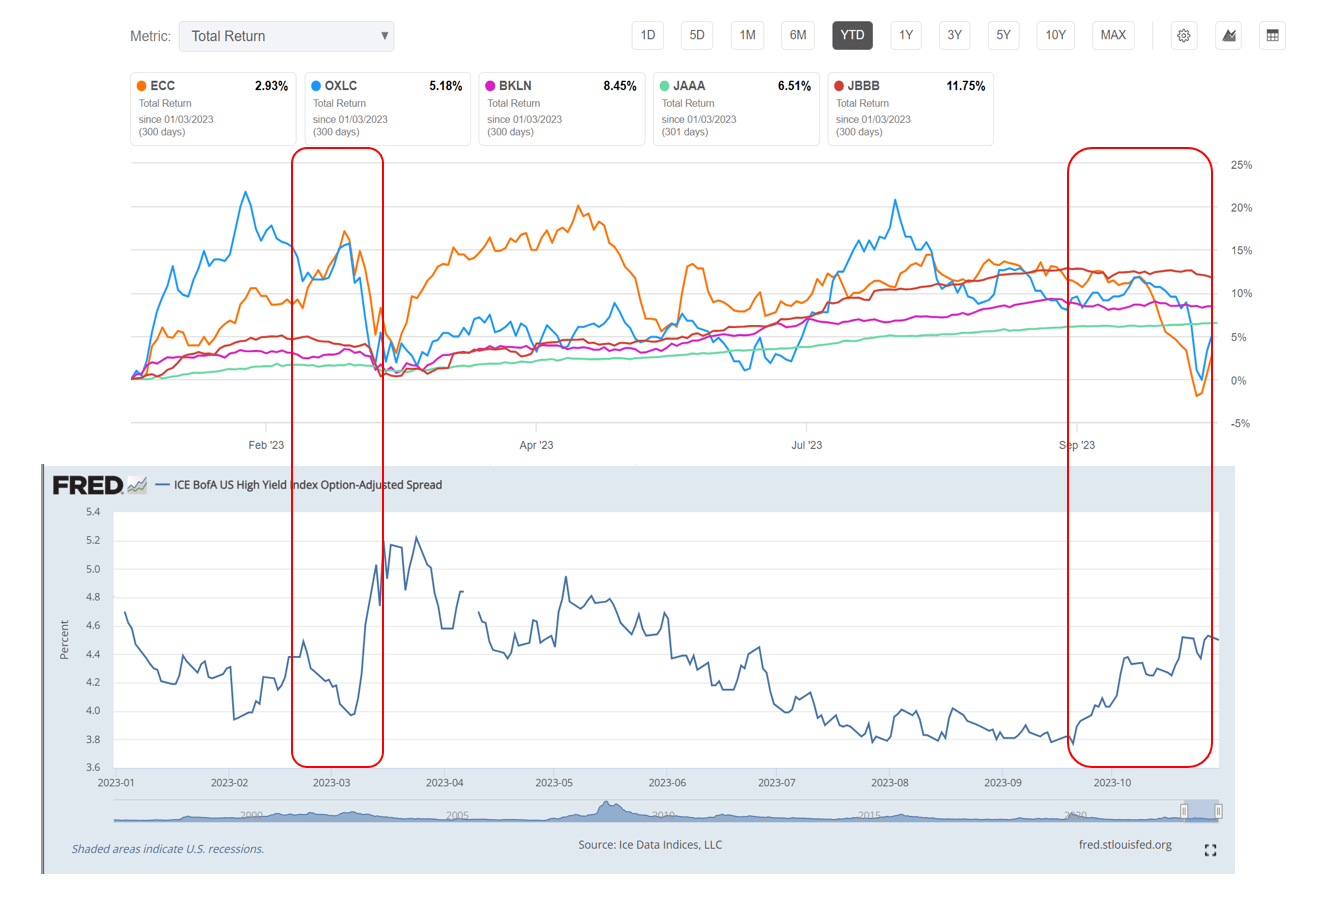
Figure 17 shows the YTD total returns of the peer funds. There are 2 observations I would like to make from this figure. First, we can see that JAAA total returns are much more stable compared to BKLN, whereas ECC and OXLC are much more volatile. This is to be expected as JAAA invests in the highest quality AAA-rated CLO securities whereas ECC and OXLC invests in the lowest-quality equity tranches.
Figure 17 - YTD peer fund total returns vs. high yield credit spreads (Seeking Alpha and St. Louis Fed)
Second, we can also observe that when credit markets have a hiccup like it did in March and recently since September, low-quality investments like ECC and OXLC catch pneumonia. This is because fixed income investors are well aware of ECC and OXLC's subordinated position within the CLO structure and price the spread on their holdings accordingly to provide the necessary protection for investment grade CLO securities.
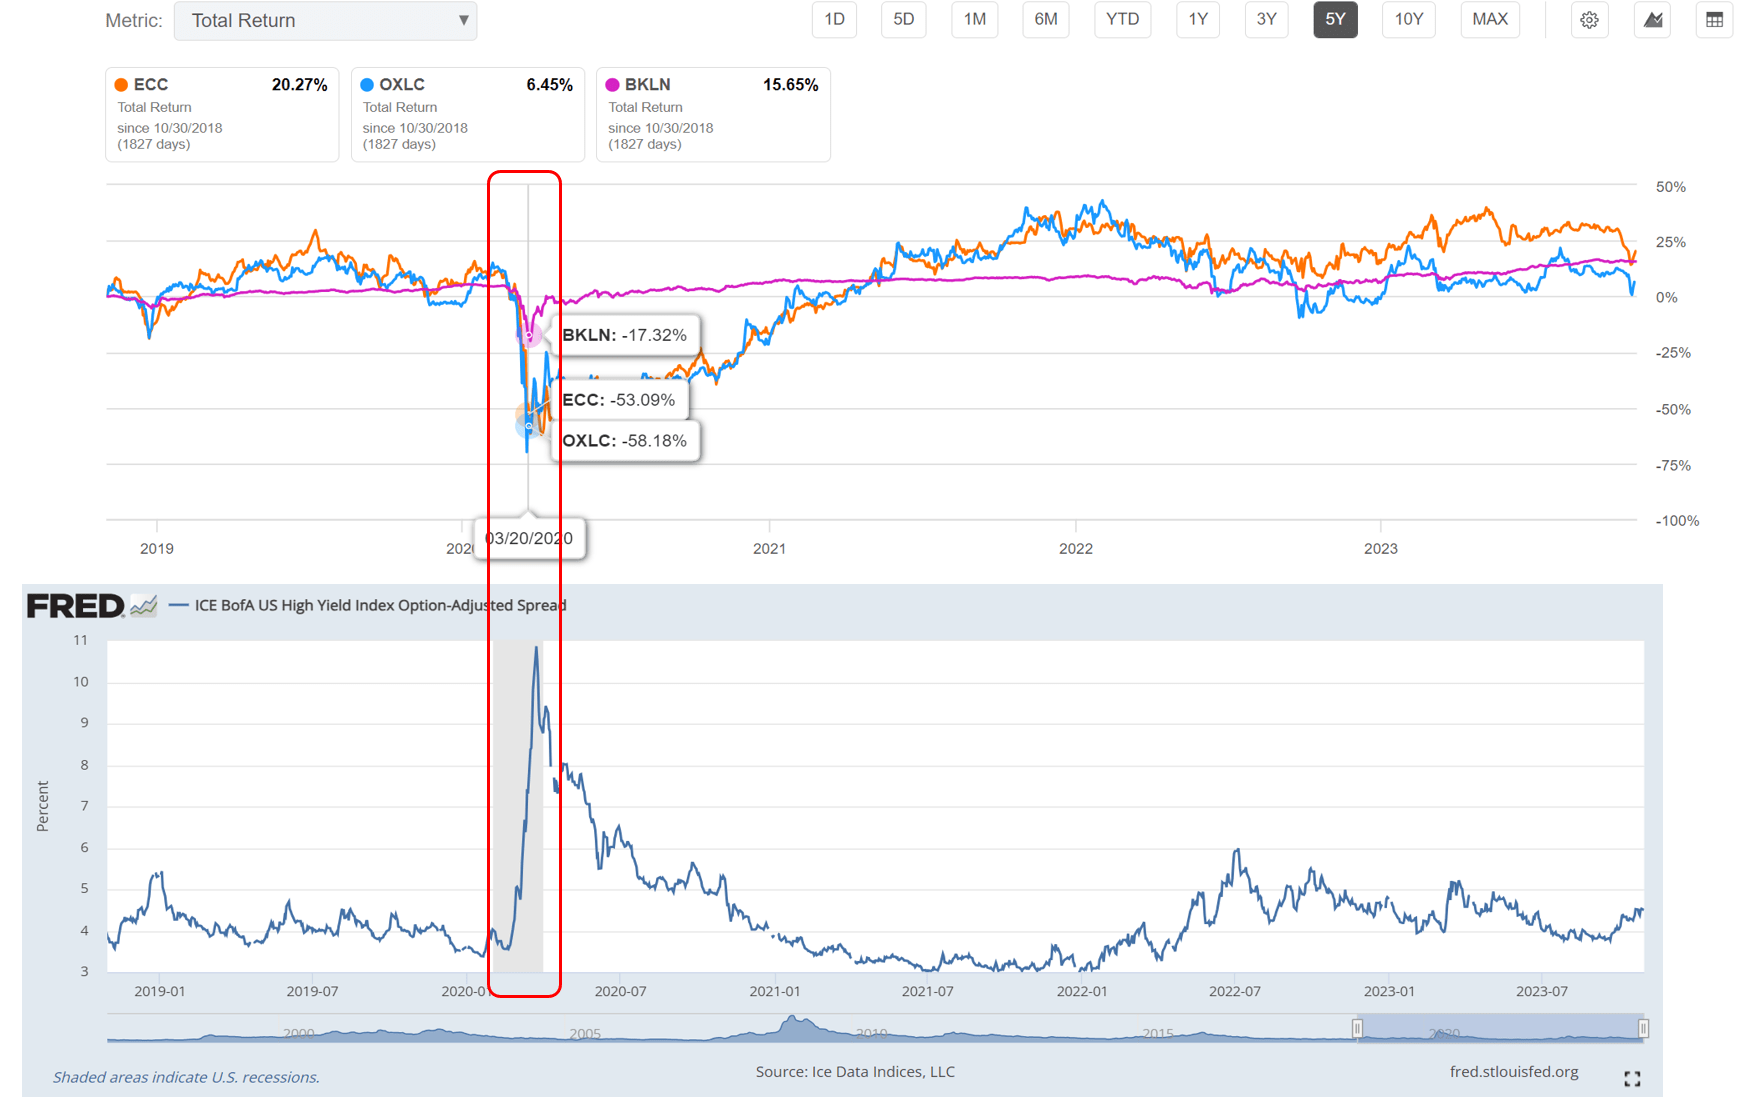
In fact, when viewed in this light, it is no surprise that when credit markets really get in trouble like it did in 2020, CLO equity investments like ECC and OXLC can get wiped out. In March 2020, the BKLN ETF declined by 17% while ECC and OXLC declined by over 50%, or 3x downside leverage (Figure 18).
Figure 18 - ECC and OXLC can get wiped out in a credit event (Seeking Alpha and St. Louis Fed)
The question for investors to decide is whether they are adequately compensated for this credit risk when owning ECC and OXLC.
For me personally, given the heightened default risk cited by Fitch, I am much more inclined to seek quality and would recommend income-seeking investors to consider the safety of the JAAA ETF. I wrote about the JAAA ETF here .
Conclusion
Since my last article on Eagle Point Credit, the ECC fund has essentially tread water, delivering 1% in total returns over the past year. In my opinion, ECC does not earn its distribution yield, as it only delivers 6-8% total returns compared to its 18% distribution.
Looking forward, credit rating agencies like Fitch believe there will be elevated defaults in the leveraged loan space. Given ECC's subordinated position within the CLO structure, forward returns could be very negative if these defaults are realized.
I recommend investors high grade their portfolios and consider investment grade CLO funds like JAAA for high quality attractive yields. I would personally avoid ECC and OXLC.
For further details see:
ECC: Avoid The Riskiest Part Of The CLO Structure (Rating Downgrade)