EPC - Edgewell Personal Care Company Has Gains Near Ahead Says Hedging
2023-05-08 12:44:38 ET
Summary
- Our standard capital gain opportunity-seeking approach is to use the price-range forecasts implied by derivatives markets, the market-making community’s workshop to hedge equity market liquidity trade orders.
- By comparing today’s balance of upside and downside price change prospects with outcome experiences of similar prior forecasts, qualitative comparisons are made, stock by stock, of investing portfolio candidates.
- Ranking the results for over 3,000 stocks and ETFs for each often identifies issues out of the mainstream, like it has again today.
- Answers sought: a) How big a gain; b) How likely to be reached; c) How soon it could happen; d) How much interim loss risk exposure may need to be endured.
- What else is needed? Your standards of acceptance of open-market buyers’ and sellers’ real-money bets on their judgments of the future, once again.
Investment Thesis
Big money moves markets, but not always permanently. With active and evolving communications technology there is almost always TMI - too much information. Some, lacking credibility, can mislead even if that's not the intent.
The sorting key is comparisons. But they must be of like features, ultimately winding up in their impact on coming market prices for specific investment issues.
We find volume trade orders by institutional investors have high credibility, are current, and provide good comparability when viewed through the active screen of derivative securities markets. The specific reasoning behind trade orders does not have to be evident when substantial costs are undertaken to protect market-makers in their implementation when Billion-dollar portfolios are to be adjusted.
It turns out that the limits of coming price change expectations provide dynamic measures of specific stock changes in reward~risk balances, which in turn offer active investment guidance to portfolio management. Guidance which is usually ignored by passive-investing buy & holders.
Today's example is in Edgewell Personal Care Company ( EPC ) .
Description of the Subject Company
"Edgewell Personal Care Company, together with its subsidiaries, manufactures and markets personal care products worldwide. It operates through three segments: Wet Shave, Sun and Skin Care, and Feminine Care. The Wet Shave segment provides razor systems, such as razor handles and refillable blades, and disposable shave products for men and women under the Schick, Wilkinson Sword, Edge, Skintimate, Billie, Shave Guard, and Personna brands. The Sun and Skin Care segment provides general protection, sport, kids, baby, tanning, and after sun products under the Banana Boat and Hawaiian Tropic brands, as well as antibacterial hand wipes, alcohol sanitizing wipes, and other related products under the Wet Ones brand; and skin care products for men under the Bulldog and Jack Black brands, and skin care and grooming products under the Cremo brand. The Feminine Care segment provides tampons under the Playtex Gentle Glide 360°, Playtex Sport, Playtex, and o.b. brands; and markets pads and liners under the Stayfree and Carefree brands. The company was formerly known as Energizer Holdings, Inc. and changed its name to Edgewell Personal Care Company in June 2015. Edgewell Personal Care Company was founded in 1772 and is headquartered in Shelton, Connecticut."
Source: Yahoo Finance
Risk~Reward Comparisons of Personal Care Product Stocks
Figure 1
blockdesk.com
(used with permission)
The tradeoffs here are between near-term upside price gains (green horizontal scale) seen worth protecting against by Market-makers with short positions in each of the stocks, and the prior actual price drawdowns experienced during holdings of those stocks (red vertical scale). Both scales are of percent change from zero to 25%.
The intersection of those coordinates by the numbered positions is identified by the stock symbols in the blue field to the right.
The dotted diagonal line marks the points of equal upside price change forecasts derived from Market-Maker [MM] hedging actions and the actual worst-case price drawdowns from positions that could have been taken following prior MM forecasts like today.
Our principal interest is in EPC at location [2]. A "market index" norm of reward~risk tradeoffs is offered by SPDR S&P500 index ETF at [3].
Those forecasts are implied by the self-protective behaviors of MMs who must usually put firm capital at temporary risk to balance buyer and seller interests in helping big-money portfolio managers make volume adjustments to multi-billion-dollar portfolios. The protective actions taken with real-money bets define daily the extent of likely expected price changes for thousands of stocks and ETFs.
This map is a good starting point, but it can only cover some of the investment characteristics that often should influence an investor's choice of where to put his/her capital to work. The table in Figure 2 covers the above considerations and several others.
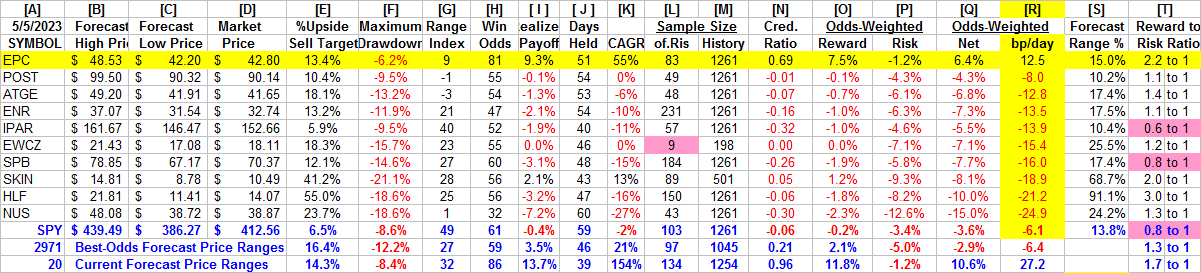
Comparing Alternative Investments
Figure 2
(used with permission)
Column headers for Figure 2 define elements for each row stock whose symbol appears at the left in column [A]. The elements are derived or calculated separately for each stock, based on the specifics of its situation and current-day MM price-range forecasts. Data in red numerals are negative, usually undesirable to "long" holding positions. Table cells with pink background "fills" signify conditions typically unacceptable to "buy" recommendations. Yellow fills are of data for the stock of principal interest and of all issues at the ranking column, [R].
Readers familiar with our analysis methods may wish to skip to the next section viewing price range forecast trends for EPC.
Figure 2's purpose is to attempt universally comparable answers, stock by stock, of a) How BIG the price gain payoff may be, b) how LIKELY the payoff will be a profitable experience, c) how soon it may happen, and d) what price drawdown RISK may be encountered during its holding period.
The price-range forecast limits of columns [B] and [C] get defined by MM hedging actions to protect firm capital required to be put at risk of price changes from volume trade orders placed by big-$ "institutional" clients.
[E] measures potential upside risks for MM short positions created to fill such orders, and reward potentials for the buy-side positions so created. Prior forecasts like the present provide a history of relevant price draw-down risks for buyers. The most severe ones actually encountered are in [F], during holding periods in an effort to reach [E] gains. Those are where buyers are most likely to accept losses.
[H] tells what proportion of the [L] sample of prior like forecasts have earned gains by either having price reach its [B] target or be above its [D] entry cost at the end of a 3-month max-patience holding period limit. [ I ] gives the net gains-losses of those [L] experiences and [N] suggests how credible [E] may be compared to [ I ].
Further Reward~Risk tradeoffs involve using the [H] odds for gains with the 100 - H loss odds as weights for N-conditioned [E] and for [F], for a combined-return score [Q]. The typical position holding period [J] on [Q] provides a figure of merit [ fom ] ranking measure [R] useful in portfolio position preferencing. Figure 2 is row-ranked on [R] among candidate securities, with EPC in top rank.
This selection of equity near-term investment stocks is unusually non-competitive, save for the featured stock, EPC. That stock has survived since its founding in 1777. Its principal effective competitor, Gillette, is privately owned.
Along with the candidate-specific stocks these selection considerations are provided for the averages of nearly 3000 stocks for which MM price-range forecasts are available today, and 20 of the best-ranked (by fom ) of those forecasts, as well as the forecast for S&P500 Index ETF ( SPY ) as an equity market proxy.
Both that population of forecast stocks and the market index SPY currently have unattractive forecast averages. The population's 20 best show that rigorous selection can identify promising and productive equity investments most times.
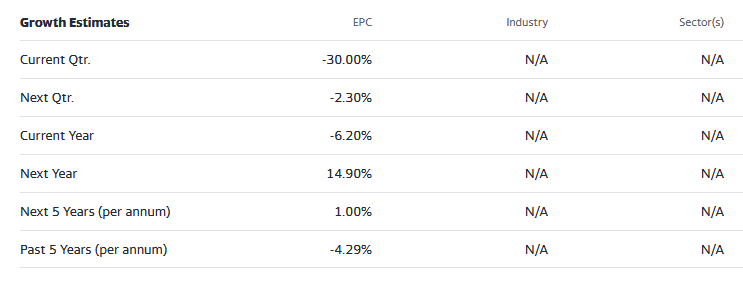
Recent Trends in MM Price-Range Forecasts for EPC
Figure 3
blockdesk.com
(used with permission)
This picture is not a "technical chart" of past prices for EPC. Instead, it is the past 6 months of daily price range forecasts of market actions yet to come in the next few months. The only past information there is the closing stock price on the day of each forecast.
That data splits the price range's opposite forecasts into upside and downside prospects. Their trends over time provide additional insights into coming potentials, and helps keep perspective on what may be ahead.
The small picture at the bottom of Figure 3 is a frequency distribution of the Range Index's appearance daily during the past 5 years of daily forecasts. The Range Index [RI] tells how much the downside of the forecast range occupies that percentage of the entire range each day, and its frequency suggests what may seem "normal" for that stock, in the expectations of its evaluators' eyes.
Here the present level of 9 is near its least frequent, lowest-cost presence, encouraging the acceptance that we are looking at a realistic evaluation for EPC. With nearly all past RIs above the present RI than below there is ample room for an even more positive outlook.
Conclusion
Among these alternative investments explicitly compared, Edgewell Personal Care Company appears to be a logical buy preference now for investors seeking near-term capital gain.
For further details see:
Edgewell Personal Care Company Has Gains Near Ahead Says Hedging