IEMG - EDIV ETF: A Mixed Perspective
2024-01-05 11:21:06 ET
Summary
- The SPDR S&P Emerging Markets Dividend ETF has outperformed US and global markets, delivering 40% returns over the past year.
- Yet, EDIV's multi-pronged screening process for selecting stocks has not translated into long-term alpha.
- Despite the strong growth landscape for emerging markets in 2024, EDIV is priced at a discount and could benefit from some mean-reversion given the dollar's prospects.
- The risk-reward on the EDIV's long-term chart looks unappealing.
Introduction
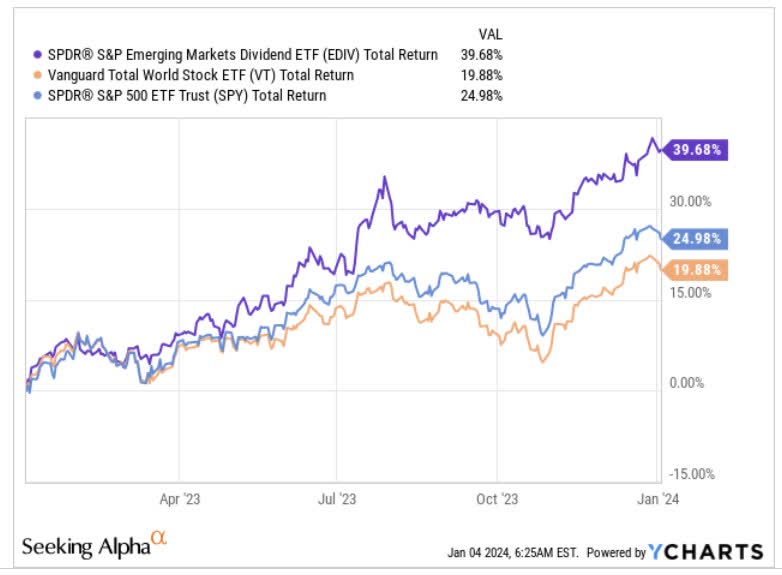
The SPDR S&P Emerging Markets Dividend ETF (EDIV), a $350m sized product that focuses on 100 emerging market stocks has performed impressively over the past year, delivering returns of 40%, and consequently also outperforming both the US markets (by 1.6x), and the global markets (2x) during this period.
We are conflicted about the prospects of further outperformance, but nonetheless, here's a discussion of some of the important themes associated with the EDIV product.
EDIV: Multi-Pronged Screening Hasn't Translated To Long-Term Alpha
EDIV tracks the S&P Emerging Markets Dividend Opportunities Index, and the stocks that eventually make it to the final list are put through quite a few tests. Prima facie, helps bring a degree of reassurance to the quality of stock picking, but the end results show that it hasn't been good enough.
So coming back to the screening, EDIV's prospective EM stocks are first measured under four criteria- a) profitability, b) dividend growth, c), dividend coverage, and d) dividend yield).
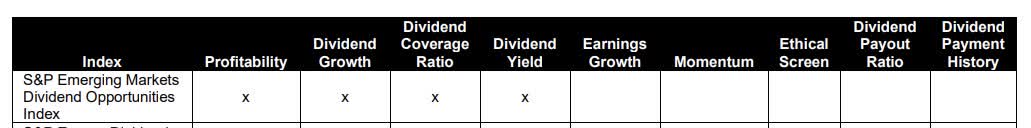
Firstly, it helps that EDIV isn't picking dividend-paying stocks that don't generate earnings, but we would have liked to have seen a longer track record. Rather, EDIV's tracking index necessitates a positive EPS track record only over the most recent 12 months.
As far as the dividend growth is concerned, new stocks are required to demonstrate a stable or 3-year track record of increasing dividend growth, however, existing stocks are not penalized if dividend growth declines are less than 5% over a 3-year period.
The Dividend Coverage screener that EDIV employs deserves some credit as they are not looking for the coverage of dividends by the EPS but rather by the funds from operation (per share) which is cash-flow oriented and a much better gauge of coverage.
EDIV also uses a dividend yield screener, which eradicates special or extraordinary dividends.
Once all these screeners are levied, the stocks are then sorted by a Risk-adjusted Yield ((RAY)) which measures the current yield relative to the volatility of the monthly yield over the last three years.
Eventually, the stocks are weighted based on the TTM (Trailing Twelve month) dividend yield.
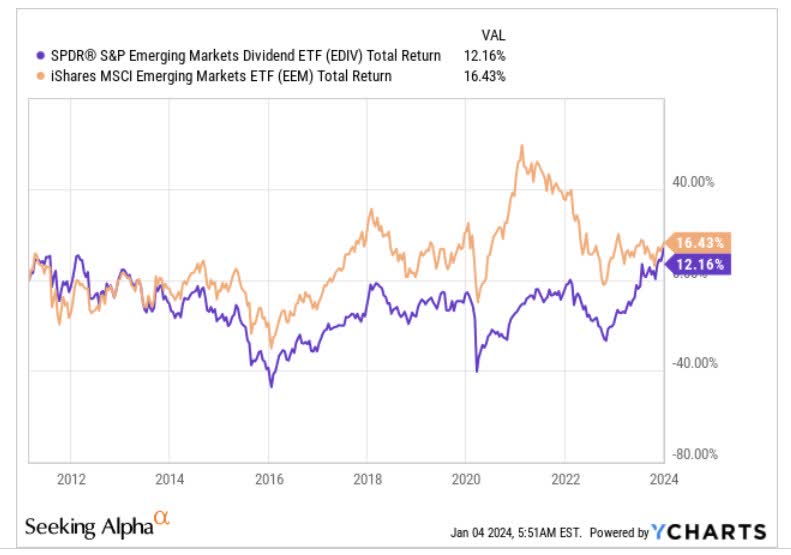
EDIV deserves credit for not just blindly lapping up EM stocks with just a high yield or just a single year's dividend growth track record. However, it must be noted that this elaborate screening hasn't quite translated to ample total returns. The image below shows that since its inception in 2011, EDIV has underperformed the plain vanilla - EEM ETF, although that gap has narrowed off late.
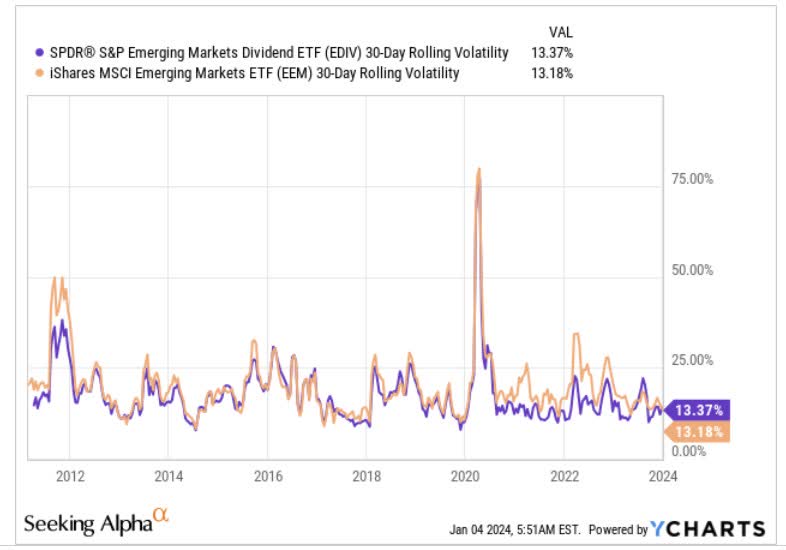
Surprisingly also note that despite emphasizing dividend-oriented stocks (which are perceived to be low risk) with good fundamentals, there hasn't been a meaningful difference in the risk profile of the two products.
Investment Case For Emerging Markets
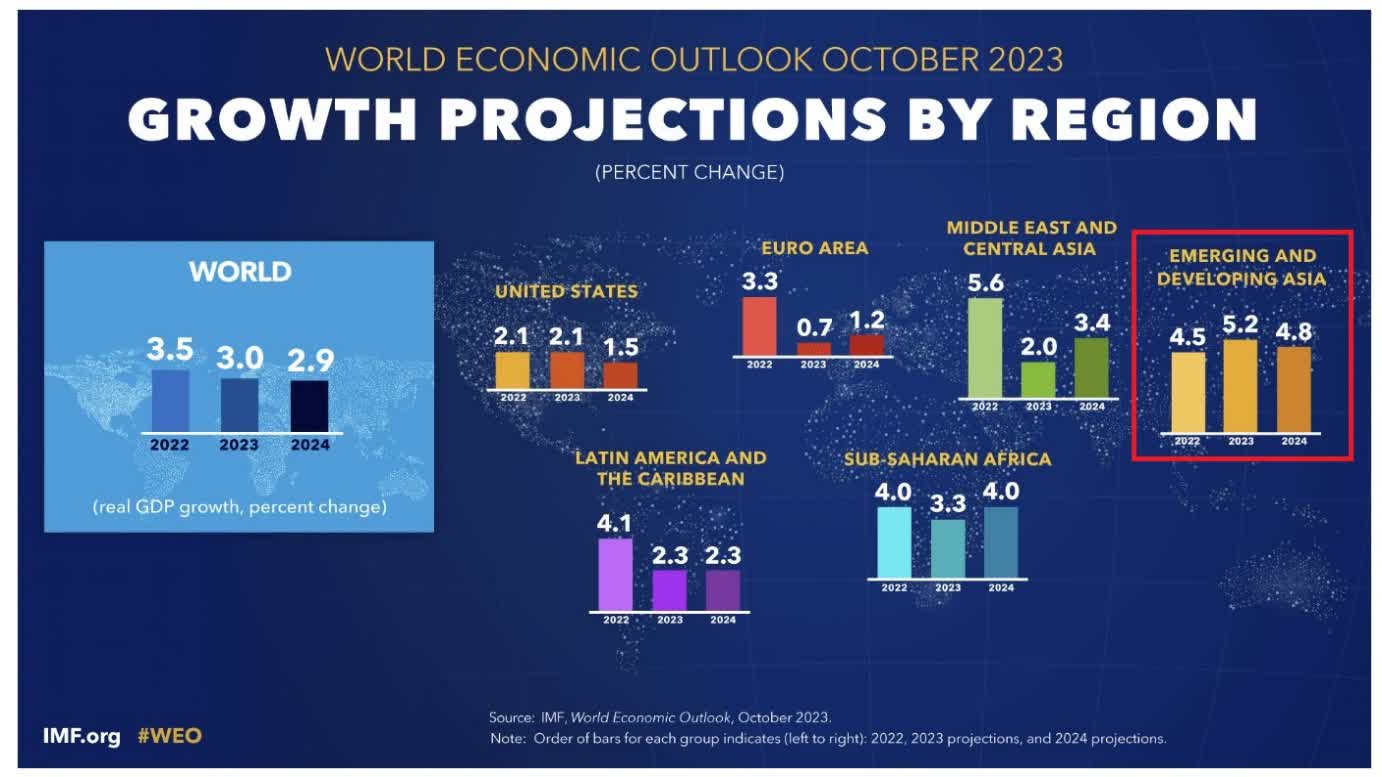
The growth landscape for emerging markets in 2024 looks a lot more resilient than other regions across the world, and this holds particularly true for emerging Asian stocks which account for a whopping ~84% of EDIV's total portfolio.
According to the IMF's forecasts for 2024, emerging and developing Asia will likely deliver 4.8% GDP growth, over 200bps better than the expected growth rate for the whole globe.
In light of the superior growth landscape, one would've thought that the Asia Pac-oriented EDIV would be priced at a premium valuation multiple, but that is hardly the case. Data from Morningstar show that EDIV is priced at only 9.2 P/E, a mammoth 40% discount to the corresponding multiple of the Vanguard Total World Stock ETF (VT). Given EDIV's tilt towards dividend-paying stocks, the value quotient also burns bright when juxtaposed against the most popular EM product - the iShares Core MSCI Emerging Markets ETF (IEMG) which is priced at 11.6x .
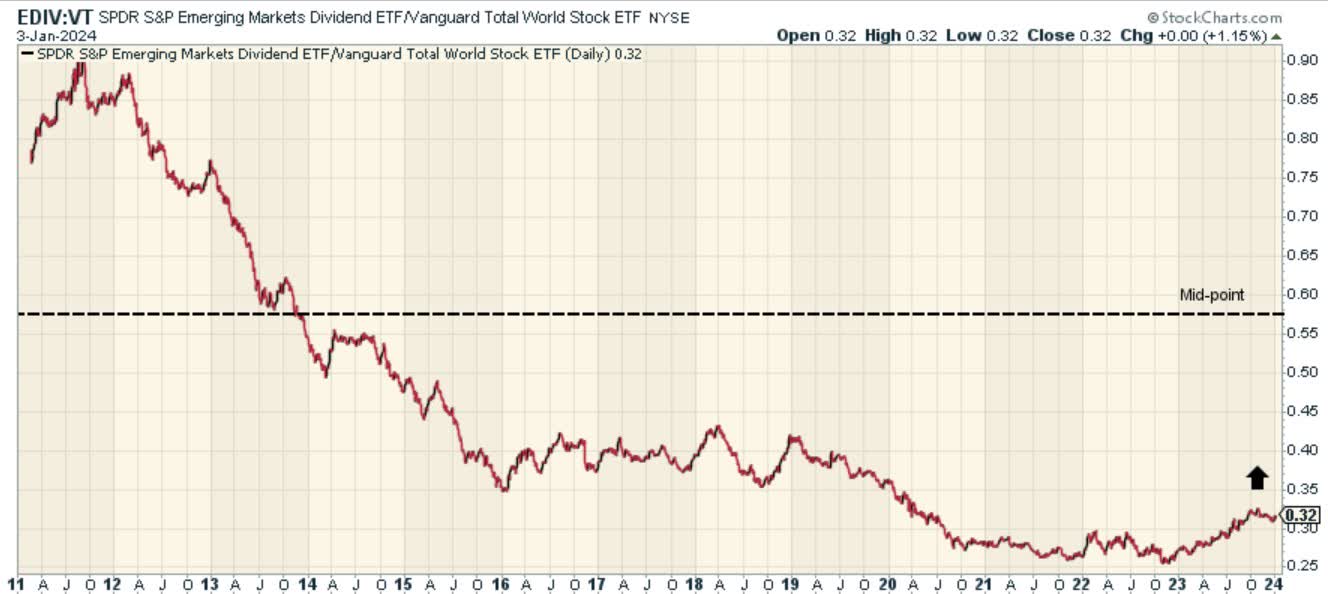
The relative strength charts, which help identify pockets of mean-reversion in global markets, also suggest that EDIV's portfolio of EM stocks look like ripe candidates. The current relative strength ratio looks rather oversold and is trading a good 44% off the mid-point of the long-term range.
EM countries and stocks also typically use a significant component of foreign currency debt to support their growth ambitions, and in that regard, it helps that bullish conditions for the US dollar appeared to have gone sour.
With the Fed now expected to cut rates half a dozen times in 2024, the dollar's allure will likely dim going forward. A lower interest bill could result in better earnings drop-throughs, with the prospect of some re-rating on the cards.
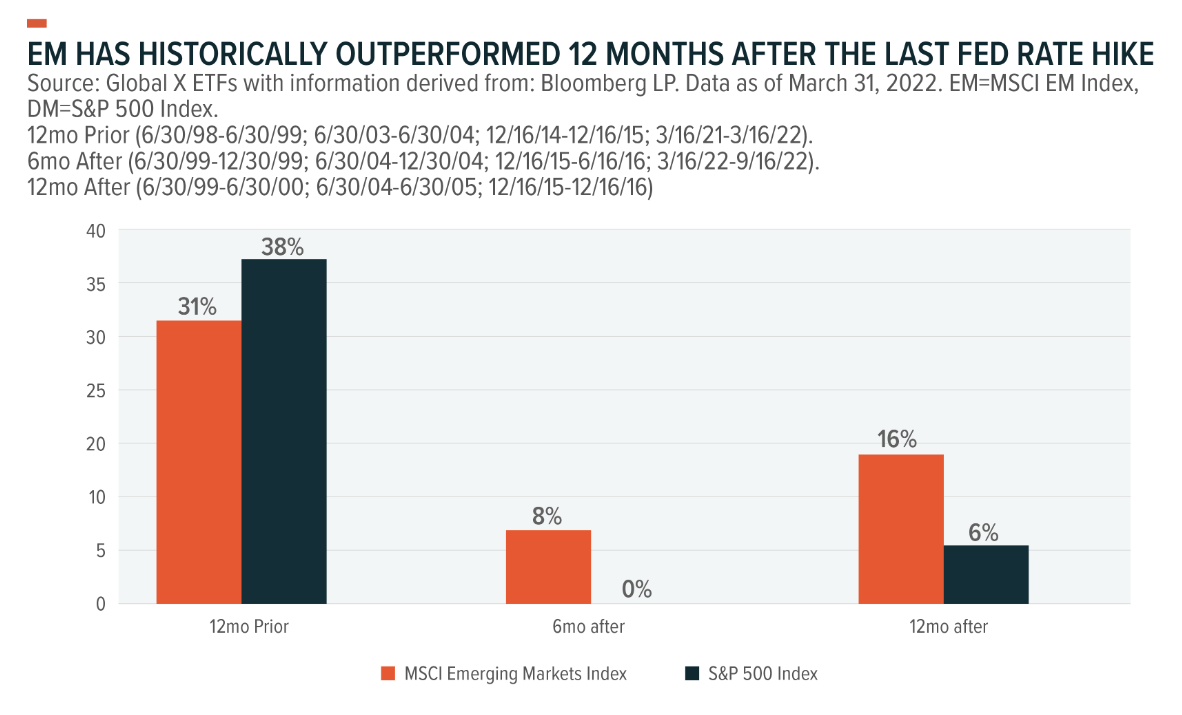
In fact, if one is to go by past studies, the results have shown that EM equities have outperformed domestic stocks six months after the last fed rate hike.
EDIV's top sector exposure is towards financial stocks (a quarter of the total holdings), and even here the outlook for FY24 looks rather resilient. Strong economic growth should provide ample support for the banks to grow their asset base, and the likely strong growth of loans should also help cushion the NPL ratio ( Fitch Ratings anyway believes that there will only be modest loan deterioration with Asia Pacific banks).
Closing Thoughts - Dividend and Technicals
A lot of EM-oriented investors are enthused by EDIV's dividend narrative, with a current yield of well over 4% (4.32%). However historically we've seen that Q4 and Q1 witness the weakest payouts, and after doling out only $0.0522 a share last month, we think the March payout could be underwhelming as well, implying further downside risks to that yield.
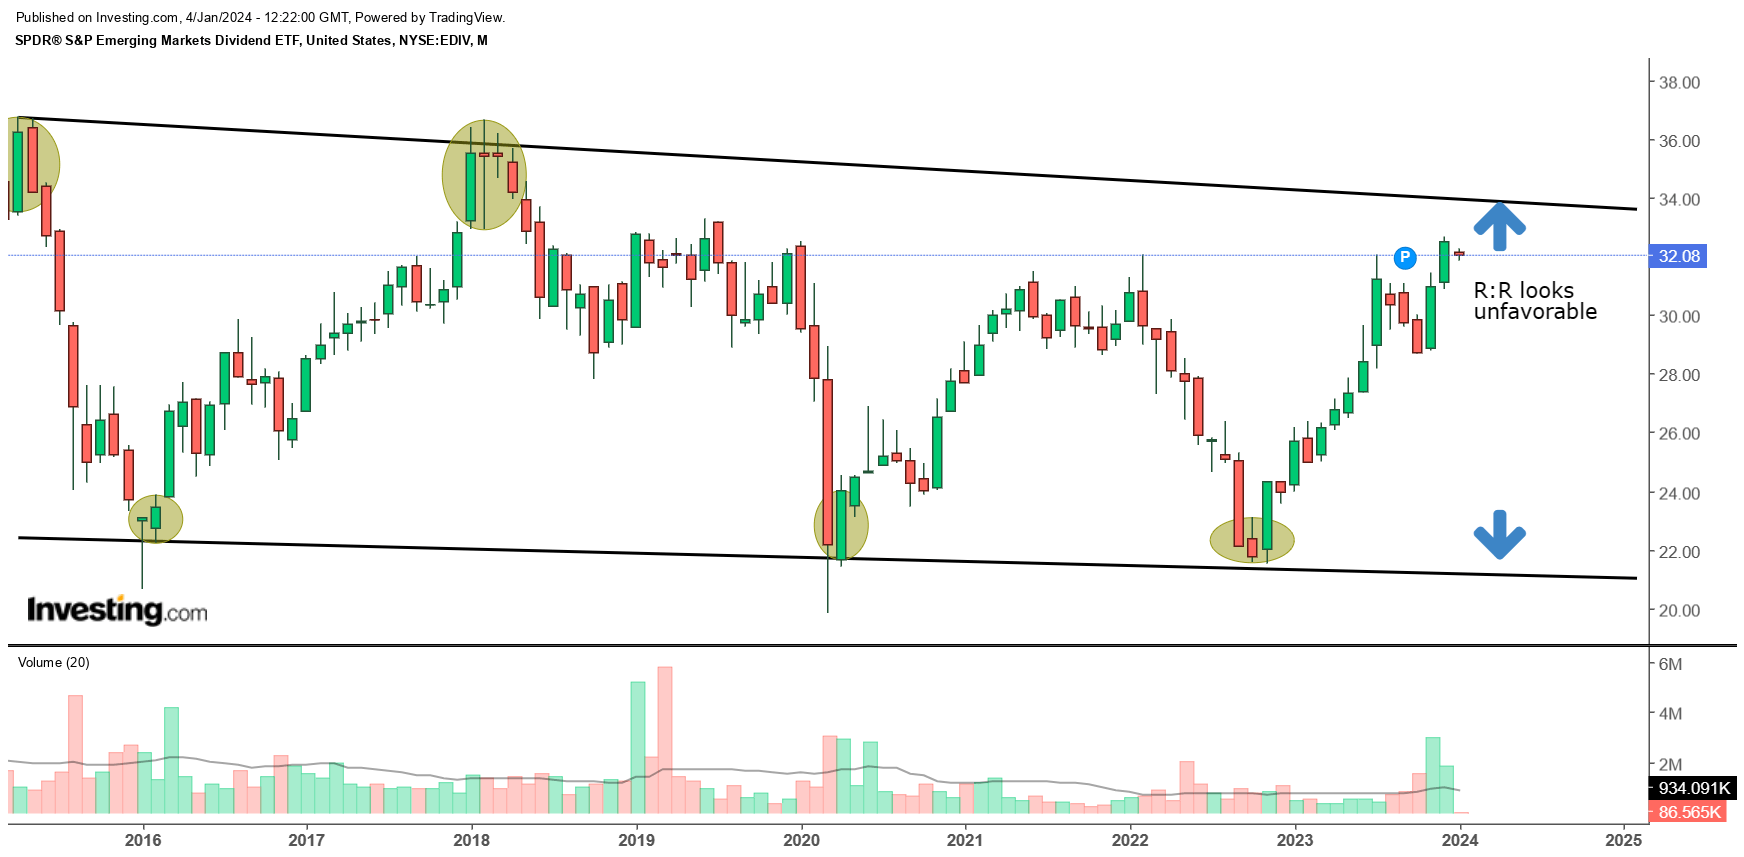
Then, if we consider EDIV's long-term price imprints on the monthly chart, we can see that this ETF hasn't really gone anywhere since 2015, but has rather chopped around within a certain range. We've demarked this range, drawing an upper and lower boundary. We can see that whenever the price hits those boundaries, we see a pivot from there. Now, after a relatively strong uptrend that commenced in November 2022, the price is not too far from hitting the upper boundary of the trading range. Given the unappealing reward to risk dynamics at current prices, we would be inclined to go with a HOLD rating.
For further details see:
EDIV ETF: A Mixed Perspective