SPEM - EEM: Valuation Not Expensive But Exposure To China Not Favorable
2023-11-08 04:54:39 ET
Summary
- iShares MSCI Emerging Markets ETF has not performed well since 2021, losing over 33% of its value since early 2021.
- EEM has an expensive expense ratio of 0.69% compared to other international market-focused ETFs with lower expense ratios.
- While EEM's valuation based on the Buffett Indicator appears reasonable, its high exposure to China and the country's weakening fundamentals raise concerns.
Introduction
We wrote an article about iShares MSCI Emerging Markets ETF (EEM) back in April 2020. At that time we advised investors to invest in developed markets rather than emerging markets as economies in emerging markets are much more vulnerable during lockdowns than developed market. It has been about 3.5 years since we have written the article, and we think it is time to analyze EEM again and provide our updated analysis and recommendations.
ETF Overview
EEM invests in about 1,400 stocks in 24 emerging markets. Its valuation is reasonable based on the Buffett Indicator. However, the fund's expense ratio is expensive relative to its peers. Its long-term performance also trailed the S&P 500 index. In addition, its high exposure to China is also concerning. Therefore, we think investors may want to seek other alternatives instead.
YCharts
Fund Analysis
EEM has not performed well since 2021
EEM delivered strong performance in 2020 following the sharp decline during the outbreak of the pandemic. As can be seen from the chart below, the fund has quickly reached its peak in early 2021. Unfortunately, this strong performance did not last long. EEM started to decline for the rest of the year. This decline accelerated in 2022 as many central banks around the world raised rates aggressively to combat inflation. In summary, EEM lost over 33% of its value since the peak reached in early 2021.
YCharts
Expense ratio not attractive
Investors considering investing in EEM need to be aware of its expensive expense ratio of 0.69%. Other ETFs that focus on international markets such as SPDR Portfolio Emerging Markets ETF ( SPEM ) and Vanguard FTSE All-World ex-US ETF ( VEU ) have expense ratios of only 0.07% and 0.08% respectively. Therefore, EEM's expense ratio is expensive. EEM's high expense ratio has negatively impacted its total performance in the long run. As can be seen from the chart below, EEM's total performance of 15.9% in the past 10 years significantly trailed SPEM's 33.9% and VEU's 42.2%.
YCharts
Valuation not expensive based on Buffett Indicator
A good method to evaluate whether EEM is expensive or not is to look at the valuations of major markets in its portfolio. One way to measure the valuation of each individual market is to use the Buffett Indicator.
So, what exactly is the Buffett Indicator? According to Warren Buffett, one can evaluate whether the broader stock market is overvalued or not by checking the total market capitalization to GDP ratio. If this ratio is below 75%, the market valuation is cheap. If it is within the range of 75% to 90%, the market valuation is fair. If this ratio is above 90%, the market is expensive. This method to evaluate the valuation of the market is called the Buffett Indicator.
Since many central banks around the world have expanded their balance sheets significantly, this indicator should be revised to better reflect the effect of monetary policies on these markets. Therefore, the denominator needs to include the assets of the central bank. As such, the revised Buffett Indicator becomes total market capitalization to (GDP + assets).
Below is a table that shows this revised Buffett Indicator in the top 4 countries in EEM's portfolio. Excluding Taiwan, which we do not have the data, the rest 3 countries represent about 57.5% of EEM's total portfolio. This should help us gauge the valuation of EEM. As can be seen from the table, China's total market capitalization to GDP and total asset ratio is currently 43.2%. This is way below the fairly valued range of 75% to 90%. Therefore, China's stock market is quite cheap. India, which represents about 15.3% of EEM's portfolio has a ratio of 85.7%. Therefore, India's stock market appears to be fairly valued. Just like China, South Korea's ratio of 74.2% is only slightly below the fair valuation range. Therefore, it appears that EEM is not expensive.
| Buffett Indicator: TMC/(GDP + TA) Ratio |
| EEM's Exposure |
| China |
| 43.22% |
| 29.55% |
| India |
| 85.68% |
| 15.28% |
| Taiwan |
| N/A |
| 14.95% |
| South Korea |
| 74.16% |
| 12.74% |
Source: iShares, GuruFocus.com
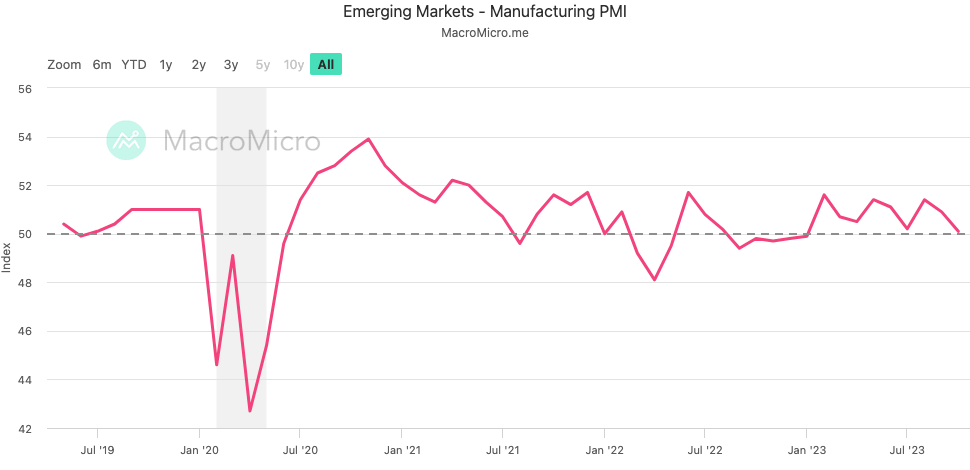
Manufacturing PMI remains weak
Let us now look at an important forward indicator, the manufacturing PMI data for emerging markets. The reason we look at manufacturing PMI rather than services PMI is because manufacturing sectors typically represent a much bigger component in the emerging market GDPs than services sectors. As can be seen from the chart below, emerging markets manufacturing PMI has recovered from the low reached in 2020 but still appeared quite weak. For reader's information, a reading below 50 suggests that the economy may be heading for contraction. Its current PMI of 50.1 suggests that future economic expansion will remain quite weak at least in the near-term.
Reasons why we think investors should remain cautious
Despite EEM's reasonable valuation, we think investors should remain cautious for the following two reasons:
EEM unable to match the performance of the S&P 500 in the long run
Although emerging markets are often perceived as higher growth markets than developed markets, these markets typically are unable to match the performance of the S&P 500 index in the long run. In addition, these markets often have higher risks than U.S. stocks. As can be seen from the chart below, EEM's total return in the past 10 years was only 13.8%. This has already included the dividends. If not counting the dividends accumulated, the price return was negative 6.2%. In contrast, the S&P 500 index delivered a total return of 195.3% in the past 10 years. For investors wanting some exposure internationally, the S&P 500 index should be enough as most of the stocks in the index has sizable international revenues and earnings. There is little reason to own a separate emerging market fund.
YCharts
EEM has a high exposure to China
Another reason we think investors need to remain cautious is due to EEM's exposure to China. In fact, stocks from China represents 29.6% of its total portfolio. Although China's economy has enjoyed very strong growth in the past few decades, the tide has clearly turned the other way. Here, we will provide a few facts. First, China's population is aging and declining. This will hurt its long-term GDP growth as consumer spending growth will inevitably slowdown. Second, tensions between China and the U.S. have caused many companies to de-risk, reorganize its supply chain and move factories out of China. This has caused higher unemployment rate in China and result in a weakening Chinese economy. Third, China's government policy is often unpredictable and unrealistic. For example, China's insistence on a zero-covid policy last year was unrealistic and caused damages to its economy. Fourth, China's housing market bubble appears to be bursting. As can be seen from the chart below, housing starts in China has clearly peaked in 2019/2020 and is now in a declining trend. Since housing sector represents a large chunk of China's GDP, a housing market bubble will hurt its long-term GDP growth in the long run.
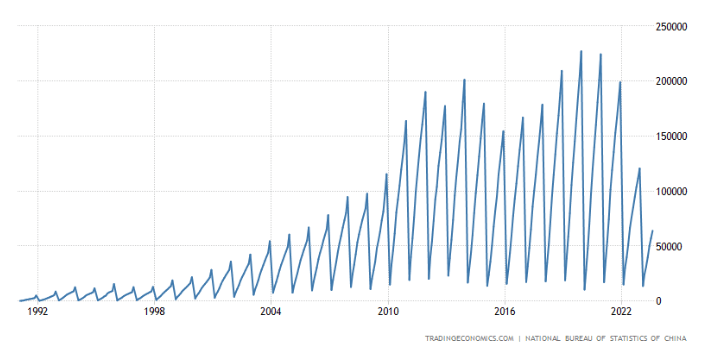
Investor Takeaway
EEM's valuation appears reasonable based on the Buffett Indicator. However, we are concerned about China's weakening fundamental and uncertain government policy. Therefore, we think investors should seek other alternatives.
For further details see:
EEM: Valuation Not Expensive, But Exposure To China Not Favorable