EEMS - EEMS Vs. FEMS: Comparing Small-Cap Emerging Market Equity ETFs
Summary
- The iShares MSCI Emerging Markets Small-Cap ETF invests based on the MSCI Emerging Markets Small Cap Index.
- The First Trust Emerging Markets Small Cap AlphaDEX ETF invests based on the NASDAQ AlphaDEX Emerging Markets Small Cap Index.
- Both ETFs and their respective index are reviewed to see how the underlying index can drive the results. There are both country and sector allocation differences that can effect performance.
- For investors looking to add exposure in EM SC stocks, FEMS has treated investors better. I also compare its return/risk results against an unrestricted EM ETF and an International DM ETF. Looks good there too.
(This article was co-produced with Hoya Capital Real Estate )
Introduction
Emerging Markets stocks are considered riskier than US or other Developed-Market stocks. Small-Caps are considered risker than both Large-Cap and Mid-Cap stocks. These two ETFs combined both of those risker categories into their investment strategy. Here I will explore how that has worked for these ETFs:
- iShares MSCI Emerging Markets Small-Cap ETF ( EEMS )
- First Trust Emerging Markets Small Cap AlphaDEX ETF ( FEMS )
First, I review my statement about risk by looking at the history I found.
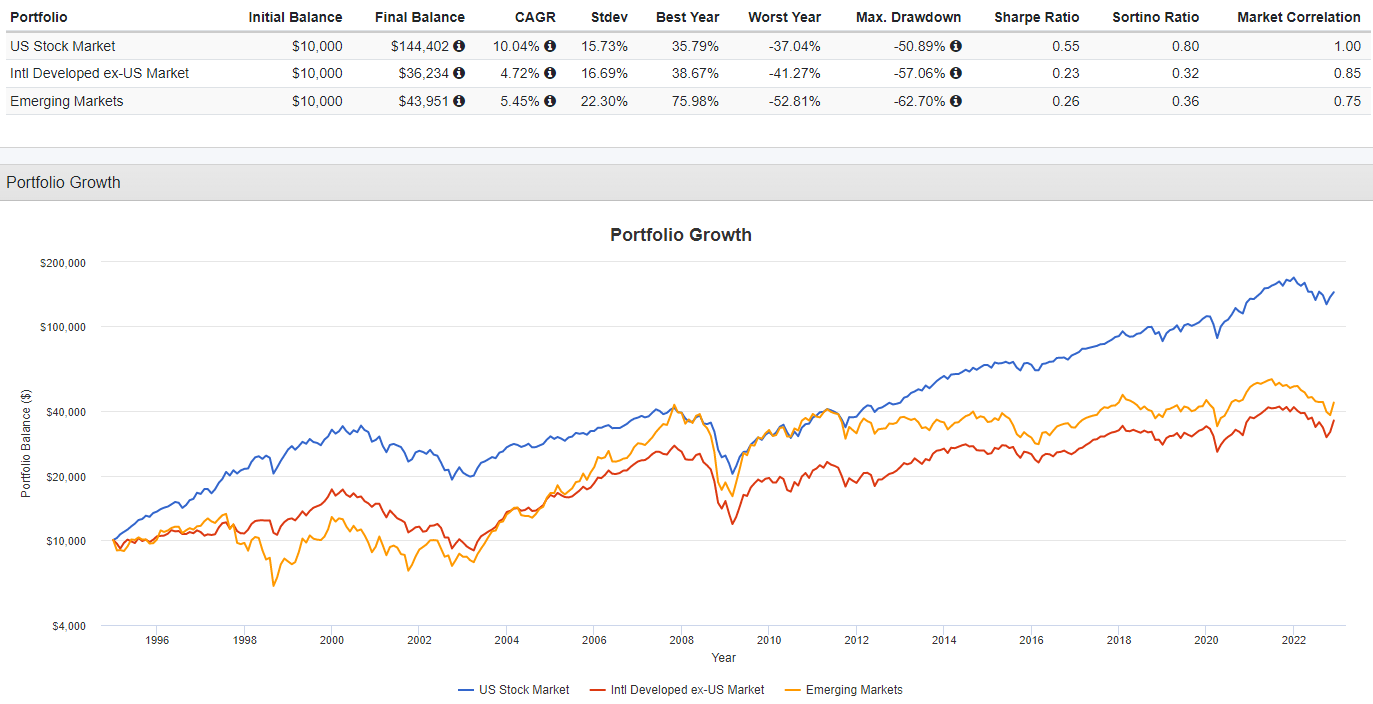
Since 1995, EM stocks have had the highest StdDev between the three classes of stocks when looking at all market-caps. It should be noted that EM stocks have outperformed the International Developed Markets ones, even accounting for the extra risk.
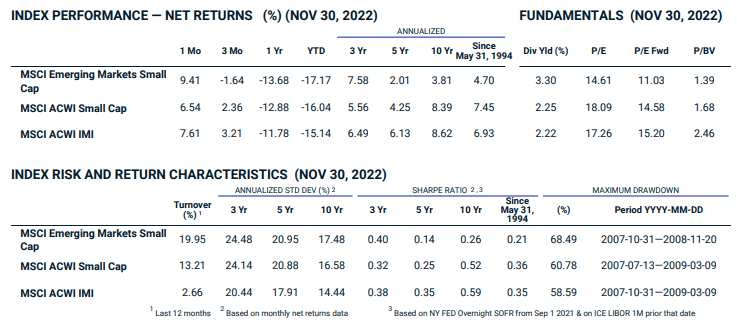
Using MSCI Index data confirms that Small-Cap stocks have a higher StdDev than all worldwide stocks, and most times, more than worldwide Small-Cap stocks. Their Sharpe ratio is the worst across time periods shown though.
iShares MSCI Emerging Markets Small-Cap ETF review
Seeking Alpha describes this ETF as:
The iShares MSCI Emerging Markets Small-Cap ETF is managed by BlackRock Fund Advisors. It invests in public equity markets of global emerging region. It invests in stocks of companies operating across diversified sectors. The fund invests in growth and value stocks of small-cap companies. It seeks to track the performance of the MSCI Emerging Markets Small Cap Index. EEMS started in 2011.
EEMS has $375m in assets and comes with 68bps in fees. Income seekers won’t be happy as the yield is only 1%! That’s a fraction of the historical yield from the other ETF reviewed here.
Exploring the Index
The MSCI Emerging Markets Small Cap Index includes small cap representation across 24 Emerging Markets countries. With 1,821 constituents, the index covers approximately 14% of the free float-adjusted market capitalization in each country. The small cap segment tends to capture more local economic and sector characteristics relative to larger Emerging Markets capitalization segments.
Source: msci.com/documents
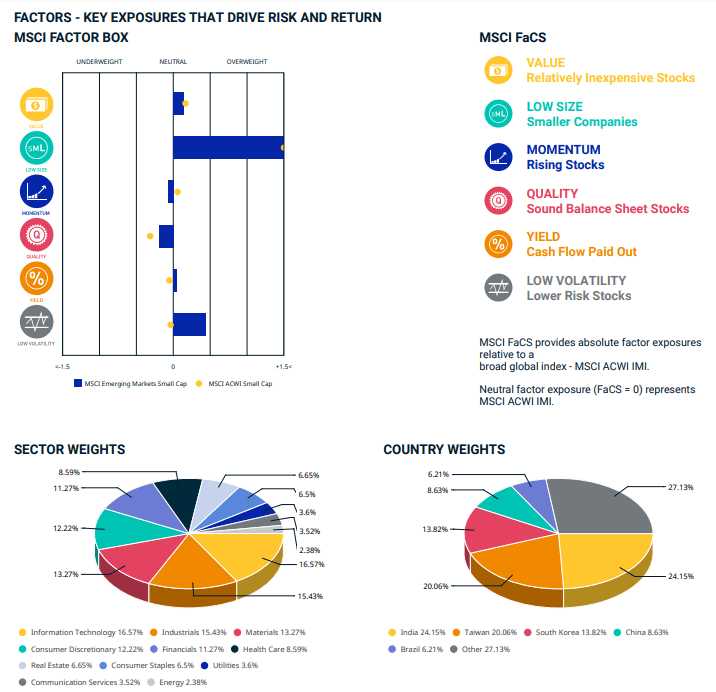
The same PDF provides the following details. I understand the overweighting in smaller stocks, that's the focus, and I even understand the below-average Quality score: I am lost, based on the above data, how this Index scores above-average on Low Volatility since it has a higher StdDev.
It is important to note that the Index includes South Korea. Unlike other index provides, like FTSE, MSCI still classifies that country as Emerging, not Developed.
EEMS holdings review
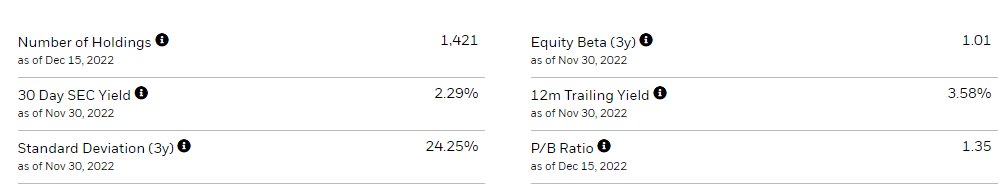
iShares provides some basic data about the portfolio.
Both of the above stated yields far exceed what Seeking Alpha shows, revealing any number requires knowing how it is calculated. Sector allocations are:
ishares.com; compiled by Author
While not a dominate sector, Information Technology is still on top. Unlike many EM ETFS, Financials are not in the top two sectors, here placing fifth.
ishares.com; compiled by Author
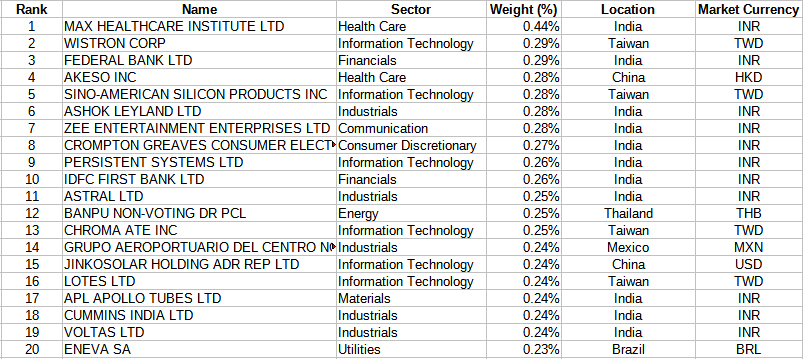
This equates to 78% in Asia and 12% in the Middle East/Africa region. That leave little exposure to Europe or the Western Hemisphere. The only currency hedge in place was against the Taiwan Dollar. The top holding (.97%) is a USD Cash fund. The next 20 holdings, which comprise 5.35% of the portfolio are:
ishares.com; compiled by Author
Sometimes, even with hundreds of stocks held, a few have a large percentage; that is not the case with EEMS.
EEMS distribution review
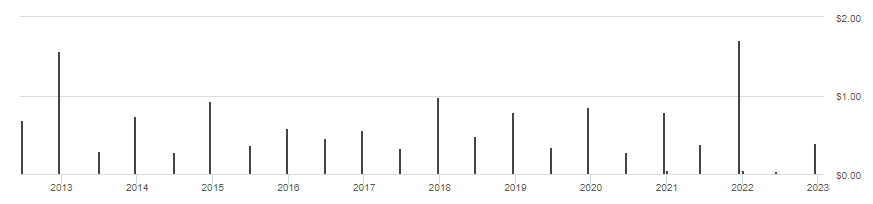
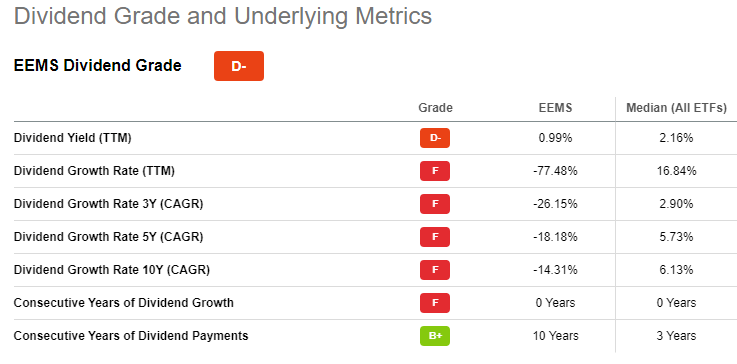
Typical of international funds, the year-end payment is bigger. Also note, payments are only semi-annual, not quarterly. Seeking Alpha grades their payout history with a "D-".
seekingalpha.com EEMS scorecard
First Trust Emerging Markets Small Cap AlphaDEX ETF review
Seeking Alpha describes this ETF as:
The investment seeks investment results that correspond generally to the price and yield of an equity index called the NASDAQ AlphaDEX® Emerging Markets Small Cap Index. The index is designed to select stocks from the NASDAQ Emerging Markets Index (the "base index") that may generate positive alpha, or risk-adjusted returns, relative to traditional indices through the use of the AlphaDEX® selection methodology. FEMS started in 2012.
FEMS has $138m in AUM and currently yields 6.6%. The managers charge 80bps in fees. Despite its superior yield and overall performance, the AUM is a fraction of the other ETF reviewed.
Exploring the Index
The Index managers provide the following insights into their index:
The Nasdaq AlphaDEX® Emerging Markets Small Cap Index employs the AlphaDEX® security selection methodology to select and weight securities from the Nasdaq Emerging Markets Index. The Index is constructed by ranking securities in the Nasdaq Emerging Markets Index separately on growth and value factors.
Source: indexes.nasdaqomx.com Index PDF
Important points listed in the Index PDF include:
- A security must be included in the Nasdaq Emerging Markets Index as of the Reconstitution Reference Date.
- If an issuer has multiple listed security classes, the security with the highest median liquidity generally is considered.
- A security must have a consolidated market capitalization less than the mid-cap breakpoint (50th percentile) and greater than the small-cap breakpoint (90th percentile), as determined by Nasdaq.
- The Index Reconstitution is conducted semi-annually in April and October.
- Constituent selection factors:
- The growth factors used for ranking eligible securities are:
- 3-, 6- and 12-month price appreciation
- sales to price ratio
- 1-year sales growth
- The value factors used for ranking eligible securities are:
- book value to price ratio
- cash flow to price ratio
- return on assets
- The growth factors used for ranking eligible securities are:
After an 11 step constituent selection and weighting process, the Index applies a modified equal-weight process, for which there is another PDF .
FEMS holdings review
The mangers provided a few essential data points related to the portfolio.
ftportfolios.com
The most recent sector allocations is presented next.
ftportfolios.com
Materials as the top sector helps explain recent performance as that sector has performed well in this worldwide inflationary environment. Notice Financials near the bottom; hopefully this also shows the index weighting rules are well designed.
ftportfolios.com
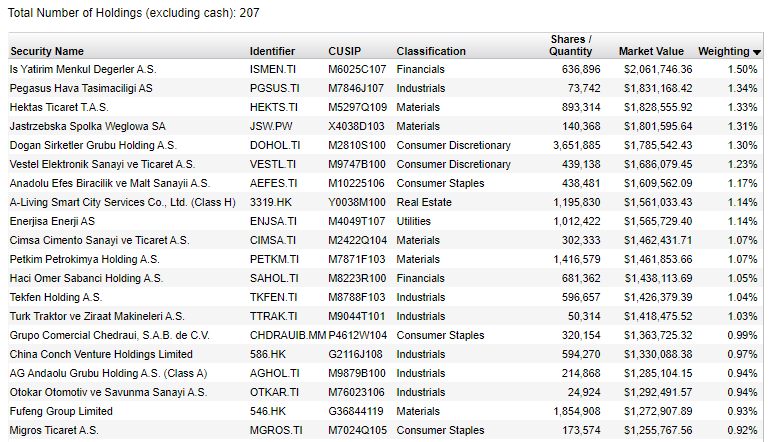
FEMS seems to have a lower number of countries in its portfolio as the above cover 94% of the holdings. With 23% in Turkey, they are making a large bet on a country that might not be the most stable in the world. Even with no South Korea exposure, the portfolio is over 50% in Asia.
Top 20 holdings
FEMS is much more concentrated in its stock holdings too, with the above accounting for over 22% of the portfolio.
FEMS distribution review
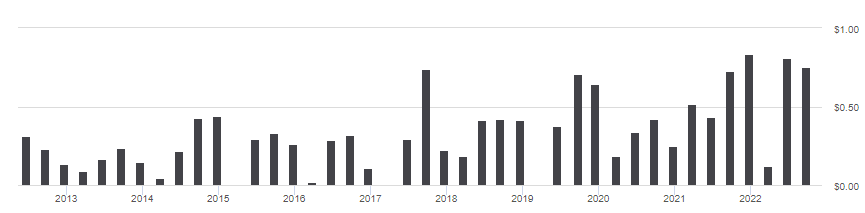
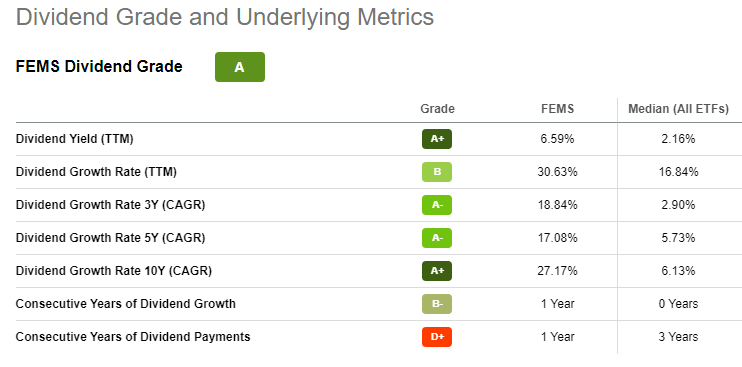
FEMS does pay quarterly but I do not see any clear pattern of year-end or growth. Even so, Seeking Alpha give FEMS an "A" rating.
seekinglapha.com FEMS scorecard
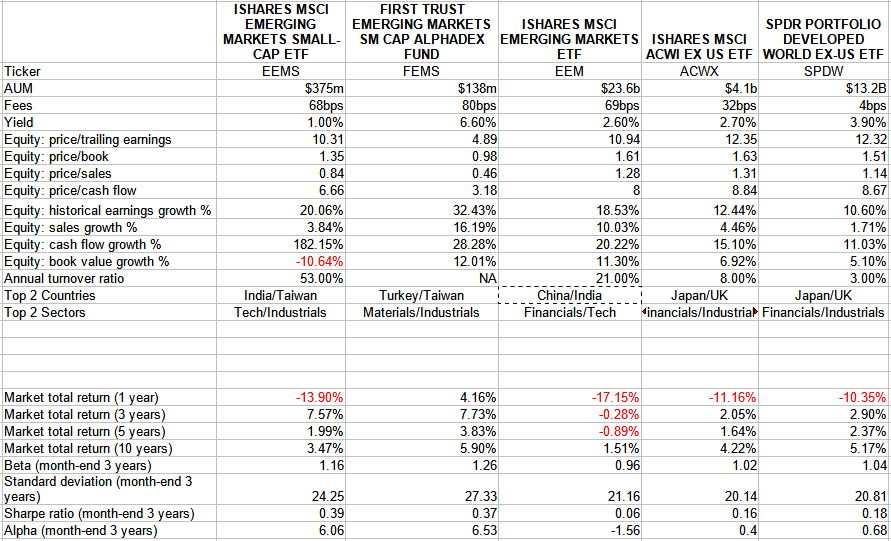
Comparing the ETFs
For this analysis, I included the iShares MSCI Emerging Markets ETF ( EEM ), which is the unrestricted version of EEMS; plus the SPDR Portfolio Developed World ex-US ETF ( SPDW ) to represent the non-US Developed Market results.
Of the two EM SC ETFs, FEMS has done better by investors than EEMS has. The Small-Cap focus proved superior to investing in all EM stocks. FEMS also closely followed the results of SPDW. Combining FEMS and SPDW instead of owning a full international ETF like the iShares MSCI ACWI ex U.S. ETF ( ACWX ) could be considered, allowing the investor to set the weighting between EM and DM stocks.
Here are how the features compare across these five ETFs.
multiple pages; compiled by Author
Portfolio strategy
Many of the sources I found have favorable investment outlooks for EM stocks compared to other equity markets: no distinction was made as to the Small-Cap segments. I lists some next.
After a volatile start to 2023, Emerging Markets should produce strong returns: Once inflation and rates peak in the U.S. and China reopens, the outlook for Emerging Markets should turn more favorable. China equities will likely strengthen due to a reversal in both zero-COVID and property tightening.
Source: newsroom.bankofamerica.com
The 2023 picture might actually be brighter. Emerging markets could benefit from both poles of the global economy: The U.S.—where interest rates may peak, weakening a historically strong dollar—and China, revving up from its slowest growth in decades. “All eyes are on the path of the dollar and China’s reopening,” says Gaurav Mallik, chief investment strategist at State Street Global Advisors. “We’re cautiously optimistic on both.”
Take out China, and 2022 wasn’t so bad, says Jitania Kandhari, head of emerging markets equities research at Morgan Stanley Investment Management. Nine of the year’s top 10 stock markets were in emerging markets.
Source: barrons.com
Driven by China (4%), overall EM GDP growth (2.9%) is above any of the Developed markets.
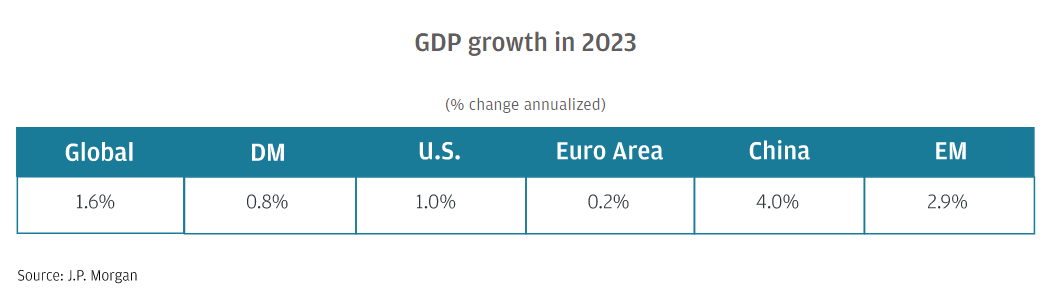
While a strong USD is a negative for EM countries in terms of paying off dollar-denominated debt and higher export costs, other factors should lead to growing economies, such as:
- Young populations with a median age of 34.
- Over 50% of the world's population live in an EM country.
- Almost 50% of the world's GDP, with 67% of GDP growth in the past decade.
- Educated workforce with an average of 10 years of schooling.
- GDP per capita of $38,000 USD; or about 80% of the UK's.
Final thoughts
Owners of many Global or International funds should have exposure to EM stocks, though minimal exposure to the Small-Cap ones most likely. While a good fund’s homepage will provide a complete holdings list, with country-level allocations, fewer provide market-cap allocations. Industry sites like Fidelity or ETFDB.com usually do. Knowing your exposure helps in deciding if you want to add more.
For further details see:
EEMS Vs. FEMS: Comparing Small-Cap Emerging Market Equity ETFs