EICA - EIC: We Need To Talk About Performance
2023-03-07 04:48:57 ET
Summary
- In this article, we focus on the performance of the CLO Debt/Equity CEF EIC.
- Specifically, we discuss the fund's odd underperformance of its underlying asset class as well as other funds focused on similar assets.
- And try to find reasons for the underperformance.
- The key takeaway here is that apart from paying attention to income and underlying asset class, investors ought to make sure the fund actually delivers on its sector premise.
This article was first released to Systematic Income subscribers and free trials on Feb. 27.
It's often tempting to talk about CEFs in terms of their underlying asset classes. This shortcut can be very useful as it provides some intuition about how various funds should perform in different market environments. However, it can also lead investors astray, particularly, if they don't take the chance to make sure the fund is tracking its underlying asset class as expected.
In this article, we discuss the Eagle Point Income Company ( EIC ) - a CEF which allocates to both CLO Debt and CLO Equity securities. The fund has been trading since the second half of 2019. On the face of it, the fund is very attractive as it's one of the few that allocate primarily to CLO Debt securities which have a very attractive profile of high yields and strong historic performance.
The trouble with the fund, however, is that its performance doesn't actually reflect its underlying asset class. Despite a strong environment in credit over the last few years, the fund has delivered negative total NAV returns, significantly lagging both its underlying asset class profile (split CLO Debt / Equity) as well as other funds that allocate to the sector.
While it's tempting to zero in on the fund's attractive yield, rising income and distribution increases, the reality is that a bigger picture reveals the fund has delivered no growth in wealth since inception. In short, a fund can grow income and distributions all it wants, but if it doesn't actually drive wealth growth over the longer term, it's not of much use to investors. Another way to look at it is that the entire payout made by the fund since inception has been matched almost exactly by unrealized losses. This is in contrast to strong performance elsewhere in the credit space both by CLO funds and other credit funds.
This creates both a puzzle and a difficult decision for investors of whether to continue to allocate to a fund that's not actually delivering the same kind of performance as its underlying asset class. In the sections below, we discuss some of the reasons for holding and not holding EIC and highlight potential alternatives until EIC can demonstrate that its performance does not seriously lag other options in the space.
Just the Facts Ma'am
In this section, we discuss the performance of EIC. The difficulty discussing performance of the fund is that it doesn't have a very good benchmark. The benchmarks it lists in its reporting are totally inappropriate for the kinds of assets the fund holds.
That said, we can kind of triangulate the performance of the fund by looking at its absolute performance in the context of the market it has faced, its performance relative to other funds that hold CLO securities and its performance relative to the CLO Debt CLODI index.
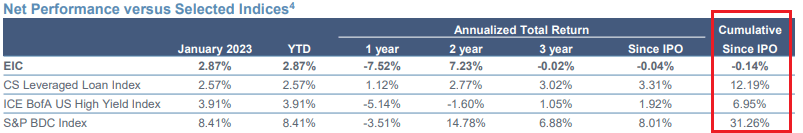
Let's start with absolute performance. EIC provides total price return in its monthly reports with the latest one being as of January. Here we see cumulative total return of near zero versus very healthy figures for the other major credit asset classes.
There are two things we need to keep in mind - the impact of discounts (the returns are shown on price rather than our preferred metric NAV since a sharp widening in the discount could easily explain poor total price returns) and the trajectory of returns (a particularly bad year early on from growing pains, followed by decent performance could be easily forgiven).
As it happens, the fund was at a premium of around 3% for the table above, meaning its performance, if anything, was flattered by the change in valuation since inception. The following table also shows the total NAV performance for EIC alongside three CLO Equity funds and shows a negative total NAV CAGR since inception (the since-inception CAGR numbers are not comparable across funds due to different inception dates).
The table also shows total NAV performance across individual years.
Systematic Income CEF Tool
So we see that total price return and total NAV return from inception is wrapped around zero. We also know that this is well below what other credit sectors like high-yield bonds, BDCs and bank loans have put together.
Perhaps the reason for its underperformance is that assets like CLO Equity and CLO Debt are just very high beta and we just shouldn't be comparing them to more vanilla credit assets. So let's take a look at other funds that hold CLO Equity, either almost exclusively (e.g. OXLC, ECC, OCCI) or in combination with somewhat lower beta assets like bank loans ( XFLT ). The chart below shows total NAV returns from 2020 - a few months after EIC got going. Even in this comparison EIC stands out for its subpar performance.
Systematic Income
If we break down the total NAV return by years, we get the following picture. 2022 stands out as a pretty bad year, however, lots of other assets had bad years then too. OXLC underperformed EIC that year so in this respect 2022 doesn't look particularly bad for EIC.
Systematic Income
If we add XFLT to the same chart, we see that it's actually 2021 that seems odd with EIC not being able to capitalize on a strong market environment. The trio of CLO Equity CEFs delivered an average performance of 32% with ECC and OXLC delivering an average 40% return. The answer to the fund's underperformance likely lies in decisions taken that year.
Systematic Income
Finally, let's check in on the CLODI index from Palmer Square which tracks the performance of CLO Debt rated A, BBB and BB. The total gain for the period looks to be around 15%. This number would presumably be higher for just the BB-rated bucket which EIC primarily holds.
Palmer Square
In short, the fund's performance in absolute terms, relative to other funds in the CLO space as well as a reasonable, if not perfect, benchmark index shows that EIC performance has seriously lagged and investors ought to ask why in a pretty decent environment the fund has delivered a total return of about zero in total price and NAV terms.
Good and Bad Reasons
As with many other popular CEFs, investors likely come across many arguments for holding or passing on a particular CEF. In this section, we touch on some of these arguments for and against EIC and see if they make sense.
Bad reasons not to own EIC include the large holding by a Bermuda-based Enstar Group Ltd. The Bermuda location, which is not uncommon for corporate registrations in the financials sector, strikes some investors as shady. And, in addition, while it's not inconceivable that an exit of this position could hit the price, it's unlikely Enstar would want to shoot itself in the foot with a quick exit even if it wanted to dump the stock.
High overall fee levels in the mid-single digits also put many investors off. The fund's overall fee structure is composed of a 1.25% management fee on total assets, sundry fees of around the same level and a 5% preferred. If we break these down, the 1.25% management fee is on the higher side in the CEF space, however, many other funds have similar (PDO, PAXS at 1.25%) or higher fees (XFLT at 1.7%). The fund's sundry expenses are on the high side and warrant some attention. As far as the fund's interest expense, which is the item that contributes mostly to the overall high fee level, it is actually very advantageous for the company. While most other credit CEFs are paying north of 5.5% for their cost of leverage, EIC is paying 5% (we are ignoring the small impact of issuance costs for simplicity). Investors who balk at a mid single-digit overall fee levels for CEFs fundamentally misunderstand how CEF fees work by comparing them to low-fee Vanguard ETFs which, not only, have passive portfolios but no leverage as well.
Bad reasons to own EIC is the focus of this article and is the obvious statement that EIC is an attractive fund because of its BB-rated CLO Debt focus. BB-rated CLOs boast not only double-digit yields but have performed very well historically as an asset class, even if we quibble about the specific deals in the EIC portfolio.
In our view, this is a bad reason to hold EIC because EIC also holds 30% of its portfolio in CLO Equity - a very different type of security. Secondly, many investors are probably unaware that once CLO Debt tranches start to take losses they start to burn through their principal at a much faster rate than a typical loan portfolio. In our view, this is OK and is the price of admission to CLO Debt but this point is not highlighted very often by analysts pitching the fund.
Finally, and most importantly, the fund's actual performance has diverged to a remarkable extent from CLO Debt, something we try to come to grips with below.
Another bad reason to own EIC is its double-digit yield and rising net income profile. Again, this is because of the massive wedge between the fund's yield and performance, particularly striking in a very good economic backdrop for credit assets. In other words, whatever distributions the fund has paid out has been almost perfectly matched by unrealized losses - a very unusual dynamic in the credit space for the period of the fund's life.
Analysts who are pitching the fund solely on the basis of its attractive asset class need to explain two things: 1) why the fund's actual performance bears little resemblance to CLO Debt / Equity profile and 2) whether this is ever going to change for the better.
Good reasons not to own EIC are the combination of its low absolute performance, significant underperformance against the asset classes in its portfolio and its competitor funds. The fund's valuation has also tended to be very elevated as shown below from our CEF Tool.
Systematic Income CEF Tool
Finally, there are also good reasons to own EIC which include tactical exposure based on either moves in the underlying assets or the fund's valuation. The fund's resilient, fixed-rate and fairly cheap leverage profile also makes it an attractive feature of the fund. Separately, a change in the fund's strategy which leads to outperformance could also eventually be a good reason to hold the fund. Obviously, these are fairly weak reasons but they're there.
What's Happening With EIC Performance?
In this section we try to come up with reasons for such stark underperformance by EIC of its underlying asset classes as well as other funds which hold fairly similar assets.
The obvious answer would be management quality and that could very well be right, except for the fact that the EIC sister fund ECC, which allocates primarily to CLO Equity, has done much better as the chart shows below. Perhaps management is just very bad at managing CLO Debt but not CLO Equity?
The poor performance by EIC could be due to the specific deals the fund is allocating to. Given the average price of CLO Debt in its portfolio, its deals are relatively low quality. Obviously, managing a credit fund is not just about tilting to the highest quality assets. After all, high-yield bonds have outperformed investment-grade bonds over the longer-term. That said, there could be other poorly compensated specific allocation tilts in the portfolio, however, it would require very granular analysis.
Systematic Income
Another reason could be that EIC has a relatively low level of leverage which is a headwind for higher returns. EIC has a leverage target of around 25-35% which seems low for a fund primarily allocated to CLO Debt. ECC runs at about the same level of leverage despite holding primarily CLO Equity. Lower leverage could be a headwind for returns however it's less of a key factor here since EIC has generated negative total NAV returns. Presumably, a higher level of leverage would drive even more negative returns.
Another factor could be the pattern of deleveraging. The fund deleveraged during the COVID period, though it was far from unique in this regard, as well as in Q4 where the credit facility outstanding fell from $21.3m to $9m, equivalent to 13.5% of the fund's NAV. This likely created a drag on returns in 2022 but it doesn't explain the underperformance in 2021.
Finally, this could all be a head fake. Maybe we will see a sharp rally from here on that will erase the fund's cumulative underperformance. If the credit environment remains strong with a low level of defaults, the low dollar-price tranches could pull to par, driving strong gains for the fund. The fund carries a large amount of net unrealized appreciation ($25m or around 20% of the NAV) which has the potential of boosting returns in a soft landing scenario. This is a distinct possibility but it's not something we can have a ton of confidence in.
Takeaways
This article highlights a puzzle that we don't have a ready explanation for - why the performance of EIC has diverged so strongly from its underlying asset classes or competitor funds. This kind of underperformance makes it difficult to have a lot of conviction in the fund's performance going forward. It's particularly unfortunate as there are so few funds focused on the attractive CLO Debt sector. Our view is that investors may want to play it safe and allocate to sector ETFs such as the Panagram BBB-B CLO ETF ( CLOZ ) or the Janus Henderson B-BBB CLO ETF ( JBBB ) until EIC can start to deliver performance more in line with its sector exposure.
For further details see:
EIC: We Need To Talk About Performance