ELMD - Electromed: May Reversal Vindicating Long-Term Buy Thesis
2023-05-20 01:25:31 ET
Summary
- Electromed continues to rally off previous lows and crossed above the 50DMA last week.
- SmartVest numbers are ratcheting higher, CMS waiver decision well priced into the equity level.
- Investing capital back at reasonable returns leading investors to revise expectations, market valuations higher.
- Net-net, reiterate buy.
Investment Summary
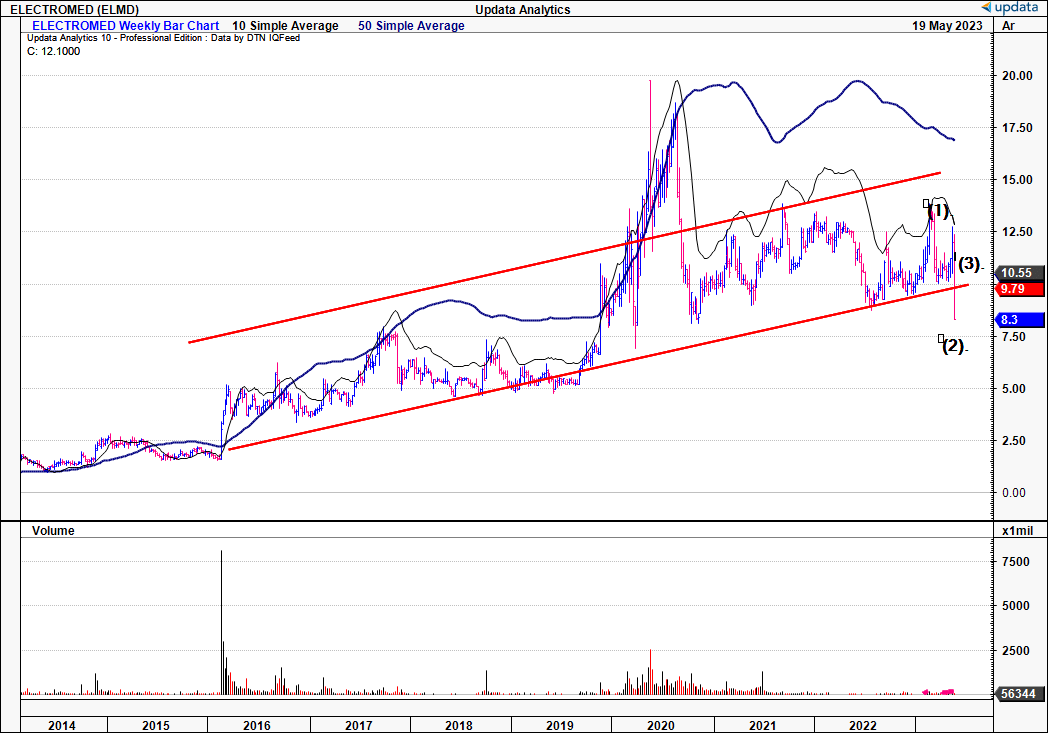
The price response to Electromed, Inc.'s ( ELMD ) Q3 FY'23 numbers suggest the market has revised expectations for the company and expects a tremendous growth period ahead. Following the last publication on ELMD the equity line pulled back to range [Figure 1], without breaking the long-term trend. This year, investors have added another $20mm to ELMD's market valuation off March lows, and the latest up-leg continues the ramp of 8-year cumulative gains.
The firm's latest numbers are telling of its future growth route and investment allocations towards capacity and efficiency. The company's SmartVest offering in the high-frequency chest wall oscillation ("HFCWO") market is a key differentiator, with only a handful of meaningful competitors currently in play, and interesting unit economics tied into the mix.
Now we've had ELMD selling SmartVest for a while now, it's time to offer an informed appraisal on the economic characteristics of its business. Findings reveal this is an investment grade company offering long-term valuation upside. Net-net, the market is rewarding Electromed's investment into future growth with higher market valuations and I believe there is scope for ELMD stock to trade at $22/share.
Figure 1. ELMD 8-year equity line, clear line of support within wide range
Q3 results in detail
As a reminder, chief to the ELMD investment criteria is the success in its SmartVest segment. It is currently gathering more data to support the therapy's use in bronchiectasis. This was discussed at lengths in the December ELMD publication [further, for a deep dive into the pathogenesis, pathophysiology, and aetiology of bronchiectasis, including the expected market trends, see the November publication: here ] . It books revenues through 3-rd party payers (Medicare, Medicaid, DVA, etc.) whom reimburse all or part of the SmartVest cost to patients. These factors impact revenue timing:
- Outright sale, payment based on standard terms.
- Capped installment sale, where the series of payments is capped, and not to exceed a set amount.
- Installment sale, where the SmartVest System is paid for over a period of several months.
One key near-term catalyst to look out for is ELMD presenting the data from its QOL study of SmartVest with chronic obstructive pulmonary disease ("COPD") patients at the American Thoracic Society ("ATS") international conference later in May. Positive data could be catalytic in the near-term.
1). Earnings desegregation
Looking straight to the Q3 numbers, eyes are immediately drawn to SmartVest figures and the CMS waiver. Key takeouts from the quarter are as follows:
- Top-line growth of 19% YoY pulled to $12.1mm, underlined by $11mm clip in home-care (SmartVest) sales. Growth was underscored with increased productivity from the salesforce, in addition to the newest Clearway launch. By the end of Q3, it had 48 reps in its headcount, and the good news is they look to be productive early on. One issue in adding new reps is rep quality (productivity), not to mention the length of time/investment required in training, and the potential staffing turnover when recycling reps. Q3 revenue per rep was $908,000, within management's range if $850-$908,000. Assuming 48 sales reps, for ELMD to do $50mm in FY'23 revenue, you're looking at average $1.04mm from each rep to get there.
- SmartVest sales were $11mm [Figure 2], up 21.5% YoY, thereby demonstrating the accelerated uptake in SmartVest units. Another 20% from FY'22 gets you to $50mm, and this is very reasonable in my estimation.
- Very importantly - the CMS referral waiver was again a tailwind for SmartVest sales in Q3. This waiver, brought on during the Covid-19 period, has now expired. Notably, this was expected, but it is unclear what immediate impact will be seen, having patients go through standard referral and documentation processes once again. Hence, the next quarter's results will be telling to see how ELMD rounds out the year. Related to this, management noted it will revert to its pre-pandemic CMS requirements for HFCWO.
- In my opinion the impact could be minimal, and already be priced into the ELMD's equity. Physicians were operating under the reinstated before the pandemic for one, and that the waiver only benefitted a portion of ELMD's overall referrals. Still, you'd expect some lengthening in referral time and time to approval. Again, Q4 revenues will be telling.
Further, management ramped up quarterly SG&A investment 18% YoY to $7.7mm, associated to the increased headcount.
Figure 2.
Data: Author, ELMD 10-Q
2). Capital recycling
A look beyond the financial performance demonstrates the economic characteristics of ELMD's business. A thoughtful analysis of the future can't occur without knowledge of how ELMD is recycling capital back into growth investments, profits, then market valuation, at this early cycle in its business.
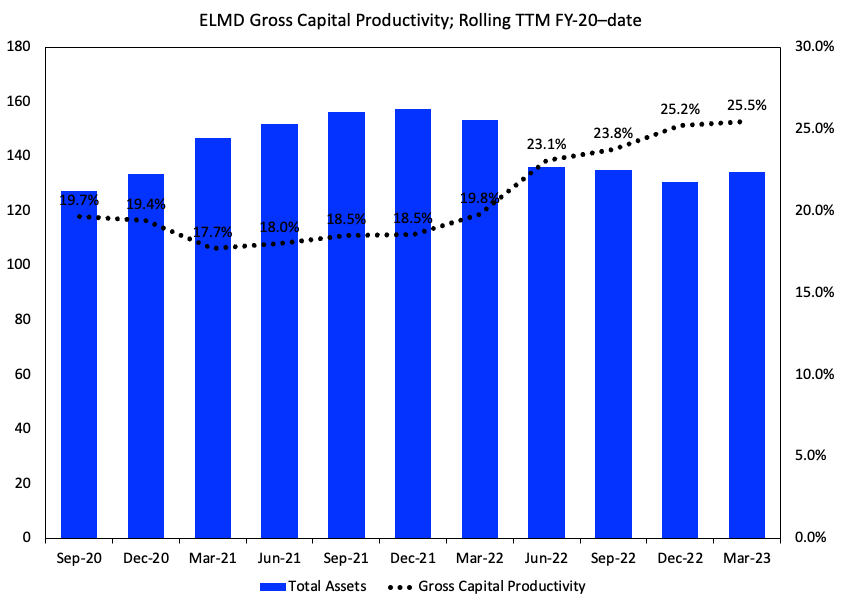
If you roll your eyes to Figure 3, you'll note productive asset growth has remained light over the past 2-years. Here, the gross capital productivity is shown by calculating the rolling TTM gross profit divided by the total assets each quarter. It shows that:
- Cumulative gains in gross profitability over the last 2-years, now producing $0.25 on the dollar from its operating assets.
- There is plenty of headroom to broaden the capital pool without over investing in my opinion.
The upside in gross capital productivity is evidence of ELMD's capacity to make money. I'm looking to the gross each quarter, then to the capital required to produce this, and noting profitability increasing over time. As the firm hits scale, there's chance gross margin will further benefit from economies of scale on the cost side.
Figure 3.
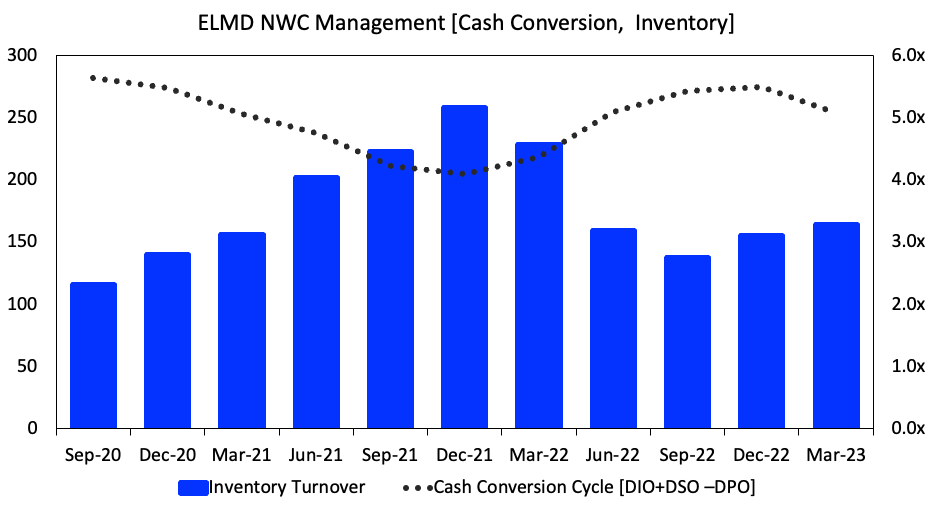
The above chart is best compared with Figure 4, illustrating the firm's rolling TTM inventory turnover and cash conversion cycle. Notably, you've got ELMD recycling inventory 3x per annum, whilst at the same time not committing obscene amounts of additional net working capital, therefore realizing ~230-250 days in cash conversion. This number looks to be trending down as well. If it continues, there's less cash tied up in working capital, conducive to reinvestment and/or earnings growth. Hence, thus far, 1) lean, profitable assets, and 2) rotating working capital back to cash effectively.
Figure 4.
3). Economic Earnings
The breakdown of capital usage and provided is noted in Figure 5. It illustrates the reconciliation in return on capital investments from Q3 TTM revenues, from 2021-2023.Total Capital at risk is $34mm as of last quarter, including fixed assets and NWC. Further, you'll note the firm had been provided $36mm in investor capital up to that point. You can also see the firm rolling over capital provided to productive assets over this time.
If you're investing in the equity of a business, this economic analysis of a firm's business demonstrates the value of investor capital (debt, equity) in the hands of a company. If you're going to continue allocating to ELMD, you'd want the firm to be profitable, and investing in new opportunities along the way. You'd also want it to be converting the capital it invests (from the capital provided) into additional market valuation.
Key observations from Figure 5 include:
- The firm is fully invested, with the bulk of capital tied up in net operating assets.
- Routinely producing 6-8% returns on existing capital on a rolling basis. Returns on incremental capital are notable too, 81.5% in Q1'FY22, 98% last quarter.
- The bolus of profitability is obtained on the production side, with relatively low capital intensity to generate earnings. Capital invested turnover up from 1x to 1.3 in 2-years, illustrating the efficiency points. Plenty of headroom on the NOPAT margin front, keep close watch on this number moving forward.
- The firm has been reinvesting 20-60% of TTM post-tax earnings back into additional growth investments each quarter.
Incrementally, the market has rewarded these investments with higher market valuations over time, implying the revised expectations baked into ELMD's stock price. From Q1 FY'21-23, the firm's market cap increased $25mm (to the point of writing) on just a $4.2mm incremental investment. Hence, each $1 ELMD put to work was rewarded with $5.95 in market valuation.
Figure 5.
Data: Author, ELMD 10-Q
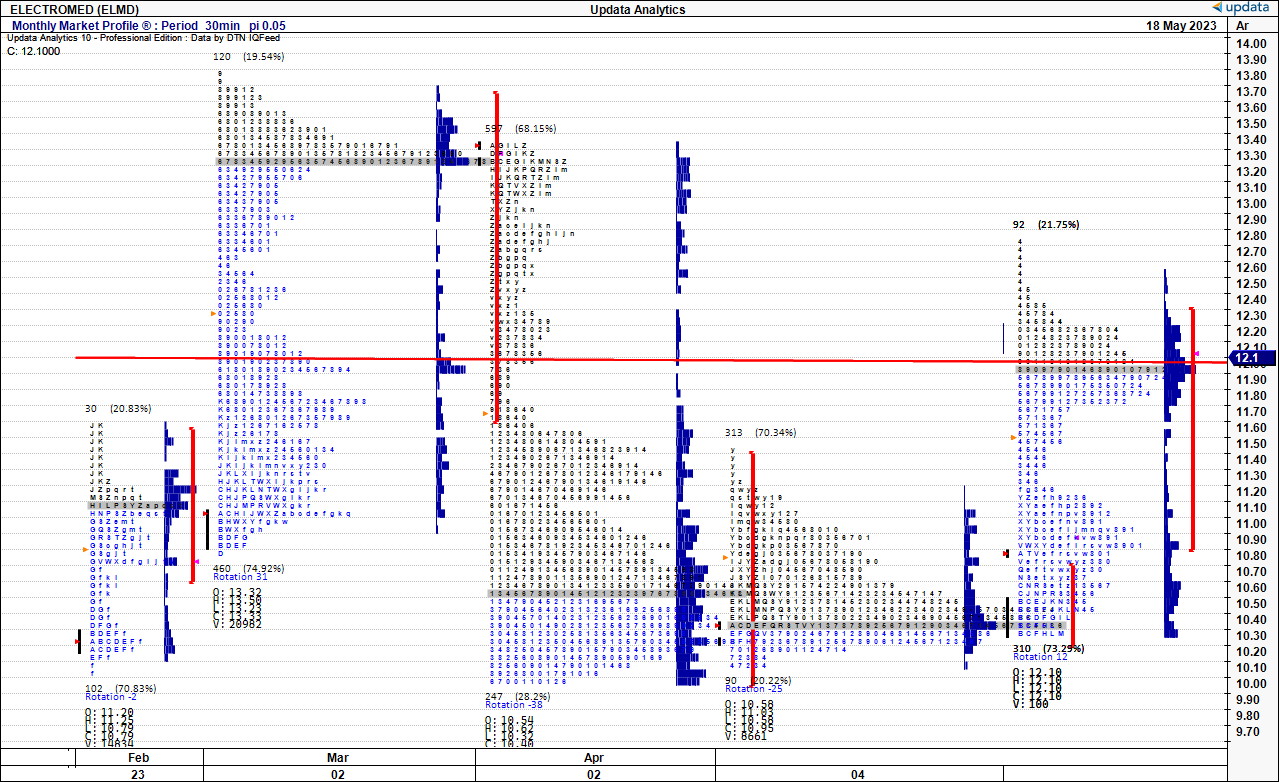
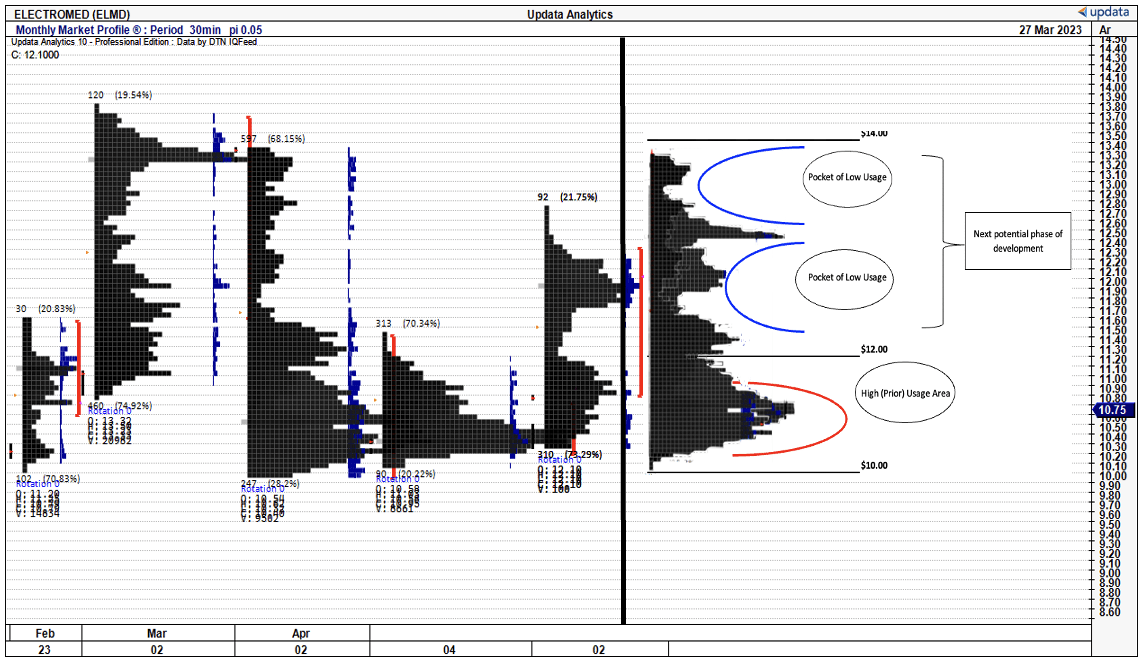
4). Market generated data
Tremendous amount is gleaned from market generated data that guides price visibility looking ahead. Figure 6 outlines the price distribution over the past 4 months of trade for ELMD's common stock. The histogram in the market profile illustrates the length of time spent at each time during the month. This profile looks at $0.1 increments. You can see the cyclicality as the market auctions higher or lower at different value levels.
Figure 6.
The charts are best viewed as a collation of data. Robin Mesch, of Mesch capital management, a trading firm that designs institutional trading strategies with market profile, explains how market's rotate in and out of sections of high usage to low usage. In other words markets move, in search of price discovery. The past 4 months of profile data are amalgamated into one series as seen in Figure 7, to cleanly display the entire distribution of pricing over the last 4 months.
As seen, the value zone has formed towards the lower end of the price distribution. Notably, as markets rotate out of high usage into pockets of low usage, we can gauge the next potential phase of development, as a new directional move begins to explore prior under-developed areas. T
The chart shows two pockets of low usage in the $12-$14 zone (blue arches) suggesting a potential upshift into that zone. If markets do in fact efficiently flow from high usage to low usage zones, just like the osmotic principles of water, I believe this is a fair range to expect over the coming few weeks to months.
Figure 7.
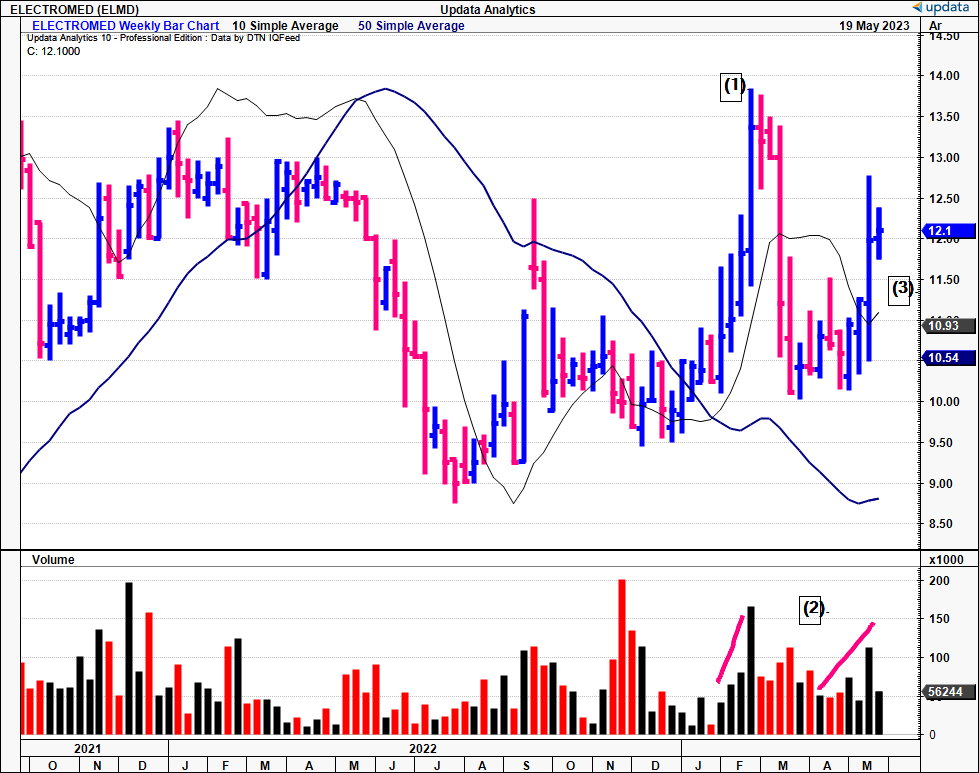
Second, the recent price action is bullish in my opinion. Weekly trend bars are seen in Figure 8. Your chart starts at point (1) listed next to the price line. For starters, the initial price rally abruptly ended with the climax top at (1). Key to that thrust was the volume drying up into the move, and the heavy buying volume for the next 4-weeks after the reversal. Looking to the latest price action:
- Reversal off ascending double-bottom (higher lows) with 4 weeks of sharp recovery.
- Shares now above 50DMA at point (3) awaiting catch up from 200DMA.
- No volume dry-up but 2-3 weeks of ascending buying volume at point (2). If it continues like this, it could be a good couple of weeks ahead.
Figure 8.
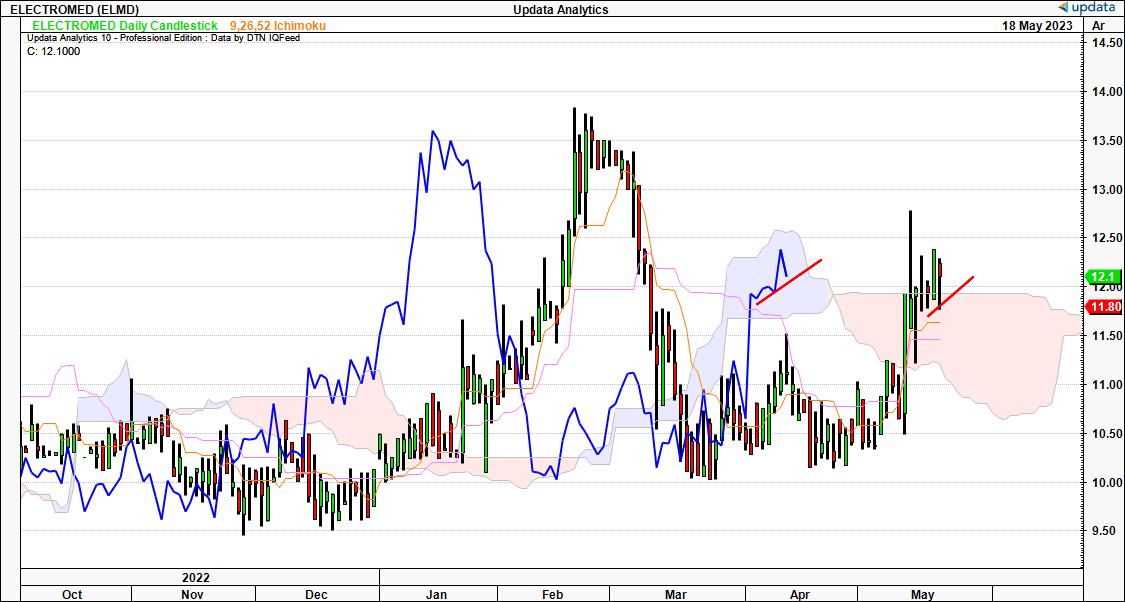
Key trend findings on the daily cloud chart, looking to the coming weeks, are as follows:
- Shares testing the cloud top, finding support at this level. Lagging line in the cloud but pushing north.
- A break from here would be bullish in my opinion and have the price line above the cloud.
- If the lagging line breaks $12.30 by June this could be confirmation of this nudging up into new highs.
This chart is beginning to look quite constructive and supports earlier technical findings.
Figure 9.
This is well supported in point and figure studies who throw off upside targets to the $14-$15 zone, in-line with what's been discussed thus far. Point and figure charts are tremendously valuable in this instance as they remove the short-term volatility within trends and just look at a smoothed directional bias. You can expect more objectivity by removing the short-term noise of time. Next price objectives are to the $14-$15 region based on these technical findings in my view.
Figure 10.
Data: Updata
Valuation
ELMD stock is priced at a premium to peers at 27x forward EBIT, a 60% premium to the sector. but the debate is whether a) this is wildly overpriced, or b) a reflection of the market's forward growth expectations. It's important to gauge what expectations are in the stock price to understand any mispriced odds the market's vs. our own. At the current market valuation of $103mm, and assuming a 12% discount rate (long-term market averages):
- The market expects $12.5mm in post-tax earnings from ELMD and values the firm's future earnings at this amount, assuming no growth into perpetuity, getting you to the $103mm ($12.5/0.12 = $104).
- From the current tailing NOPAT of ~$2mm, the market expects tremendous growth numbers from ELMD, to compound earnings at 85% into FY'26 to arrive at the $105 mark (($2x1.85^3)/0.12 = $105).
- If the market expects this kind of growth then it is likely ELMD deserves to trade a premium to peers.
My numbers have ELMD to do $50-$55mm in top-line revenues this year and pull this to $4mm in post-tax earnings, signifying ~40% YoY growth. At the market's 85% expected growth rate, I get to a market valuation of $211mm or $22 per share, 52x forward EBIT and 83% upside on the current market value. Even though ELMD is pricey, these numbers still very much support a buy.
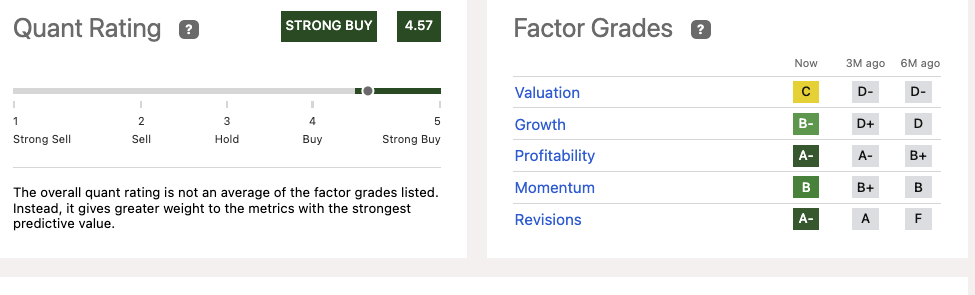
Further support is recognized in the "strong buy'' rating issued by the quant grading system It is not often this conviction is displayed using these objective measures, that serve as a terrific measure of objectivity. That the quant system is in full support of a buy rating on ELMD is further bullish weight in the risk/reward calculus.
Figure. 11
In short
The latest numbers from ELMD are conducive to a reiterated buy rating in my informed opinion. The firm is growing top-line revenues with SmartVest placements and recycling capital back into the business at reasonable rates of return. The market has revised its expectations higher on ELMD's prospects following its financial performance and capital investment decisions. I believe there is scope for the stock to rate much higher, and expect $4mm in post-tax earnings this year, compounding aggressively to a $211mm ($22/share) valuation over the coming years. Net-net, reiterate buy.
For further details see:
Electromed: May Reversal Vindicating Long-Term Buy Thesis