EMRAF - Emera: Ploughing Capital Into Growth Operations But At Uncertain Future Returns
2023-09-21 01:56:06 ET
Summary
- Emera Incorporated is investing heavily in its growth operations, without the corresponding equity returns.
- The company's balance sheet is heavily leveraged, and it operates in a capital-intensive business with large investment requirements.
- Returns on incremental investment are notable, but the legacy business returns aren't pulling their economic weight.
- Net-net, rate hold.
Investment briefing
Emera Incorporated (EMRAF) has emerged on our radar as a company ploughing swaths of cash into its growth operations at reasonably attractive incremental returns. But the equity returns haven't matched this level of investment, illustrating the soft market returns on investment [Figure 1]. On further examination, the company's balance sheet is heavily leveraged, and this is a high-margin, capital-intensive business with large investment requirements to fuel business growth.
As a reminder, EMRAF provides energy and energy services in the U.S. and Canada. It has several operational segments, outlined in Figure 1(a). EMRAF generates its power from a variety of sources, such as coal-fired, natural gas and/or oil, hydro, wind, solar, petroleum coke, and biomass-fueled power plants. EMRAF also operates a 145-kilometer pipeline that transports re-gasified liquefied natural gas from New Brunswick to consumers across the northeastern U.S.
This report will unpack the major economic moving parts in the EMRAF investment debate, paying close attention to the firm's capital allocation and what this could mean for investors going forward. Net-net, I rate EMRAF a hold based on the factors raised here.
Note: All figures are presented as USD here unless stated otherwise.
Figure 1.
Figure 1(a).
BIG Insights
Critical investment facts underpinning the hold thesis
1. Q2 FY'23 insights—operations and CapEx schedule
- Q2 FY'23 operations breakdown
EMRAF booked growth in operating revenues of $38mm in Q2 , putting up $1.42Bn in Q2. However, after accounting for mark-to-market ("MTM") hedging losses of $108mm, it booked a net decrease of $70mm. The accounting losses came from reduced fuel revenues at NMGC, TEC, and PGS, along with EMRAF's changes to the fuel cost recovery method for an industrial client at NSPI. Unfavourable weather at its TEC asset also played into this. Still, TEC clipped a 5% or $6mm growth in earnings, due to new base rates that were implemented from January 1st.
For the YTD, operating revenues increased by $456mm YoY to $3.85Bn. After accounting for the MTM loss of $325mm, the net increase was tighter at $131mm. At the same time, OpEx was down $94mm compared to H1 last year. It pulled this to Q2 adj. earnings of $162mm, $0.60/share.
The summarized breakdown of all segments is seen below, with the critical takeouts in dot form (Full H1 segment contributions observed in Figure 2):
- Tampa Electric (Florida Electric)
- Operating Revenue: $677mm, up from $663mm YoY
- Electric production volumes: 5,726GWh, up from 5,752GWh
- Average fuel costs: $29 MWh, down from $39 MWh
- Canadian Electric Utilities
- Operating Revenue: $340mm, down from $375mm last year
- Electric production volumes: 2,430 GWh, roughly flat with 2,494GWh
- Average fuel costs: $93 MWh, again flat with $94 MWh
- Gas Utilities + infrastructure
- Operating Revenue: $209mm, down from $266mm in Q2 FY'22
- Gas sales volumes: 698 mm/Therms, up from 654 mm/Therms
- Regulated cost (nat. gas): $43, down from $116
- Other electric utilities
- Operating Revenue: $93mm, down from $102mm YoY
- Electric production volumes: 346GWh, up from 335GWh YoY
- Average fuel costs: $139 MWh, down from $182 MWh
BIG Insights
- Segment-wise CapEx + FY'23 CapEx projections
The firm carries a heavy debt load of ~$12.4Bn, to which it paid out $633mm in net interest over the TTM. We can't ignore this in my opinion, especially combined with (i) the current rates axis, (ii) the company's CapEx/investment schedule [discussed below], and (iii) the firm's $1Bn in operating cash flow H1 FY'23, much of which will be deferred toward cash interest this year.
To this point, EMRAF has strategically decided to defer an incremental investment of $240mm to its Labrador-Island Link asset from this year out to '24. The decision is expected to free up cash flow due to (i) the reduced interest expense, and (ii) the obvious decrease in associated funding requirements.
Nevertheless, EMRAF's capital deployment is a fact to comment on. It surpassed $1.4Bn in H1 '23, up 25% over the same period in '22. Management expects to allocate ~$3Bn in total capital investment for the year, stretching this up to a cumulative $8–$9Bn by FY'25, as seen in Figure 3.
For '23, EMRAF's CapEx projections, including segment are as follows (as a reminder, all figures are in USD):
-
TEC: An estimated capital investment of $1.4Bn, up from last year's $1.1Bn.
-
NSPI : Anticipated capital investment of c.$405mm.
-
Gas utilities + Infrastructure: Estimated CapEx of $500mm.
-
Other electric utilities: Expected CapEx of ~$65mm.
Figure 3.
Source: EMRAF Q2 investor presentation
2. Economic performance analysis
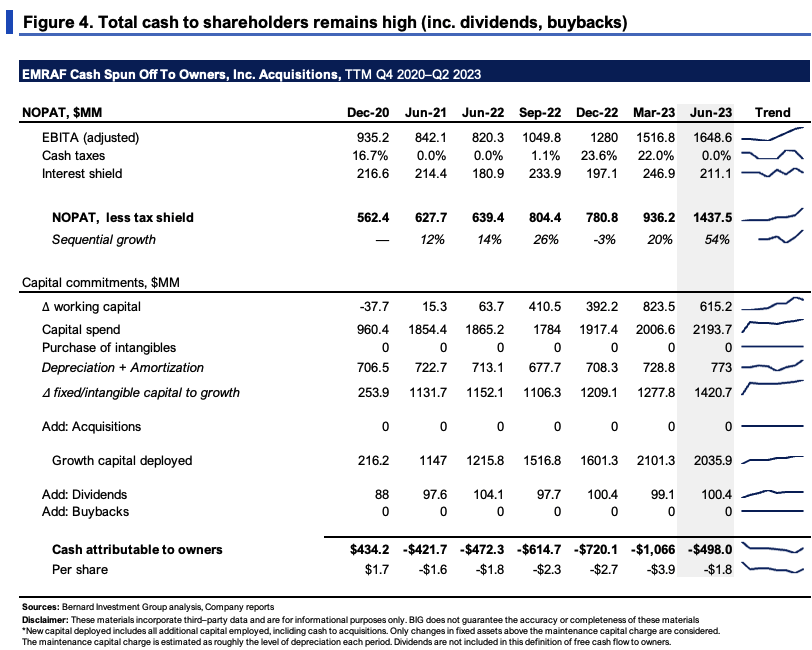
It's notably clear that EMRAF is investing heavily into its growth operations. Figure 4 captures this well. It shows the new capital deployed on a rolling TTM basis along with the cash flows thrown off. To capture the level of growth investment, only changes in fixed assets above the maintenance capital charge are considered. The maintenance CapEX is approximated at the level of depreciation each period. Dividends are also included in the definition of free cash flow to owners.
Critically, the firm is investing well above $1Bn each quarter into its growth initiatives, putting $1.4Bn to work in the 12 months to Q2 alone.
Figure 4(a) shows the incremental investment relative to sales and operating margin since 2020. Over this time, each new $1 in operating revenues was accompanied by $1.01 in NWC, and $1.30 in investment to fixed capital. Including intangible assets acquired, the firm invested $2.88 for ever new $1 in sales.
BIG Insights
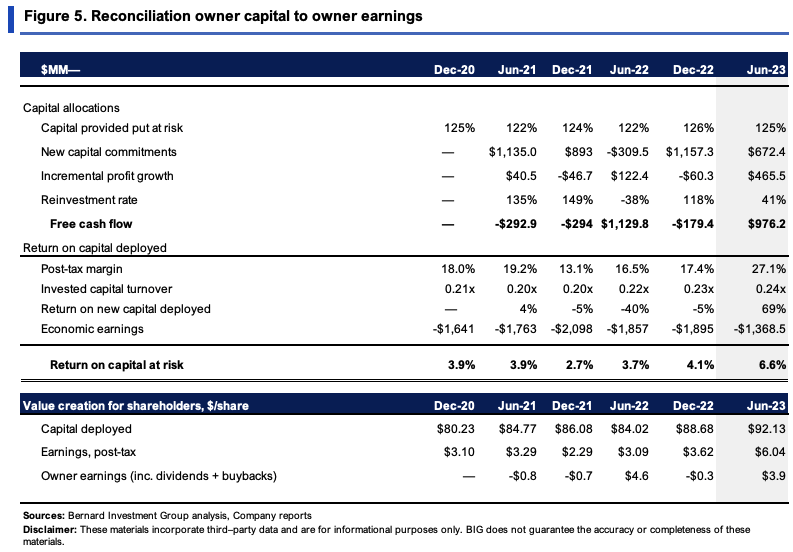
As to the economic performance of this incremental investment to date, Figure 5 captures the returns on existing and new capital deployed. In Q2, the firm's $92.13/share existing assets threw off $6.04/share in post-tax earnings, just 6.8% return on investment. Post-tax margins are exceptionally high as well, at 27% last period. This is let down by the capital efficiency, with each turn of capital at just 0.24x of sales.
But from FY'22 to H1 FY'23, the firm invested another $1.2Bn, growing NOPAT by ~$670mm. Hence, the return on new capital was roughly 60% on this investment. Using a rolling TTM analysis, from Q1–Q2 this year, the return on new investment was 69%, further implementing this point.
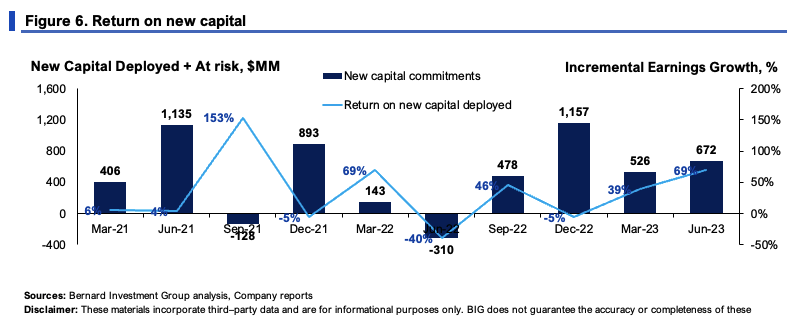
The full spectrum of incremental return on investments is seen in Figure 6, and you can see the growth percentages have been healthy on aggregate. This is something to heavily consider given the company's CapEx plans going forward in my view.
Note: FCF is represented here including all investments subtracted from NOPAT, not just growth investment as in Figure 4. (BIG Insights)
3. Technical factors for consideration
Figure 7 shows the money flows into/out of EMRAF's equity stock over the last 10 months or so. Critically, rolling into H2 FY'23, you can see the heavy outflows that have ensued. This corresponds with the stock's price performance and shows the lower bids investors were accepting to exit their positions in my view. Money flows have kept low with no signs of reversal this month to date.
Figure 7.
Data: Updata
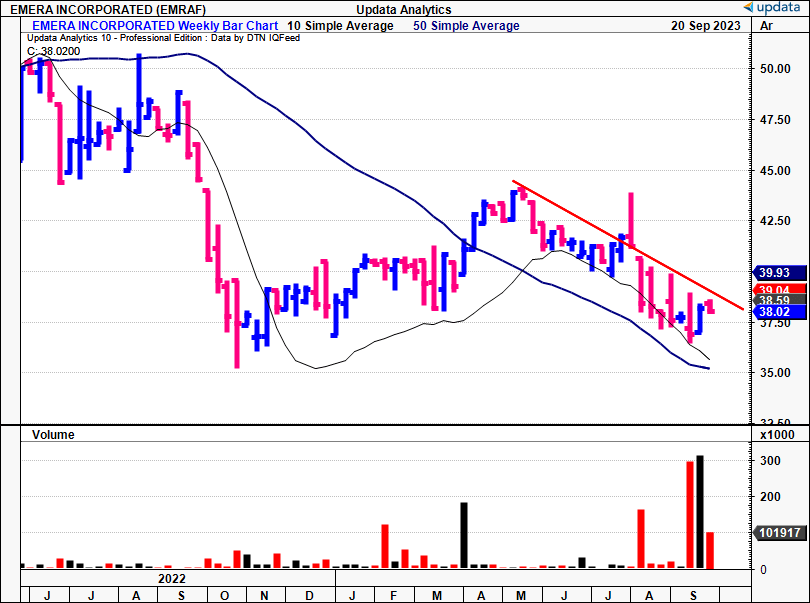
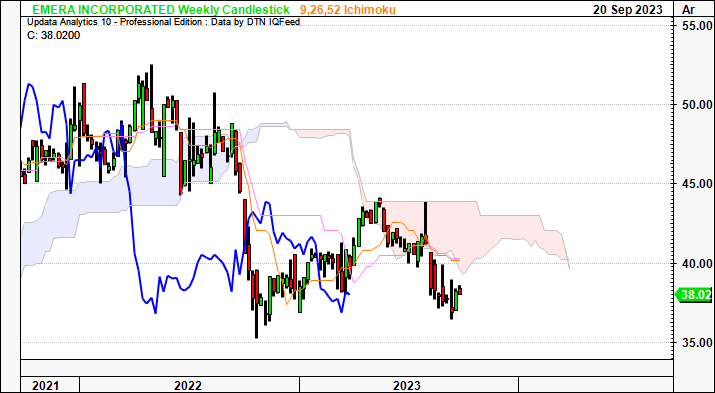
The stock is also trading below the cloud support as seen in Figure 8, lagging line in close pursuit. Critically, it has tested the cloud top twice throughout '23 at the same level and been rejected twice, selling off after both instances. You'd need a break above $43.00 by December in order to suggest a bullish reversal. Until then, EMRAF has been riding the cloud base with conformity, not the most attractive scenario.
Figure 8.
It's not surprising to see we have a relatively tight cluster of price targets in the $38–$43 region on the point and figure studies below. P&F studies are terrific in that they provide a more objective view of the trend action and remove any intra-trend volatility. Hence, the directional bias is neutral in my opinion.
Figure 9.
Data: Updata
Valuation and conclusion
The stock sells at 11x trailing earnings and 18.75x forward EBIT. The latter multiple is flat with the sector. The question is what's on offer for these prices. There's a few things to consider in that vein:
- The company's capital intensity and heavy CapEx schedule (including the projections) should be called into question. The market has priced EMRAF at ~1x EV/invested capital, implying it doesn't expect a great deal of earnings growth on the existing, and/or forward investments.
- If looking at the business returns on existing capital, the market may have priced this correctly as well, reflecting the growth potential well in EMRAF's current EV. But, if considering the incremental returns produced on new capital, the market may be under-reflecting the earnings power, as seen in Figure 10. Again, it depends on how you look at it here. I am more aligned with the market's view.
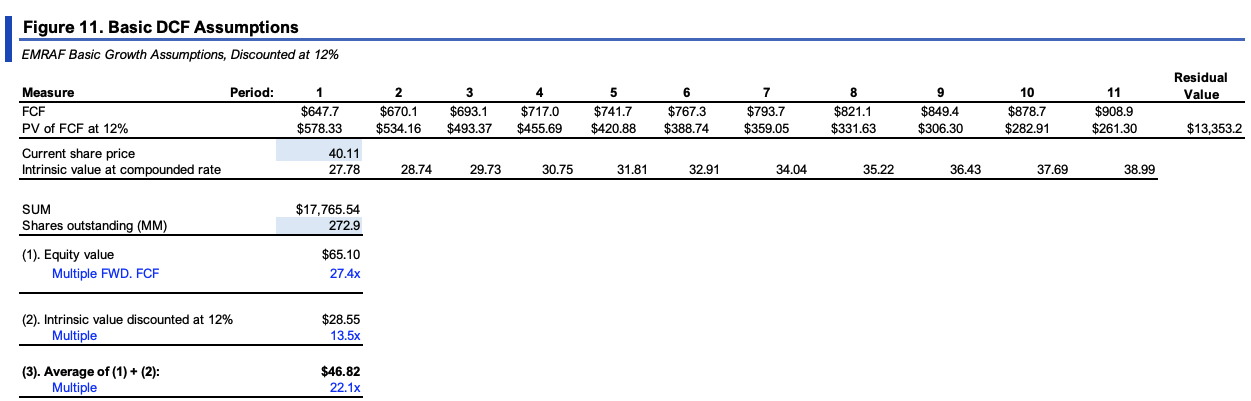
- Extending the figures in Figure 4(a) out to FY'28, then discounting at the 12% hurdle rate we employ across all our equity risk budget, gets you to a figure of ~$65/share. Then, examining the implied intrinsic value as a function of the forward ROIC and reinvestment assumptions, this derives a value of ~$28.50. The average of the pair comes to $46.80, roughly 22% value gap as I write. You can see this in Figure 10.
This is encouraging. But, changing the forecast sales growth to 1%—in line with consensus —the value gap is less convincing at ~11%. Plus , given the fact of (i) the firm's heavy debt load, (ii) the slack returns on 'legacy capital', (iii) unsupportive technicals, and (iv) expected revenues are in fact set to be within the 0–1% range, I'd want a much higher margin of safety to work with here. Alas, I am happy to watch on the sidelines for now.
BIG Insights Note: Shows 3% revenue growth rate. At a 1% revenue growth rate, the valuation is $40. (Source: BIG Insights Estimates)
In short, EMRAF is ploughing capital into its operations and spending big on new growth initiatives, that much is clear. The incremental profit gains it is achieving on this is also commendable. But, with each new $1 in investment, this broadens an already large existing capital base, which isn't pulling its economic weight on my examination. This dichotomy presents a challenge to EMRAF trading higher in my view. The market has priced EMRAF at just 1x invested capital, which tells me it expects flat earnings growth off these assets going forward. The data also supports this view in economic terms and from market technicals. Net-net, I rate EMRAF a hold, but am watching the outcome of its heavy growth CapEx schedule very closely moving forward.
For further details see:
Emera: Ploughing Capital Into Growth Operations, But At Uncertain Future Returns